Elemental Analysis of Human Blood Serum
by Microwave Plasma — Investigation of the Matrix Effects Caused by Sodium Using Model Solutions
Edina Baranyai1,2 &Csilla Noémi Tóth1,2&István Fábián1,3 Received: 27 March 2019 / Accepted: 26 April 2019 / Published online: 9 May 2019
Abstract
Human blood is a complex sample matrix when elemental analysis is considered. In this study, the effects of Na, a natural component of serum samples, was investigated in the quantitative determination of Ca, K, Mg, Cu, Zn, and Fe by microwave plasma atomic emission spectrometry. The robustness of the microwave plasma was tested by evaluating MgII 280.271 nm/MgI 285.213 nm by varying two adjustable operating parameters, the read time, and the nebulizer pressure. The read time has no influence on the robustness while the MgII/MgI ratio decreased when the nebulizer pressure was increased during the analysis.
The threshold concentrations of the interfering Na were determined at the analytical lines used for the measurement of other elements. The matrix effect of the commercially available microwave plasma was studied by a series of model experiments with human blood. The increasing concentration of Na in the matrix within the normal ranges reported for blood serum increased the intensities of the measured atomic lines. According to a factorial design—where two applied factors were the concentration of Na matrix and the measured elements as well as their levels were considered as factorial points—it was found that the Na concen- tration in a serum sample after acid digestion and 10 times dilution affected the intensity values of the measured elements. For Ca, Cu, and Fe, a statistically significant effect was observed, while for Zn, Mg, and K, an interaction effect was also found. However, after calculating the percentage errors caused by the shift, the relative difference was observed to be quite small (< 10%).
Keywords Blood serum . Matrix effect . Sodium . Elemental analysis . MP-AES
Introduction
Atomic spectrometry provides various efficient possibilities for elemental analysis which is mostly designed to measure the analyte from a solution [1]. Microwave-induced excitation sources have been investigated for decades to produce an al- ternative method of inductively coupled plasma optical emis- sion spectrometry (ICP-OES), which is still the most com- monly applied instrument in routine analysis [2–5]. Many
articles have been published on the attempts to create a robust microwave-induced plasma (MIP) operating at lower gas flow and electrical capacity [6–11]. However, the analytical perfor- mance of these MIP-OES instruments have not reached that of the ICP. The matrix effect of the MIP proved to be higher, and even a small volume of the introduced sample resulted in plasma instability due to its low tolerance for wet aerosols [12]. Hence, microwave-generated excitation sources have not gained wild commercial interest [8,13,14] even though the development of higher-power microwave plasmas proved to be more promising [15–17].
Despite of the disadvantages, the development of MIP dis- charge has continued to be in the focus of producing a cheaper and easier-to-operate technique and many initial issues have been resolved. In 2008, Hammer reported and described a plasma source excited by the combination of magnetic and electric fields which approached the operation stability of the inductively coupled plasmas [18]. Based on this invention, the first commercially available microwave-induced instrument was launched to the market in 2011 [14,19,20]. The excita- tion source is supplied by nitrogen gas produced continuously
* Edina Baranyai
baranyai.edina@science.unideb.hu
1 Department of Inorganic and Analytical Chemistry, University of Debrecen, Egyetem square 1, Debrecen H-4032, Hungary
2 Atomic Spectroscopy Partner Laboratory, Department of Inorganic and Analytical Chemistry, University of Debrecen, Egyetem square 1, Debrecen H-4032, Hungary
3 MTA-DE Redox and Homogeneous Catalytic Reaction Mechanisms Research Group, University of Debrecen, Egyetem tér 1,
Debrecen H-4032, Hungary
#The Author(s) 2019
in a generator. This is the most cost-efficient method in today’s atomic spectrometry. The toroid-shaped microwave-induced nitrogen plasma is robust enough and supplies sufficient en- ergy to handle different types of samples that can be utilized in many practical applications. It has a lower temperature (ap- proximately 5000 K) compared to the inductively coupled plasma; thus, the technique is placed between ICP-OES and FAAS (flame atomic absorption spectrometry) as far as the sensitivity and detection limits are concerned. The launched MIP-AES instrument has already been used for several appli- cations, but it still tries to find its place among the atomic spectroscopy methods.
The elemental analysis of human blood is significant in the routine clinical practice as well as in medical research. The elemental concentration levels of blood serum may indicate certain diseases; therefore, their determination is useful for establishing diagnosis [21–23]. Blood itself is a rather com- plex sample matrix to analyze since its organic content is high, and it also has a remarkable level of sodium which may cause interferences in atomic spectrometric methods. Sodium is one of the so-called easily ionized elements (EIEs) which is a well- known and common interferent in atomic spectrometry. Its effect is more complex in the case of ICP compared to AAS (atomic absorption spectrometry) as it cannot be simply ex- plained by the low ionization potential neither linked to a single origin [24]. Its low first ionization potential is respon- sible for the shift which can be observed in the spatial distri- bution of the analyte-ionization equilibrium [25–27]. The rel- atively low concentrations of the measured trace elements in such a complex matrix make the human blood serum analysis even more difficult to carry out with reasonable precision.
The matrix effects occurring in the emission source during the measurement is highly important to be studied since it affects the analytical results [12]. Due to the lower power, microwave plasmas are more sensitive to matrix effects than the inductively coupled plasmas [28]. This interference can generally be reduced by increasing the microwave power [12]. The most widely applied technique to determine the elemental concentration of human body fluids is ICP-OES and ICP-MS (inductively coupled plasma mass spectrometry) [29,30]. The robustness and matrix effect for the ICP have been heavily investigated while the MP is a relatively new technique in its recent form. Thus, the aim of this study is to evaluate the matrix effect for the commercially available mi- crowave plasma instrument in human blood analysis and to determine the effect of a high Na level on the results for other elements.
For these studies, three macroelements (K, Ca, and Mg) and three microelements (Cu, Zn, and Fe) were chosen which are commonly determined in blood serum due to their essen- tial role in the human body [31–36]. The robustness of the microwave plasma together with the threshold concentration of the Na matrix was determined prior to the experiments.
Materials and Methods
The Composition of the Model Solutions
According to our previous paper, blood serum can be conve- niently analyzed by MIP for Mg, Ca, K, Zn, Cu, and Fe after acid digestion (HNO3+ H2O2) and from 10 times dilution with ultrapure water [34]. In the present study, the composi- tion of this diluted and pre-treated blood serum was modeled.
Thus, any case model solution is mentioned; it is referred to the composition of the digested and 10 times diluted blood serum, respectively.
The Robustness of the Microwave Plasma and the Threshold Concentration of Sodium
To investigate the robustness of the microwave, plasma Mg was chosen as the test element on the same ionic and atomic lines that were described in earlier reports (MgII 280.271 nm/
MgI 285.213 nm) [24,25,37]. Although the MP-AES soft- ware offers less ionic lines compared to the ICPs, these two are both available.
The expected average concentration of Mg was 3 mg L−1in the digested and 10 times diluted blood serum samples. Such model solutions were prepared from a commercially available mono-element spectroscopic standard of 1000 mg L−1 (Merck, Germany). In accordance with the typical blood se- rum composition, the concentration of Na was set to 300– 400–500 mg L−1 using reagent-grade solid NaCl (VWR International, USA). All model solutions were prepared in the presence of the Na matrix applied in the three different concentration values and the absence of it in triplicate, togeth- er with blank samples. The measurement of the model sam- ples was carried out using calibration solutions with and with- out the Na matrix. In order to determine the best emission intensity ratio of the MgII 280.271 nm/MgI 285.213 nm lines, the intensities were measured by varying the read time (1–2–
3–5–10–20–30 s) and nebulizer pressure (80–100–120–160–
180–200–240 kPa).
The threshold concentration for the Na as an interfering element was determined by analyzing the single element so- lution of Na in the same concentrations as used in the robust- ness study (300–400–500 mg L−1) and measuring the emis- sion intensities of the selected analytical lines of the measured elements (K, Ca, Mg, Cu, Zn, and Fe) [38].
The threshold concentration was calculated on the basis of the following expression:
Cthreshold¼3 SDblankCNa
SigAl ;
SDblank the standard deviation of the blank sample CNa the concentration of the Na present as the
interfering element
SigAl the intensity signal obtained at the particular analytical line of the measured elements (K, Ca, Mg, Cu, Zn, and Fe).
Preparation of Model Solutions to Investigate the Effect of the Na Matrix in Blood Serums
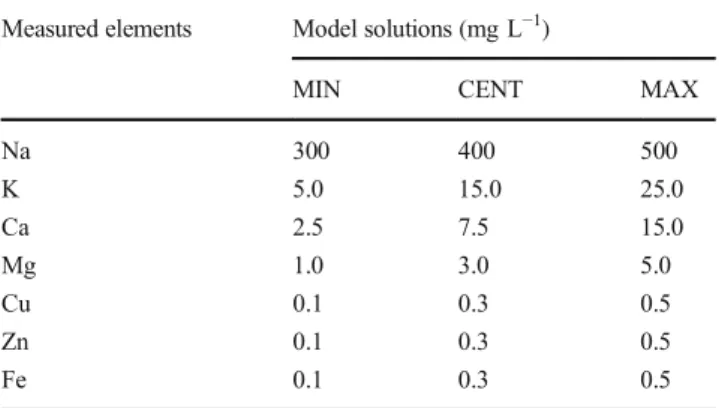
To study the effect of Na present on the quantitative determination of Mg, K, Ca, Cu, Zn, and Fe in blood serum samples by MP-AES, a factorial experiment was designed with model solutions. We chose a minimum (MIN), a center (CENT), and a maximum (MAX) con- centration of the elements, in accordance with the ex- pected concentrations in the prepared and diluted serum solutions. Tables 1 and 2 summarize the concentration and composition of the model solutions used for the factorial plan.
The concentration of the measured elements (Mg, K, Ca, Cu, Zn, Fe) were set in the prepared solutions by u s i n g c o m m e r c i a l l y a v a i l a b l e I C P s t a n d a r d s o f 1000 mg L−1 (Merck, Germany) while the concentration of the Na matrix was set by solutions prepared from reagent-grade solid NaCl (VWR International, USA).
The model solutions were prepared in duplicate and were analyzed for Na, as well as for the microelements and macroelements.
In the second series of experiments, the effect of in- creasing Na concentration was studied on the quantitative determination of the measured elements (Mg, K, Ca, Cu, Zn, and Fe). The model solutions contained the Na ma- trix in increasing concentration, while the measured ele- ments were present in the center concentration (CENT,
Table 1). The compositions of the model solutions are summarized in Table 3. The whole series of model sam- ples were prepared in triplicate.
Table 1 The concentration of the Na matrix and of the measured elements applied in the model solutions of the factorial plan (notations:
measured elements—K, Ca, Mg, Cu, Zn, and Fe; MIN—minimum, CENT—centrum, and MAX—maximum)
Measured elements Model solutions (mg L−1)
MIN CENT MAX
Na 300 400 500
K 5.0 15.0 25.0
Ca 2.5 7.5 15.0
Mg 1.0 3.0 5.0
Cu 0.1 0.3 0.5
Zn 0.1 0.3 0.5
Fe 0.1 0.3 0.5
Table 2 The composition of the model solutions applied in the factorial plan (notations: measured elements—K, Ca, Mg, Cu, Zn and Fe; MIN— minimum, CENT—centrum, and MAX—maximum as indicated in Table1)
Model samples Measured elements Na matrix
1 MIN MIN
2 MIN MAX
3 MAX MIN
4 MAX MAX
5 CENT CENT
Table 3 The compositions of the model solutions to investigate the effect of increasing level of Na
Model samples
Na matrix (mg L−1)
measured elements
Concentration (mg L−1)
1 300 Ca 7.5
2 300 K 15.0
3 300 Mg 3.0
4 300 Cu 0.3
5 300 Zn 0.3
6 300 Fe 0.3
7 350 Ca 7.5
8 350 K 15.0
9 350 Mg 3.0
10 350 Cu 0.3
11 350 Zn 0.3
12 350 Fe 0.3
13 400 Ca 7.5
14 400 K 15.0
15 400 Mg 3.0
16 400 Cu 0.3
17 400 Zn 0.3
18 400 Fe 0.3
19 450 Ca 7.5
20 450 K 15.0
21 450 Mg 3.0
22 450 Cu 0.3
23 450 Zn 0.3
24 450 Fe 0.3
25 500 Ca 7.5
26 500 K 15.0
27 500 Mg 3.0
28 500 Cu 0.3
29 500 Zn 0.3
30 500 Fe 0.3
Elemental Analysis
The concentrations of the measured elements (Ca, K, Mg, Cu, Zn, and Fe) were determined by the MP-AES method (MP-AES 4200, Agilent Technologies). A five- point calibration was applied (multielement standard so- lution of ICP IV, Merck, Germany), and the solutions were analyzed in a completely randomized sequence.
The concentration of each element was determined by measuring the intensities at three or more wavelengths as the average of five independent measurements. The most appropriate analytical lines were selected based on the results of the optimizing method. The emission wavelengths used were those where the best signal/
background ratio was obtained and the spectral interfer- ences were the lowest. The purity of applied chemicals and various parts of the equipment was verified by blank samples.
Statistical Analysis
In the present study, multivariate statistical methods were used for the optimization of the measuring
parameters [39–43]. The robustness of the inductively coupled plasma was evaluated according to the Doehlert protocol, as described by Guimarães-Silva et al. for ICP-OES [25]. In our case, the operating con- ditions were considered as factors, although the software of the MP-AES instrument allows to adjust only two parameters for the user: the read time and the nebulizing pressure.
The first model experiment of the Na matrix effect was a 2n full-factorial design which is an efficient math- ematical approach to optimize responses [44–46]. The two applied factors were the concentration of the Na matrix and the measured elements, while their levels as factorial points were abbreviated by MIN and MAX, as well as an additional CENT was applied for the centrum concentration (as indicated in Table 1.).
The graphical evaluation of the responses is calculated and created by Statgraphics Centurion XVII software.
To study the effects and interactions, ANOVA (analysis of variance) test was applied using the SPSS IBM 22 for Windows software package. Limit of detection values for the measured elements were calculated based on the ANOVA results.
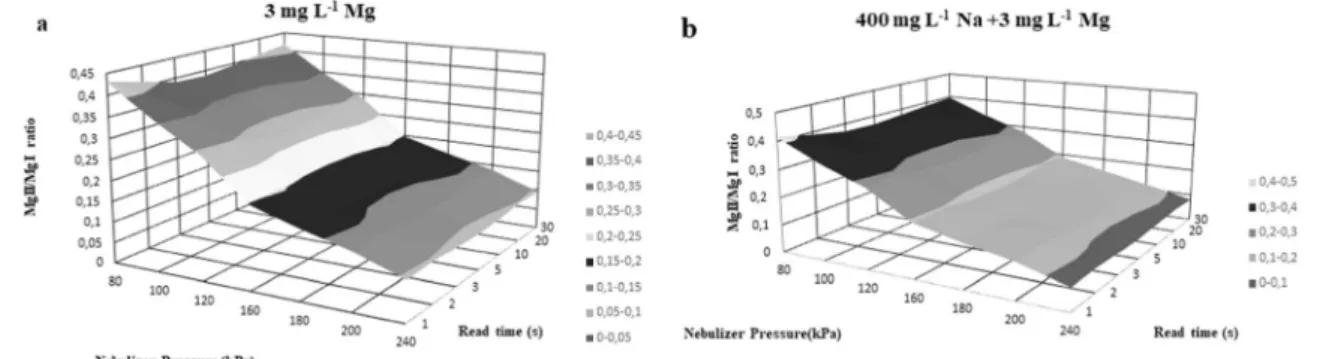
Fig. 1 The effect of read time and nebulizer pressure on the ratio of MgI and MgII lines (notations:asolutions containing 3 mg L−1Mg and no Na matrix, bsolutions containing 3 mg L−1Mg and 400 mg L−1Na matrix)
Fig. 2 MgII/MgI intensity ratio plotted against the nebulizer pressure (notations:asolutions containing 3 mg L−1Mg and no Na matrix,bsolutions containing 3 mg L−1Mg and 400 mg L−1Na matrix)
Results and Discussion Optimization of the Operating
Conditions
—Robustness and Threshold Concentrations
The term robustness refers to the capacity of the plasma source to offset the changes originating from environmental factors, operating conditions, or matrix effects without causing a sig- nificant error in the measurement result. The robustness is reached for ICP-OES when the ratio of the signals gained at the ionic and atomic lines of Mg are higher than 6 [25].
Using multivariate optimization design, the analytical performance of a technique can be improved by selecting the most relevant variables affecting the measurement process [47].
The adjustable operating parameters of the MP-AES were considered as factors (read time and nebulizing pressure), and Fig.1 illustrates the effect of main factors on the MgII/MgI line intensity ratio (response). The diagram shows the results through the example of a series of model samples containing only Mg (analyte) with and without Na (matrix).
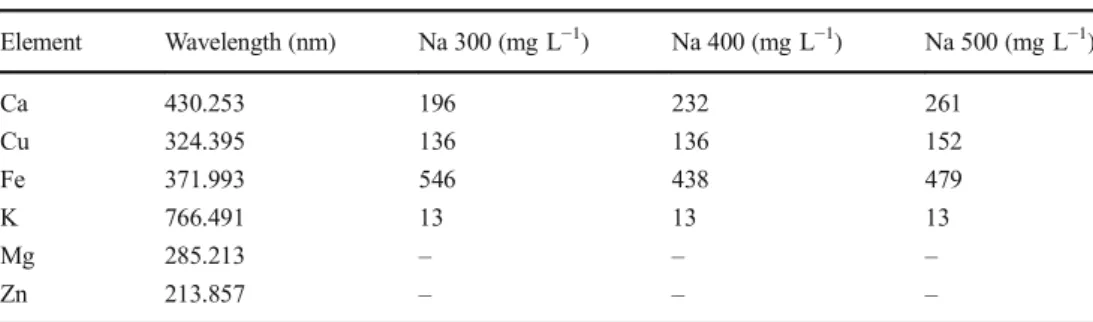
Since it was already described that in the wavelength re- gion of 280 and 285 nm the response is increasing relatively Table 4 Threshold
concentrations (mg L−1) of the interfering Na calculated for the measured elements
Element Wavelength (nm) Na 300 (mg L−1) Na 400 (mg L−1) Na 500 (mg L−1)
Ca 430.253 196 232 261
Cu 324.395 136 136 152
Fe 371.993 546 438 479
K 766.491 13 13 13
Mg 285.213 – – –
Zn 213.857 – – –
Fig. 3 The horizontal and three-dimensional plot of interaction and surface responses gained for Fe in the full-factorial experimental design
slow, a factor of 1.15 must be used to multiply with the inten- sity ratio data of ionic to atomic lines for Mg [48,49]. The results of the present study are demonstrated after the correction.
As expected based on previously published results, the ra- tio of the Mg ion to atomic line intensities varies between 0.5 and 1.0, while for ICP-OES the values are in the range of 8– 14. The reason for this difference is explained by the lower Fig. 4 The graphic evaluation of the surface responses gained in the full-factorial experimental design
temperature and electron densities present in the microwave plasma [37,49].
It is clearly shown that the value of read time has no influ- ence on the gained intensity data and the calculated ratios.
However, a higher ratio was achieved with decreasing nebulizer pressure which shows agreement with Chalyavi et al. [49]. This tendency is demonstrated in Fig.2also through the example of one sample solution with and without the Na matrix.
The threshold value determined for a selected analytical line is the concentration of the interfering element above which it statistically can cause a significant effect on the measurement results. The threshold values gained are indicated in Table4 given for the selected wavelengths measured in monoelement solutions with increasing Na matrix concentration (MIN, CENT, MAX). In the model solutions, the measured elements were present in the concentration range that can be expected in a digested and 10 times diluted serum sample.
The results confirm that only the 210.857 nm line of zinc and 285.213 nm line of magnesium are free of the interference by the Na matrix in the concentrations expected in the pre- treated blood serum samples. In the other cases, a statistically distinguishable signal was generated by the matrix.
The Interactive Effect of the Na Matrix
The elemental analysis of human blood is a difficult task due to its relatively complex sample matrix and the low concentration of the analyte to be measured. The microwave plasma technique
may prove to be a suitable alternative of ICP-OES for routine blood analysis if by lower temperature MIP can handle the re- sidual matrix components in the acid-digested human serum.
In the first series of model experiments, a full-factorial design was used to test the effect of the Na matrix by MP- AES in a concentration range that is expected in a human blood serum sample after digestion and dilution. Analytical techniques such as ICP-OES can generate a number of re- sponses [47] which is true for the MP-OES as well. From these, the analytical signals corresponding to each particular element (intensity values) were considered.
Factorial designs are used to investigate how the variables and/or interactions between them influence the gained re- sponses, and even the magnitude of the possible effects can be estimated. In our case, the number of the studied variables is quite small and hence the full-factorial design could easily be applied. It is one of the most used screener methods to study the significance of experimental variables in ICP-OES [47,50].
Figure3demonstrates the statistical results through the ex- ample of Fe. The interaction effect is shown in Fig.3a, while the responses are indicated in the three-dimensional Fig.3b.
It was found that the Na concentration present in a blood serum sample after acid digestion and 10 times dilution affect- ed the intensity values of the measured elements. For Ca, Cu, and Fe, a statistically significant effect was observed, while for Zn, Mg, and K, an interaction effect was also found. The graphic evaluation of the surface responses for the other ele- ments is indicated in Fig.4.
Fig. 5 The intensities of macroelements as a function of Na concentration (notations:acalcium,bmagnesium,cpotassium)
It is long known that the presence of EIEs in the ICP exci- tation source under certain conditions—despite the higher tem- perature and electron number density in the Ar plasma—may result in a shift of the ionization equilibrium state affecting the gained intensity values [51–53]. Usually, the phenomenon is present at a given observation height. The effect was observed previously in N2-MIP systems but reported to be rather similar- ly to the AAS, and the observation height of 12 mm [12] is suggested since the best MgII 280.270 nm/MgI 285.213 nm ratio was found there. In the commercially available MP-AES instrument applied in the present study, the plasma is viewed axially with a vertical torch position; therefore, the observation height is a fixed value. Zhang et al. explained the effect of high Na concentration by reducing the excitation temperature and thus increasing the electron number density which results in the shift of the ionization equilibrium. According to the results of the statistical plots, a stronger effect of Na is observed on the quantitative determination of Zn, Mg, and K.
The Effect of Increasing Na Concentration
Interferences are even higher when the plasma is viewed axially [51]. The MP-AES applied in our experiments is equipped with a vertically positioned quartz torch which is axially observed;
thus, the ionization effect must be considered when alkali metals are coexisting in the sample solution. According to our
results, the Na concentration naturally present in human blood serum samples affects the intensity values of the measured ele- ments. To determine the effect numerically, we further investi- gated the measurement data against an increasing Na concen- tration. As expected, based on the literature observations in ICP-OES analysis, the intensities increased in the case of all the six studied macroelements and microelements by increasing the concentration of Na. As indicated through the example of macroelements in Fig. 5, a slight yet statistically significant increase is observed in the MP-AES signals of Ca, K, and Mg when the concentration of the Na matrix was applied in a con- tinuously elevated level in the model solutions.
The EIEs can shift the ionization equilibrium and enhance the atomic line emission in AAS measurements. According to the literature data, EIEs causes an enhancement effect at atom- ic lines and a suppression effect at ionic lines in ICP-OES. In the lower-temperature nitrogen plasma of the MP-AES meth- od, much more atomic lines are available than ionic ones compared to the ICP-OES. For example, out of the 20 avail- able lines of Ca, only three are ionic and exactly the same is true for Mg. For Cu, there are 20 lines present to choose from but only two are ionic, while from the 20 lines of Fe only one.
Thus, our measurements were carried out at the atomic lines of Ca (430.253 nm), K (766.491 nm), Mg (285.219 nm), Cu (324.754 nm), Zn (213,857 nm), and Fe (371.993 nm), respec- tively. It was proved that an enhancement of the measured intensities must be considered when digested blood serums are analyzed by MP-AES, similarly to ICP measurements.
The observed effects were further evaluated by ANOVA.
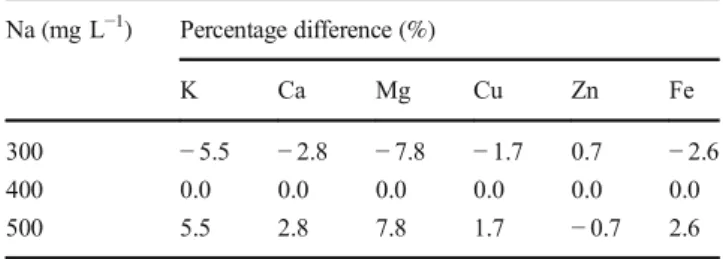
Based on the average expected Na concentration in the digested and diluted serum samples (400 mg L−1), the percent- age differences of the shift in the intensity values were calcu- lated, as indicated in Table5.
The highest observed difference from the central concen- tration expected when the Na matrix content is 400 mg L−1in the samples occurred in the case of Mg—the intensity results gained for Mg were shifted with −7.8% when the matrix Table 5 The differences of the signal intensities compared to the
intensities at the center concentration of Na (400 mg L−1) Na (mg L−1) Percentage difference (%)
K Ca Mg Cu Zn Fe
300 −5.5 −2.8 −7.8 −1.7 0.7 −2.6
400 0.0 0.0 0.0 0.0 0.0 0.0
500 5.5 2.8 7.8 1.7 −0.7 2.6
Fig. 6 The intensity values (cps) of the sample solutions containing K (signal) and those not containing K (background) plotted against the increasing Na concentration (mg L−1)
concentration of Na was in the minimum (300 mg L−1) and + 7.8% when it was in the maximum (500 mg L−1) of the range naturally present in the human serum after the 10 times dilu- tion compared to the central value (400 mg L−1). The statisti- cal analysis proved the intensity shift and therefore the matrix effect of Na on the intensity results of the measured elements from human blood. However, after the error is quantified nu- merically, one can conclude that the relative difference is quite small (< 10%).
It is important to note that the effects of nitric acid, another matrix component left in the serum samples after dilution, were not considered in this paper. A high concentration of nitric acid is reported to affect the microwave plasma in a more simple way compared to the EIEs and very similarly to the ICP measurements [12]. The MP-AES instrument operates at a fixed 1-kW microwave power to maintain the robustness of the plasma source; thus, the power could not be varied to reduce the matrix effect of the acid used for the digestion. This may not be a real handicap because Zhang et al. reported that the suppression phenomenon caused by nitric acid was inde- pendent of the microwave power between 0.8 and 1.3 kW in their N2-MIP system [12].
The Limit of Detection
During the measurement of the second matrix effect study from every sample solution, the intensity of all six elements were registered (K, Ca, Mg, Cu, Zn, and Fe)—even those elements were determined which were not present in the mod- el solutions. Thus, a huge amount of data were available from which the background of the measurements was monitored and it proved to be constant during the analysis. The registered background is indicated in Fig.6through the example of K where the intensity values of K are plotted against the increas- ing Na matrix concentration present in the model solutions.
The background did not differ statistically during the analysis of the other five elements.
The amount of registered background intensity values pro- vided the opportunity to calculate the limit of detection results from the average and standard deviation of background inten- sity data which are indicated for each element in Table6.
Conclusion
The aim of this paper is to describe the application of the MP- AES instrument for the cost-effective elemental analysis of digested human blood serum samples. The potential matrix effect is investigated caused by the relatively high concentration of the easily ionized element, Na, naturally present in the serum sample.
According to a series of model experiments, the suppressing effect of Na in the expected concentration range in blood serum on the intensity values of the measured elements is statistically proved. The matrix effect was expressed in percentage difference showing the magnitude of the potential errors caused by the lower or higher level of Na in the naturally occurring concentra- tion range, and it was found that the error of measurement for the Cu, Zn, and Fe intensities is under 3%, while for the Ca, Mg, and K intensities it is under 8%.
Due to the slight differences observed in the measurement data caused by the shift and the low enough limit of detection (LOD) values, MP-AES can be considered as a coeffective alternative to ICP-OES in routine blood analysis, similarly as proven in the case of other applications [54]. Matrix matching the calibration solution series by the interfering ele- ment may lower the signal shift.
Acknowledgements Open access funding provided by University of Debrecen (DE). We would like to highly acknowledge Agilent Technologies (Novo Labs Ltd.) for providing the MP-AES 4200 instru- ment for the elemental analysis. The authors would like to highly ac- knowledge to Dr. Mihály Braun for his valuable suggestions in the sta- tistical analysis.
Funding Information This research was supported by the European Union and the State of Hungary, cofinanced by the European Social Fund in the framework of TÁMOP 4.2.4. A/2-11-1-2012-0001 BNational Excellence Program.^Csilla Noémi Tóth was supported by the European Union and the State of Hungary, cofinanced by the European Social Fund in the framework of TÁMOP 4.2.4. A/2-11-1- 2012-0001BNational Excellence Program.^The research was supported by the EU and cofinanced by the European Regional Development Fund under the project GINOP-2.3.2-15-2016-00008.
Compliance with Ethical Standards
Conflict of Interest The authors declare that they have no conflict of interest.
Open Access This article is distributed under the terms of the Creative C o m m o n s A t t r i b u t i o n 4 . 0 I n t e r n a t i o n a l L i c e n s e ( h t t p : / / creativecommons.org/licenses/by/4.0/), which permits unrestricted use, distribution, and reproduction in any medium, provided you give appro- priate credit to the original author(s) and the source, provide a link to the Creative Commons license, and indicate if changes were made.
References
1. Cornelis R (2003) Handbook of elemental speciation: techniques and methodology. Wiley, Chichester
Table 6 The wavelengths and calculated limit of detection (LOD) values of the MP-AES method
Element Wavelength (nm) LOD (mg L−1)
K 766.491 0.005
Ca 430.253 0.028
Mg 285.213 0.010
Zn 213.857 0.004
Cu 324.754 0.002
Fe 371.993 0.011
2. Feist B, Mikula B (2014) Preconcentration of heavy metals on activated carbon and their determination in fruits by inductively coupled plasma optical emission spectrometry. Food Chem 147:
302–306.https://doi.org/10.1016/j.foodchem.2013.10.002 3. Deng B, Xu X, Xiao Y, Zhu P, Wang Y (2015) Understanding the
effects of potassium ferricyanide on lead hydride formation in tetrahydroborate system and its application for determination of lead in milk using hydride generation inductively coupled plasma optical emission spectrometry. Anal Chim Acta 853:179–186.
https://doi.org/10.1016/j.aca.2014.10.034
4. Hardaway CJ, Sneddon J, Sneddon EJ, Kiran B, Lambert BJ, McCray TC, Bowser DQ, Douvris C (2016) Study of selected metal concentrations in sediments by inductively coupled plasma-optical emission spectrometry from a metropolitan and more pristine bayou in Southwest Louisiana, United States. Microchem J 127:213–219.
https://doi.org/10.1016/j.microc.2016.02.016
5. Patole SP, Simões F, Yapici TF, Warsama BH, Anjum DH, Costa PMFJ (2016) An evaluation of microwave-assisted fusion and microwave-assisted acid digestion methods for determining ele- mental impurities in carbon nanostructures using inductively coupled plasma optical emission spectrometry. Talanta 148:94– 100.https://doi.org/10.1016/j.talanta.2015.10.053
6. Ham NS, Walsh A (1958) Microwave-powered Raman sources.
Spectrochim Acta 12:88–93. https://doi.org/10.1016/0371- 1951(58)80130-7
7. Broekaert JAC, Engel U (2000) Microwave-induced plasma sys- tems in atomic spectroscopy. In: Meyers RA (ed) Encyclopedia of Analytical Chemistry. Wiley, Chichester
8. Broekaert JAC, Siemens V (2004) Recent trends in atomic spec- trometry with microwave-induced plasmas. Spectrochim Acta B At Spectrosc 59:1823–1839.https://doi.org/10.1016/j.sab.2004.08.
006
9. Greenfield S, Mcgeachin HM, Smith PB (1975) Plasma emission sources in analytical spectroscopy—I. Talanta 22:III–IIV.https://
doi.org/10.1016/0039-9140(75)80134-2
10. Abdallah MH, Coulombe S, Mermet JM, Hubert J (1982) An as- sessment of an atmospheric pressure helium microwave plasma produced by a surfatron as an excitation source in atomic emission spectroscopy. Spectrochim Acta B At Spectrosc 37:583–592.
https://doi.org/10.1016/0584-8547(82)80044-X
11. Jin Q, Zhu C, Border MW, Hieftje GM (1991) A microwave plasma torch assembly for atomic emission spectrometry. Spectrochim Acta B At Spectrosc 46:417–430.https://doi.org/10.1016/0584- 8547(91)80039-6
12. Zhang Z, Wagatsuma K (2002) Matrix effects of easily ionizable elements and nitric acid in high-power microwave-induced nitrogen plasma atomic emission spectrometry. Spectrochim Acta B At Spectrosc 57:1247–1257.https://doi.org/10.1016/S0584-8547(02) 00049-6
13. Broida HP, Chapman MW (1958) Stable nitrogen isotope analysis by optical spectroscopy. Anal Chem 30:2049–2055.https://doi.org/
10.1021/ac60144a057
14. Beauchemin D, Yves Le Blanc JC, Peters GR, Persaud AT (1994) Plasma emission spectrometry. Anal Chem 66:462–499.https://doi.
org/10.1021/ac00084a018
15. Okamoto Y (1999) High-power microwave-induced helium plasma at atmospheric pressure for determination of halogens in aqueous solution. Jpn J Appl Phys 38:L338–L341.https://doi.org/10.1143/
JJAP.38.L338
16. Nakahara T, Li Y (1998) gDetermination of trace amounts of anti- mony in pure copper by high-power nitrogen microwave-induced plasma atomic emission spectrometry with hydride generation. J Anal At Spectrom 13:401–405.https://doi.org/10.1039/a707115i 17. Nakahara T, Li Y, Takeuchi H, Futamura M (1999) Sensitive deter-
mination of arsenic and selenium in steels by high power nitrogen microwave induced plasma atomic emission spectrometry coupled
with hydride generation technique. Tetsu–Hagane 85:97–101.
https://doi.org/10.2355/tetsutohagane1955.85.2_97
18. Hammer MR (2008) A magnetically excited microwave plasma source for atomic emission spectroscopy with performance ap- proaching that of the inductively coupled plasma. Spectrochim Acta B At Spectrosc 63:456–464.https://doi.org/10.1016/j.sab.
2007.12.007
19. Broekaert JAC, Hywel Evans E (2003) Atomic spectroscopy. In:
Wiley-VCH Verlag GmbH & Co. KGaA (ed) Ullmann’s Encyclopedia of Industrial Chemistry. Wiley-VCH Verlag GmbH
& Co. KGaA, Weinheim
20. Yang C, Zhuang Z, Tu Y, Yang P, Wang X (1998) Thermospray nebulizer as sample introduction technique for microwave plasma torch atomic emission spectrometry. Spectrochim Acta B At Spectrosc 53:1427–1435.https://doi.org/10.1016/S0584-8547(98) 00130-X
21. Gok F, Ekin S, Dogan M (2016) Evaluation of trace element and mineral status and related to levels of amino acid in children with phenylketonuria. Environ Toxicol Pharmacol 45:302–308.https://
doi.org/10.1016/j.etap.2016.06.014
22. Vural H, Uzun K, Uz E, Koçyigit A, Çigli A, Akyol Ö (2000) Concentrations of copper, zinc and various elements in serum of patients with bronchial asthma. J Trace Elem Med Biol 14:88–91.
https://doi.org/10.1016/S0946-672X(00)80036-X
23. Peters TL, Beard JD, Umbach DM, Allen K, Keller J, Mariosa D, Sandler DP, Schmidt S, Fang F, Ye W, Kamel F (2016) Blood levels of trace metals and amyotrophic lateral sclerosis. NeuroToxicology 54:119–126.https://doi.org/10.1016/j.neuro.2016.03.022 24. Dubuisson C, Poussel E, Todoli JL, Mermet JM (1998) Effect of
sodium during the aerosol transport and filtering in inductively coupled plasma atomic emission spectrometry. Spectrochim Acta B At Spectrosc 53:593–600.https://doi.org/10.1016/S0584- 8547(98)00084-6
25. Guimarães-Silva AK, de LJC, Froes RES et al (2012) Evaluation of signal-to-background and Mg II/Mg I ratios as response for the optimization of rare earth elements determination by inductively coupled plasma optical emission spectrometry. J Braz Chem Soc 23:753–762.https://doi.org/10.1590/S0103-50532012000400022 26. Romero X, Poussel E, Mermet JM (1997) The effect of sodium on
analyte ionic line intensities in inductively coupled plasma atomic emission spectrometry: influence of the operating conditions.
Spectrochim Acta B At Spectrosc 52:495–502.https://doi.org/10.
1016/S0584-8547(96)01601-1
27. Mermet J (1998) Revisitation of the matrix effects in inductively coupled plasma atomic emission spectrometry: the key role of the spray chamber. J Anal At Spectrom 13:419–422.https://doi.org/10.
1039/a707197c
28. Urh JJ, Carnahan JW (1986) Analytical figures of merit and interelement effects with air and nitrogen microwave-induced plasmas. Appl Spectrosc 40:877–883.https://doi.org/10.1366/
0003702864508250
29. Lech T (2013) Application of ICP-OES to the determination of barium in blood and urine in clinical and forensic analysis. J Anal Toxicol 37:222–226.https://doi.org/10.1093/jat/bkt015
30. Harrington JM, Young DJ, Essader AS, Sumner SJ, Levine KE (2014) Analysis of human serum and whole blood for mineral con- tent by ICP-MS and ICP-OES: development of a mineralomics method. Biol Trace Elem Res 160:132–142.https://doi.org/10.
1007/s12011-014-0033-5
31. Sahebari M, Abrishami-Moghaddam M, Moezzi A, Ghayour- Mobarhan M, Mirfeizi Z, Esmaily H, Ferns G (2014) Association between serum trace element concentrations and the disease activ- ity of systemic lupus erythematosus. Lupus 23:793–801.https://
doi.org/10.1177/0961203314530792
32. Sahebari M, Ayati R, Mirzaei H, Sahebkar A, Hejazi S, Saghafi M, Saadati N, Ferns GA, Ghayour-Mobarhan M (2016) Serum trace
element concentrations in rheumatoid arthritis. Biol Trace Elem Res 171:237–245.https://doi.org/10.1007/s12011-015-0501-6 33. Yilmaz A, Sari RA, Gundogdu M, Kose N, Dag E (2005) Trace
elements and some extracellular antioxidant proteins levels in se- rum of patients with systemic lupus erythematosus. Clin Rheumatol 24:331–335.https://doi.org/10.1007/s10067-004-1028-y 34. Tóth CN, Baranyai E, CsípőI, Tarr T, Zeher M, Posta J, Fábián I
(2017) Elemental analysis of whole and protein separated blood serum of patients with systemic lupus erythematosus and Sjögren’s syndrome. Biol Trace Elem Res 179:14–22.https://doi.
org/10.1007/s12011-017-0945-y
35. Maduray K, Moodley J, Soobramoney C, Moodley R, Naicker T (2017) Elemental analysis of serum and hair from pre-eclamptic South African women. J Trace Elem Med Biol 43:180–186.
https://doi.org/10.1016/j.jtemb.2017.03.004
36. Xu C, Ding Y, Leung HW, Tong BMK, Shin RYC, Lee TK (2017) Development of high accuracy methods for the certification of cal- cium, iron, magnesium and potassium in human serum. J Trace Elem Med Biol 40:61–66.https://doi.org/10.1016/j.jtemb.2016.
12.007
37. Mermet JM (1991) Use of magnesium as a test element for induc- tively coupled plasma atomic emission spectrometry diagnostics.
Anal Chim Acta 250:85–94. https://doi.org/10.1016/0003- 2670(91)85064-Y
38. Varbanova E, Stefanova V (2015) A comparative study of induc- tively coupled plasma optical emission spectrometry and micro- wave plasma atomic emission spectrometry for the direct determi- nation of lanthanides in water and environmental samples. Ecol Saf 9:362–374
39. Santos JS, Teixeira LSG, Araújo RGO, Fernandes AP, Korn MGA, Ferreira SLC (2011) Optimization of the operating conditions using factorial designs for determination of uranium by inductively coupled plasma optical emission spectrometry. Microchem J 97:
113–117.https://doi.org/10.1016/j.microc.2010.08.002
40. Ferreira SLC, Korn M das GA, Ferreira HS et al (2007) Application of multivariate techniques in optimization of spectroanalytical methods. Appl Spectrosc Rev 42:475–491.https://doi.org/10.
1080/05704920701551506
41. Novotny I, Farinas JC, Jia-liang W, Poussel E, Mermet JM (1996) Effect of power and carrier gas flow rate on the tolerance to water loading in inductively coupled plasma atomic emission spectrome- try. Spectrochim Acta B At Spectrosc 51:1517–1526.https://doi.
org/10.1016/0584-8547(96)01522-4
42. Brenner I, Zander A (2000) Axially and radially viewed inductively coupled plasmas—a critical review. Spectrochim Acta B At Spectrosc 55:1195–1240.https://doi.org/10.1016/S0584-8547(00) 00243-3
43. Silva FV, Trevizan LC, Silva CS et al (2002) Evaluation of induc- tively coupled plasma optical emission spectrometers with axially and radially viewed configurations. Spectrochim Acta B At
Spectrosc 57:1905–1913.https://doi.org/10.1016/S0584-8547(02) 00176-3
44. Regti A, Laamari MR, Stiriba S-E, El Haddad M (2017) Use of response factorial design for process optimization of basic dye ad- sorption onto activated carbon derived from Persea species.
Microchem J 130:129–136.https://doi.org/10.1016/j.microc.2016.
08.012
45. Ma F-X, Kim JH, Kim SB, Seo YG, Chang YK, Hong SK, Kim CJ (2008) Medium optimization for enhanced production of Rifamycin B by Amycolatopsis mediterranei S699: combining a full factorial design and a statistical approach. Process Biochem 43:954–960.https://doi.org/10.1016/j.procbio.2008.04.021 46. Onsekizoglu P, Savas Bahceci K, Acar J (2010) The use of factorial
design for modeling membrane distillation. J Membr Sci 349:225– 230.https://doi.org/10.1016/j.memsci.2009.11.049
47. Novaes CG, Bezerra MA, da Silva EGP, Santos AMP, Romão ILS, Santos Neto JH (2016) A review of multivariate designs applied to the optimization of methods based on inductively coupled plasma optical emission spectrometry (ICP OES). Microchem J 128:331– 346.https://doi.org/10.1016/j.microc.2016.05.015
48. Goncalves DA, McSweeney T, Donati GL (2016) Characteristics of a resonant iris microwave-induced nitrogen plasma. J Anal At Spectrom 31:1097–1104.https://doi.org/10.1039/C6JA00066E 49. Chalyavi N, Doidge PS, Morrison RJS, Partridge GB (2017)
Fundamental studies of an atmospheric-pressure microwave plas- ma sustained in nitrogen for atomic emission spectrometry. J Anal At Spectrom 32:1988–2002.https://doi.org/10.1039/C7JA00159B 50. Teófilo RF, Ferreira MMC (2006) Quimiometria II: planilhas eletrônicas para cálculos de planejamentos experimentais, um tuto- rial. Quím Nova 29:338–350.https://doi.org/10.1590/S0100- 40422006000200026
51. Blades MW, Horlick G (1981) Interference from easily ionizable element matrices in inductively coupled plasma emission spectrometry—a spatial study. Spectrochim Acta B At Spectrosc 36:881–900.https://doi.org/10.1016/0584-8547(81)80080-8 52. Johnson GW, Taylor HE, Skogerboe RK (1980) Characterization of
an interelement enhancement effect in a dc plasma atomic emission spectrometry system. Appl Spectrosc 34:19–24.https://doi.org/10.
1366/0003702804730880
53. Skogerboe RK, Olson KW (1978) Aerosols, aerodynamics, and atomic analysis. Appl Spectrosc 32:181–187.https://doi.org/10.
1366/000370278774331675
54. Li W, Simmons P, Shrader D, Herrman TJ, Dai SY (2013) Microwave plasma-atomic emission spectroscopy as a tool for the determination of copper, iron, manganese and zinc in animal feed and fertilizer. Talanta 112:43–48.https://doi.org/10.1016/j.talanta.
2013.03.029
Publisher’s Note Springer Nature remains neutral with regard to juris- dictional claims in published maps and institutional affiliations.