Physiology International, Volume 106 (2), pp. 180–193 (2019) DOI: 10.1556/2060.106.2019.15
Blood fl ow restriction augments the skeletal muscle response during very low-load resistance exercise
to volitional failure
MB Jessee1, SL Buckner2, KT Mattocks3, SJ Dankel4, JG Mouser5, ZW Bell4, T Abe4, JP Loenneke4
1School of Kinesiology and Nutrition, The University of Southern Mississippi, Hattiesburg, MS, USA
2Exercise Science Program, University of South Florida, Tampa, FL, USA
3Department of Exercise Science, Lindenwood University-Belleville, Belleville, IL, USA
4Kevser Ermin Applied Physiology Laboratory, Department of Health, Exercise Science, and Recreation Management, The University of Mississippi, University, MS, USA
5Department of Kinesiology and Health Promotion, Troy University, Troy, AL, USA
Received: August 14, 2018 Accepted: April 29, 2019
The purpose of this study was to compare the acute muscular response with resistance exercise between the following conditions [labeled (% one-repetition maximum/% arterial occlusion pressure)]: high-load (70/0), very low-load (15/0), very low-load with moderate (15/40), and high (15/80) bloodflow restriction pressures. Twenty-three participants completed four sets of unilateral knee extension to failure (up to 90 repetitions) with each condition, one condition per leg, each day. Muscle thickness and maximal voluntary contraction (MVC) were measured before (Pre), immediately after (Post-0), and 15 min after (Post-15) exercise and electromyography (EMG) amplitude during exercise. Pre to Post-0 muscle thickness changes in cm [95% CI] were greater with 15/40 [0.57 (0.41, 0.73)] and 15/80 [0.49 (0.35, 0.62)] compared to 70/0 [0.33 (0.25, 0.40)]. Pre to Post-0 MVC changes in Nm [95% CI] were higher with 15/40 [−127.0 (−162.1,−91.9)] and 15/80 [−133.6 (−162.8,−104.4)] compared to 70/0 [−48.4 (−70.1,
−26.6)] and 15/0 [−98.4 (−121.9,−74.9)], which were also different. Over thefirst three repetitions, EMG increased across sets, whereas in the last three repetitions it did not. EMG was also different between conditions and was generally greater during 70/0. Repetitions decreased across sets reaching the lowest for 70/0, and for very low loads decreased with increased pressure. In trained participants exercising to failure, lower load and the application of restriction pressure augment changes in muscle thickness and torque. The EMG amplitude was augmented by load.
Training studies should compare these conditions, as the results herein suggest some muscular adaptations may differ.
Keywords:occlusion, electromyography, muscle thickness, fatigue, voluntary contraction
Introduction
The traditional recommendation to increase muscle mass and function is moderate- or high-load [i.e., 60%–80% one-repetition maximum (1RM)] resistance training (1). In addition, resistance training loads as low as 30% 1RM can elicit similar increases in muscle mass and function as high loads as long as they are taken to volitional failure (25). Thus, those who would like to avoid high mechanical loads may opt to train with relatively low loads
Corresponding author: Jeremy P. Loenneke, PhD
Kevser Ermin Applied Physiology Laboratory, Department of Health, Exercise Science, and Recreation Management, The University of Mississippi
231 Turner Center, University, MS 38677, USA
Phone: +1 662 915 5567; Fax: +1 662 915 5525; E-mail:jploenne@olemiss.edu
without compromising muscular adaptation. In case of an injury or illness, however, individuals may be limited to exercise with extremely low loads only (i.e., <20 – 30%
1RM). When comparing two training programs, i.e., one with an extremely low load of 15.5% 1RM and the other with a high load of 70% 1RM, Holm et al. (16) found that 15.5%
1RM was less effective for increasing muscle size and strength. This study was limited by the fact that the low-load condition was work matched to the high-load condition and thus likely did not exercise to failure. However, it remains unknown whether 15% 1RM is capable of inducing volitional failure and, if it does, whether it can stimulate an acute muscular response indicative of a hypertrophic stimulus similar to that of high-load training.
Some evidence suggests that there may be a point in which the relative load being lifted may generate an intramuscular pressure too low to induce failure (17). Applying bloodflow restriction during exercise with a very low load could augment the hemodynamics within the muscle, either enabling or expediting the ability to reach volitional failure by interrupting blood flow into and out of the limb (13). Therefore, the purpose of this study was to determine whether using a very low load for resistance exercise could induce volitional failure and to compare the acute muscular response [exercise induced changes in muscle thickness, maximal voluntary contraction (MVC), and surface electromyography (EMG) amplitude] between high- load and very low-load resistance exercise in the lower body. As these acute measures have been previously associated with the hypertrophic response to training (34), the results would give some insight into the expected adaptations to a training program using these protocols. In addition, we sought to determine whether the application of blood flow restriction would augment this response. Since some evidence suggests that, at lower loads, a greater relative restriction pressure may be needed (22), we also compared the addition of moderate and high pressures. We hypothesized that the acute muscular response with very low-load exercise would be augmented by increasing the restriction pressure and that this would produce a change similar to that of high-load resistance exercise.
Materials and Methods Participants
Twelve males and 11 females volunteered to participate in this study. All were between the ages of 18 and 35 years and had been resistance training at least twice per week for the previous 6 months. Participants were excluded from participation if they regularly used tobacco within the previous 6 months, had a body mass index≥30 kg/m2, an orthopedic injury preventing exercise, or took medication for hypertension. Participants were also excluded if they self-reported meeting at least two of the following risk factors for thromboembolism: taking birth control pills; diagnosed with Crohn’s disease; past fracture of the hip, pelvis, or femur; major surgery within the past 6 months; varicose veins; family or personal history of deep vein thrombosis; and family or personal history of pulmonary embolism (26). All procedures performed were approved by the university institutional review board. Informed consent was obtained from all participants in the study after being informed of risks, measurements, and the purpose of the study.
Experimental design
This protocol was designed to compare the acute muscular response, as measured by changes in muscle thickness, MVC, and EMG, to resistance exercise under four different conditions
[labeled as % 1RM/% arterial occlusion pressure (AOP)]: traditional high load (70/0), very low load (15/0), and very low load with moderate (15/40) and high (15/80) blood flow restriction pressures. This was part of a larger experiment involving the upper and lower body. To assess the response in the lower body, participants made three visits to the laboratory at approximately the same time of day (±2 h), each separated by at least 1 week.
Visit 1 began by assessing exclusionary criteria and completing the informed consent followed by measurements of height, body mass, AOP, and 1RM. Participants were then familiarized with testing of MVC and bloodflow restriction exercise (1 set of 15 knee extensions in each leg using 15% 1RM and 40% AOP). The four experimental conditions were applied unilaterally over the second and third testing visits (two each day) to minimize any lasting effect of exercise on the same leg. For the testing visits, participants performed unilateral knee extension exercise to volitional failure with two of the four conditions (randomized and counterbalanced), completing one condition per leg; the following two conditions were tested on the last visit in the same manner. Testing visits began with 10 min of rest, followed by measurements of AOP (participant seated on the knee-extension machine), muscle thickness, and MVC (baseline measurements coded as Pre). Participants then completed the exercise protocol during which EMG amplitude was collected.
Following the cessation of exercise, muscle thickness and MVC were reassessed immedi- ately after (Post-0) and 15 min after (Post-15). Following the Post-15 time point, the same testing protocol, starting with AOP, commenced on the contralateral leg using the next condition.
Height and body mass
Height and body mass were measured using a stadiometer (Seca, Hamburg, Germany) and digital scale (Seca), respectively. Measurements were taken with participants wearing minimal clothing.
Arterial occlusion pressure (AOP)
While participants were seated in a knee-extension machine, a 10-cm-wide nylon cuff (SC10 Hokanson, Bellevue, WA, USA) was placed on the most proximal portion of the upper leg. A 10-cm-wide cuff was used to ensure that we were able to completely restrict bloodflow before reaching a cuff inflation pressure of 300 mmHg (equipment limitation).
This was based on previous research that shows a larger limb will need a greater pressure to occlude bloodflow (23), but using a wider cuff decreases the pressure needed (18). Once a pulse was found at the posterior tibialis artery (close to the medial malleolus) using a Doppler probe (MD6 Hokanson, Bellevue, WA, USA), the cuff was slowly inflated (E20 Rapid Cuff Inflator Hokanson, Bellevue, WA, USA). The cuff pressure was increased until there was no longer an auditory indication that a pulse distal to the cuff was present. The cuff inflation pressure (to the nearest mmHg) at which this occurred was determined to be the AOP.
One-repetition maximum (1RM)
Testing for 1RM in each leg was conducted in a unilateral knee-extension machine (Hammer Strength Iso-Lateral Leg Extension Life Fitness, Rosemont, IL, USA). Prior to testing, an unloaded warm up was conducted by instructing the participant to complete as many repetitions as they felt necessary to prepare for maximal effort. The test itself required participants to perform one repetition of the knee-extension exercise through a
full range of motion, with arms crossed over the chest (to standardize posture), using one leg at a time. To minimize subjectivity, the success of each attempt was determined by the participant’s ability to lift the weight high enough to reach and touch a bar placed at the end of the full range of motion. Attempts for each leg were alternated and separated by at least 45 s (90 s between the same legs). The first attempt was completed with a weight assumed to be approximately 30% of maximum; thereafter, weight was added after each successful attempt, and weight was removed following any unsuccessful attempt. The amount of weight added or removed was determined by the investigators and based upon the speed and effort of the previous attempt. This process was continued until the greatest load the participant could successfully lift was found. This load was determined as the 1RM and was found within approximately five maximal attempts.
Muscle thickness
Muscle thickness was measured on the anterior portion of the mid thigh (50% distance from the greater trochanter to the lateral epicondyle of the femur), while the participant was standing with feet shoulder width apart and weight evenly balanced. Measurements were taken using B-mode ultrasound (Logiq-e GE, Fairfield, CT, USA). A probe (L4-12t, GE, Fairfield, CT, USA) was coated with transmission gel and placed against the skin in a medial–lateral orientation with care taken not to depress the dermal surface. Once an image was obtained, it was frozen on-screen and the distance from the bone– muscle interface to the muscle–fat interface was recorded. A second image was taken following the same procedure and an average of the two measures was determined to be muscle thickness. If two measures were greater than 0.1 cm apart, a third image was taken and the average of the two closest measures was used. Muscle thickness was measured prior to MVC at Pre and Post-15, but was taken after MVC at Post-0 to reduce the time allowed for torque to recover. The coefficient of variation in muscle thickness over a similar time period, calculated from previous data in our laboratory, is 1.7%
(n=40).
Maximal voluntary contractions (MVC)
MVC was assessed isometrically using a dynamometer (Biodex Quickset System 4, Shirley, NY, USA). Participants were securely fastened upright in a chair, lateral epicondyle in line with the dynamometer axis of rotation, hip and knee at 90° flexion.
With their arms crossed over their chest, participants were instructed to kick out as forcefully as possible for approximately 3–8 s and were instructed to relax when a clear visual plateau or decline in torque production was observed. Peak torque was recorded for each attempt. Two attempts (separated by 60 s of rest) were completed at Pre- and Post-15.
However, only one attempt was completed at Post-0. This was done to better capture the effect of exercise-induced fatigue on torque production, because observing the rest period prior to the second attempt would have allowed for muscle recovery. Therefore, interpreting a second attempt following 60 s of rest would not make sense at that time point. Participants were provided with strong verbal encouragement and real-time visual feedback of the torque being produced during all attempts. The peak torque reached at each time point was recorded and used for analysis. The coefficient of variation in torque over a similar time period, calculated from previous data in our laboratory, is 4.5%
(n=40).
Exercise protocol
With arms crossed over their chest and a lap belt pulled securely over their waist, participants completed four sets of unilateral knee extensions (Hammer Strength Iso-Lateral Leg Extension Life Fitness) until volitional failure or 90 repetitions (whichever occurredfirst). Volitional failure was determined if a participant could no longer maintain proper exercise cadence (1-s eccentric and 1-s concentric) with a metronome or complete a full range of motion. To reach a full range of motion, the participants were required to lift the load from a starting position (approximately 90° knee flexion) to a fixed bar at approximately 180° knee flexion. For conditions using 15% 1RM, there was an interset rest period of 30 s, whereas 90 s separated sets for the 70% 1RM condition.
Bloodflow restriction
During bloodflow restriction conditions (15/40 and 15/80), a 10-cm-wide nylon cuff (SC10 Hokanson) was applied to the most proximal portion of the exercise leg and inflated to the required percentage (40% or 80%) of pre-exercise AOP. The cuff was inflated just before exercise and remained inflated until the cessation of the last set, at which point it was deflated and removed.
Surface EMG amplitude
EMG was collected by placing bipolar electrodes (Skintact, Innsbruck, Austria) over the rectus femoris and vastus lateralis muscles according to surface EMG for a non-invasive assessment of muscles guidelines (15). In short, electrodes were placed on the rectus femoris halfway between the anterior suprailiac spine and the superior aspect of the patella along the line of measurement. Electrodes for the vastus lateralis were placed two thirds the distance from the anterior suprailiac spine to the lateral condyle of the femur oriented in the direction of pull. A reference electrode was placed on the C7 vertebrae. All electrodes were placed with an interelectrode distance of 2 cm only after shaving, abrading, and cleaning the placement area of the skin with alcohol. The surface electrodes were connected to an amplifier and digitized (iWorkx, Dover, NH, USA). The signal was filtered using a band-pass technique (low-passfilter 500 Hz; high-passfilter 10 Hz), and amplified (1,000×) at a sampling rate of 1 kHz. The data were analyzed using commer- cially available software (iWorkx). EMG amplitude (root mean square) was recorded during MVC prior to exercise and during all exercise sets. Amplitude during thefirst three and last three repetitions of each set was normalized to the corresponding MVC for each visit. This was done by expressing the EMG amplitude during exercise as a percentage of the greatest 1-s epoch for EMG measured during isometric MVC. The relative values were used for statistical analyses (4).
Statistical analysis
All data were analyzed using SPSS 24.0 (IBM, Chicago, IL, USA). One-way repeated measures analysis of variance (ANOVA) was used to compare the changes in muscle thickness and MVC between conditions. To test for an interaction effect on EMG amplitude for thefirst three and last three repetitions of each set, as well as the number of repetitions completed per set, a 4 (Condition)×4 (Time) repeated measures ANOVA was used. In case of a significant interaction, one-way ANOVAs were used across conditions and across time points to determine the differences. Anαlevel was set at 0.05. Data are represented as mean (SD) unless otherwise stated.
Results Participant’s characteristics
On average, participants were 22 (2.7) years old, height of 174.5 (10.2) cm, and a body mass of 75.7 (17.3) kg. The average 1RM of the left and right leg was 36.1 (11.3) and 37.4 (11.3) kg, respectively.
Arterial occlusion pressure (AOP)
Despite using a 10-cm-wide cuff, there was one instance (prior to a 15/80 condition) in which AOP was not reached within 300 mmHg; thus, 240 mmHg was applied during exercise.
Mean pressure applied during bloodflow restriction was 80 (15) mmHg during 15/40 and 159 (29) mmHg during 15/80.
Muscle thickness
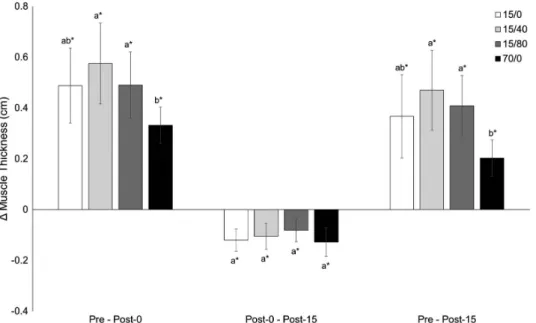
All conditions increased muscle thickness from Pre to Post-0 (Fig.1). The change for 70/0 was lower compared to 15/40 and 15/80 with a mean difference [95% CI] of−0.24 [−0.42,
−0.06] and−0.15 [−0.30,−0.01] cm, respectively. The decrease in muscle thickness from Post-0 to Post-15 did not differ between conditions. However, muscle thickness at Post-15 remained elevated over Pre with a lower change for 70/0 compared to 15/40 [mean difference (95% CI): −0.26 (−0.43,−0.10) cm] and 15/80 [mean difference (95% CI):−0.20 (−0.34,
−0.07) cm]. All changes are portrayed in Fig.1.
Maximal voluntary contractions (MVC)
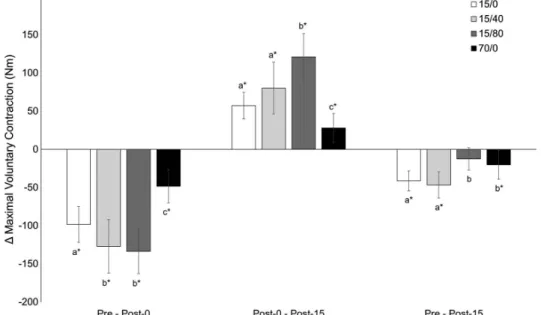
Torque decreased from Pre to Post-0 for all conditions (Fig. 2). The smallest change was observed following 70/0 [mean difference (95% CI): vs. 15/0=50.0 (24.7, 75.3) vs.
Fig. 1.Muscle thickness. Muscle thickness measures taken immediately before (Pre), immediately after (Post-0), and 15 min after (Post-15) exercise. Data presented as changes between time points (95% CI). An asterisk indicates a statistically significant change. Letters indicate differences between conditions within each time comparison. If two
conditions share at least one letter, there are no differences.αlevel=0.05
15/40=78.5 (47.5, 109.6) vs. 15/80=85.2 (55.4, 115.1) Nm]. In addition, 15/0 changes were smaller than 15/40 [mean difference (95% CI): 28.5 (0.6, 56.4)] and 15/80 [mean difference (95% CI): 35.2 (11.0, 59.4)]. Torque increased from Post-0 to Post-15. Changes were lowest for 70/0 [mean difference (95% CI): vs. 15/0=−29.1 (−53.8,−4.4) vs. 15/40=−52.1 (−84.8,
−19.4) vs. 15/80=−93.0 (−126.0,−59.9) Nm] and greatest for 15/80 [mean difference (95%
CI): vs. 15/0=63.8 (40.4, 87.2) vs. 15/40=40.8 (20.8, 60.8) Nm]. Post-15 torque remained below Pre values for 15/0, 15/40, and 70/0, while 15/80 did not differ. All changes in torque are portrayed in Fig.2.
Surface EMG amplitude
Due to equipment malfunctions, only 20 individuals were included in EMG analyses.
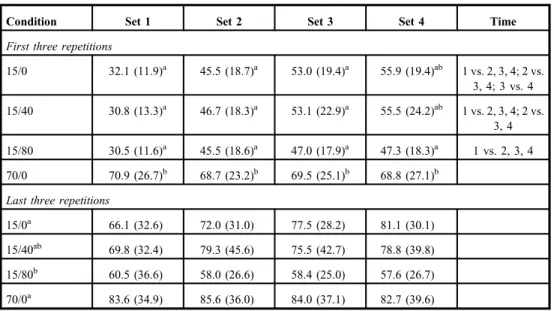
Regarding relative EMG amplitude of the rectus femoris during thefirst three repetitions, there was an interaction effect of condition and time (p<0.001; Table I). The EMG amplitude generally increased across sets for all conditions: [effect of time for 15/0, 15/40, and 15/80 (p<0.001)] with the exception of 70/0 (p=0.833). The EMG amplitude was also different between conditions for each set (p≤0.005). In addition, 70/0 was greater than all other conditions during Set 1 (p<0.001), Set 2 (p≤0.001), and Set 3 (p≤0.017), which were not different from one another (allp≥0.116). In contrast, there was no interaction effect on EMG amplitude during the last 3 repetitions for the rectus femoris (p=0.069).
There was also no main effect of time (p=0.232); however, there was a main effect of condition (p=0.043). Comparisons revealed a lower EMG amplitude during 15/80 compared to 15/0 (p=0.048) and 70/0 (p=0.015); all other comparisons were not different from each other (all p≥0.265).
Fig. 2.Maximal voluntary contraction. Measures of maximal voluntary contraction taken immediately before (Pre), immediately after (Post-0), and 15 min after (Post-15) exercise. Data presented as changes between time points (95%
CI). An asterisk indicates a statistically significant change. Letters indicate differences between conditions within each time comparison. If two conditions share at least one letter, there are no differences.αlevel=0.05
Regarding relative EMG amplitude of the vastus lateralis for thefirst three repetitions, there was an interaction effect of condition and time (p<0.001; TableII). The EMG amplitude of the vastus lateralis generally increased with successive sets: [effect of time for 15/0, 15/40, and 15/80 (allp<0.001)] except for 70/0 (p=0.781). The EMG over thefirst three repetitions was different across conditions for Set 1 (p<0.001), Set 2 (p=0.004), Set 3 (p=0.009), and Set 4 (p=0.012). Also, 70/0 was generally greater than all other conditions. In contrast, there was no interaction effect on EMG amplitude during the last three repetitions for the vastus lateralis (p=0.231). There was a main effect of time (p=0.007) and condition (p=.025). The EMG amplitude was lowest during Set 1 compared to all other sets (p≤0.034) and did not differ across other sets (allp≥0.391). A main effect of condition revealed that EMG amplitude during 70/0 was greater than all other conditions (allp≤0.046).
Repetitions
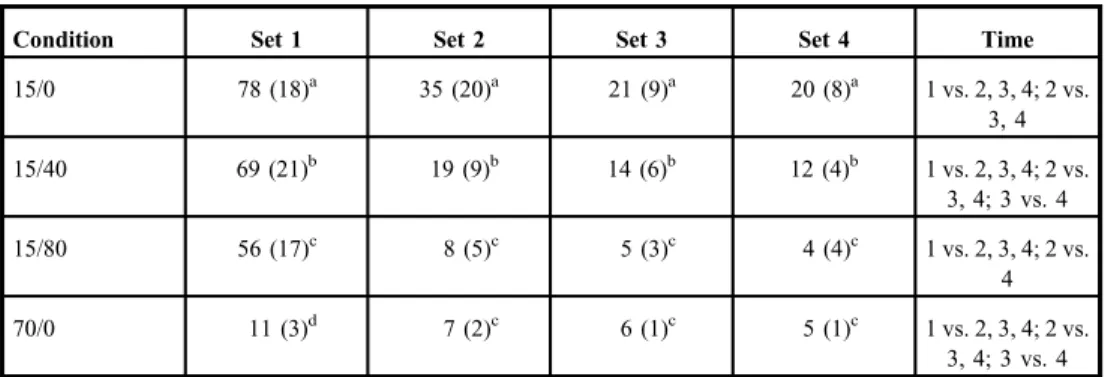
There was a significant interaction effect between condition and time on repetitions (p<0.001; Table III). Repetitions decreased across sets for 15/0 (p<0.001), 15/40 (p<0.001), 15/80 (p<0.001), and 70/0 (p<0.001). There was a difference between conditions within Sets 1–4 (allp<0.001). Within Set 1, all conditions were different from one another [15/0>15/40>15/80>70/0 (allp≤0.006)]. Within Sets 2–4, all conditions were different (all p<0.001) except for 15/80 and 70/0 when compared to each other (p≥0.368).
Table I.Electromyography amplitude of rectus femoris (% MVC)
Condition Set 1 Set 2 Set 3 Set 4 Time
First three repetitions
15/0 32.1 (11.9)a 45.5 (18.7)a 53.0 (19.4)a 55.9 (19.4)ab 1 vs. 2, 3, 4; 2 vs.
3, 4; 3 vs. 4 15/40 30.8 (13.3)a 46.7 (18.3)a 53.1 (22.9)a 55.5 (24.2)ab 1 vs. 2, 3, 4; 2 vs.
3, 4 15/80 30.5 (11.6)a 45.5 (18.6)a 47.0 (17.9)a 47.3 (18.3)a 1 vs. 2, 3, 4 70/0 70.9 (26.7)b 68.7 (23.2)b 69.5 (25.1)b 68.8 (27.1)b
Last three repetitions
15/0a 66.1 (32.6) 72.0 (31.0) 77.5 (28.2) 81.1 (30.1)
15/40ab 69.8 (32.4) 79.3 (45.6) 75.5 (42.7) 78.8 (39.8)
15/80b 60.5 (36.6) 58.0 (26.6) 58.4 (25.0) 57.6 (26.7)
70/0a 83.6 (34.9) 85.6 (36.0) 84.0 (37.1) 82.7 (39.6)
Electromyography amplitude measured during the first and last three repetitions of each set and normalized to amplitude measured during maximal voluntary contraction (% MVC). Data are presented as mean (SD). Time column represents differences across sets within each condition. Superscript letters next to numeric values indicate differences between conditions within the set. Superscript letters next to condition labels indicate differences due to main effects of condition (regardless of set). If at least one superscript letter is the same, there are no differences.
αlevel=0.05
Discussion
The majorfindings of the study were that increases in muscle thickness induced by exercise were lower using high loads compared to very low loads combined with blood flow
Table II.Electromyography amplitude of vastus lateralis (% MVC)
Condition Set 1 Set 2 Set 3 Set 4 Time
First three repetitions
15/0 25.2 (8.8)a 44.3 (18.0)a 55.0 (20.9)a 58.1 (24.1)a 1 vs. 2, 3, 4; 2 vs.
3, 4 15/40 25.2 (11.9)a 50.6 (23.6)ab 54.7 (23.9)a 58.9 (25.6)a 1 vs. 2, 3, 4; 2 vs.
3, 4; 3 vs. 4 15/80 25.8 (11.6)a 52.8 (19.1)b 57.8 (21.0)a 57.4 (22.4)a 1 vs. 2, 3, 4; 2
vs. 3 70/0 87.6 (64.3)b 87.0 (56.6)c 88.2 (53.5)b 89.4 (53.2)b
Last three repetitions
15/0a 65.8 (23.6) 75.2 (25.3) 77.4 (21.0) 79.0 (22.9)
15/40a 68.5 (28.7) 74.9 (27.7) 74.9 (31.1) 76.8 (31.4)
15/80a 61.8 (24.4) 69.8 (29.6) 73.0 (30.8) 66.9 (26.1)
70/0b 105.1 (76.7) 109.1 (66.9) 106.7 (70.7) 104.7 (60.3)
Electromyography amplitude measured during thefirst and last three repetitions of each set and normalized to amplitude measured during maximal voluntary contraction (% MVC). Data are presented as mean (SD). Time column represents differences across sets within each condition. Superscript letters next to numeric values indicate differences between conditions within the set. Superscript letters next to condition labels indicate differences due to main effects of condition (regardless of set). Letters next to set labels indicate differences due to main effects of time (regardless of condition). If at least one superscript letters is the same, there are no differences.αlevel=0.05
Table III.Repetitions to volitional failure
Condition Set 1 Set 2 Set 3 Set 4 Time
15/0 78 (18)a 35 (20)a 21 (9)a 20 (8)a 1 vs. 2, 3, 4; 2 vs.
3, 4
15/40 69 (21)b 19 (9)b 14 (6)b 12 (4)b 1 vs. 2, 3, 4; 2 vs.
3, 4; 3 vs. 4
15/80 56 (17)c 8 (5)c 5 (3)c 4 (4)c 1 vs. 2, 3, 4; 2 vs.
4
70/0 11 (3)d 7 (2)c 6 (1)c 5 (1)c 1 vs. 2, 3, 4; 2 vs.
3, 4; 3 vs. 4
The number of repetitions required for participants to reach volitional failure during each set. Data are presented as mean (SD). Time column represents differences across sets within each condition. Superscript letters next to numeric values indicate differences between conditions within the set. If at least one superscript letters is the same, there are no differences.αlevel=0.05
restriction. The decrease in torque production of the knee extensors was greater with the lower loads and further augmented by restriction. The EMG amplitude of the first three repetitions generally increased across sets in the low-load conditions, while staying similar for the last three repetitions. Amplitude was also highest during the high-load condition, despite not changing across sets. Finally, on average, individuals reached volitional failure with 15% 1RM alone suggesting that bloodflow restriction was not necessary. However, the number of repetitions required to reach failure was decreased in a pressure-dependent manner. Overall, the acute muscular responses previously associated with muscle hypertro- phy may be augmented by bloodflow restriction using a high load or very low load alone.
Muscle thickness
Muscle cell swelling has been proposed as one of the mechanisms through which bloodflow restriction stimulates muscle growth (19), since previous experimental protocols in hepa- tocytes showed that greater cell swelling leads to an inhibition in protein breakdown and a possible increase in protein synthesis (14,30). Although previous research has supported this concept in skeletal muscle tissue, it was shown in rodent models (27). Applying bloodflow restriction in humans, in the absence of exercise, has only been shown to attenuate muscle mass losses over control groups (31). Thus, the stimulus of applying restriction alone may not be enough to cause hypertrophy through cell swelling. Furthermore, while exercising, this mechanism may not be unique to bloodflow restriction exercise as both low-load and high-load conditions without restriction increase muscle thickness post-exercise (24). The current data suggest a fluid shift into the muscle, given the thickness was greater than baseline immediately after and 15 min after all exercise conditions. Although this response did not differ between very low-load and high-load exercise alone, the combination of restriction pressure and very low loads did seem to augment the response over high loads.
Previous studies have shown that swelling may be augmented by restriction when using an arbitrary repetition (30-15-15-15 repetitions) protocol (6). While the response during a goal repetition protocol may be due to differential levels of fatigue, participants in this study exercised until volitional failure. In contrast to ourfindings, others have found that, when exercise is taken to failure, the acute change in muscle thickness is similar with and without restriction, as well as with high loads (20,24,33). Whether the changes we observed in the acute response manifest into long-term differences in muscle mass is unknown; thus, further research is warranted.
Maximal voluntary contraction (MVC)
The amount of torque produced by the knee extensors immediately following exercise gives an idea of how fatiguing each condition was when compared to pre-exercise values. Fatigue was greater when comparing the low-load to the high-load condition and was further increased when applying bloodflow restriction pressure. The difference in fatigue between loads is logical, given the execution of exercise to failure. One would have to lose less of their overall force-generating capacity to reach volitional failure when exercising with a load that is a greater percentage of their 1RM. For example, upon reaching failure at 70% 1RM, a participant would still have the muscular capacity to lift a load of 15% 1RM. Thus, when being asked to maximally contract after a high-load condition, as they were in this study, the participant failing at 70% 1RM would have the capacity to produce a greater overall level of torque immediately after failure than if asked to maximally contract after 15% 1RM to failure.
The augmenting of fatigue by greater blood flow restriction pressures has been shown
previously during very low-load exercise in the upper body. However, this was during an arbitrary repetition protocol in which most people completed all repetitions (6). When going to volitional failure with the same relative high load (28), previous researchers have found that blood flow restriction does not appear to augment the increase in fatigue, but there is some evidence that it may (20) or may not (4) be augmented by increasing pressure when exercising with lower loads. It should be noted that both Counts et al. (4) and Jessee et al. (20) used the same common repetition protocol as Dankel et al. (6), but with 30% 1RM, which induced failure within all pressure conditions prior to reaching all goal repetitions. Increasing bloodflow restriction pressure causes a greater accumulation of metabolic by-products and acidity level within the exercising/restricted limb (32), both of which may interfere with contractile properties of the muscle, thus augmenting fatigue (21). However, this effect may not last post-cuff deflation, as the immediate change in torque due to exercise (Pre–Post-0) did not differ between high- and moderate-pressure blood flow restriction exercises. The changes in torque from Pre to Post-15 were greater with very low load alone and very low load with lower restriction compared to higher restriction pressure and high-load conditions.
This could potentially be due to the greater number of repetitions performed in the 15/0 and 15/40 conditions and indicates that the muscle may have been stressed to a greater degree than in the 15/80 and 70/0 conditions. Whether this difference between conditions is also observed in the days following exercise is unknown.
Surface electromyography amplitude
The activation and subsequent mechanical tension placed on musclefibers seem to activate protein synthesis within the cell through the mechanistic target of rapamycin complex 1 pathway (8). This appears to be the same mechanism through which bloodflow restriction exercise induces muscle adaptation (12). Thus, the effectiveness of an exercise protocol seems to be dependent upon its ability to adequately stimulate as many muscle fibers as possible. Surface EMG amplitude may give some idea on the overall level of muscle activation; however, it should be interpreted cautiously as it is not a direct measurement of motor unit activation (9); thus, we cannot say which units are being activated and when. The difference in EMG amplitude between the high- and low-load conditions in this study would most likely be explained by the difference in the level of contraction needed to overcome the greater relative percentage of maximum muscle strength at high load. This could lead one to believe that the growth stimulus from high load would be greater, which may be true if all conditions did not go to failure (3,7,10,25). When exercising to failure with a low load (i.e., 15% 1RM), any given contractions need not be as forceful as with a high load (i.e., 70%
1RM) because less external resistance needs to be overcome; thus less motor units, overall, would need to be activated at one time, thereby generating a smaller EMG signal for a contraction during low-load exercise compared to high-load exercise. However, this does not mean higher threshold motor units are not recruited by low-load exercise. At the beginning of the low-load exercise, only low threshold motor units may be recruited, but when the exercise is taken to failure and lower threshold motor units begin to fatigue, they may not generate the force capacity necessary to sustain the contraction and higher threshold motor units would need to be recruited (2,29). This concept illustrates how low-load exercise to failure would recruit and stimulate a similar amount of muscle fibers to grow as compared to high-load exercise. The difference, however, would be the timing of activation offibers between the two loading paradigms: most fibers recruited all at once in a high-load model versus a progressive recruitment of higher threshold fibers as lower thresholdfibers fatigue during
low-load exercise taken to volitional failure. When not taken to failure, previous studies have shown a greater EMG amplitude when applying blood flow restriction to a goal repetition protocol (11). However, this may be a difference in the level of fatigue induced versus a unique ability of restriction to augment EMG amplitude, whereby the non-restricted condition would need more time to reach fatigue and stimulate higher threshold fibers because the restriction of bloodflow expedites fatigue (10,13). This is supported by the lack of an increase in EMG amplitude when blood flow restriction is applied to a high-load condition (5).
Repetitions
The results observed for repetitions support those of torque and EMG amplitude. For example, the muscle would need to lose less capacity overall to fail at a high load, which was observed to result in the lowest number of repetitions followed by all low-load conditions. When comparing low-load conditions, the repetitions were decreased with an increase in pressure, which we think was due to an increasing buildup of metabolites and acidity within the exercising limb.
Limitations
The study contains limitations and could be improved upon in future studies. For example, the ultrasound muscle thickness measurement does not directly measure thefluid inside the muscle cells; therefore, we cannot be certain that the increase in muscle thickness following exercise was caused byfluid entering the cell versusfluid accumulating in the extracellular space. Due to the study design and equipment setup, participants had to move from the knee- extension machine to the dynamometer to perform an MVC immediately post-exercise;
although this procedure was performed quickly (approximately 30 s), there could have been some recovery within the muscle causing us to not capture the true fatigue response.
Furthermore, since we used surface EMG, we cannot infer motor unit recruitment from our data as we did not measure it specifically. However, we believe we were careful in our interpretation of EMG and did not overstate ourfindings. Finally, we are only assessing some of the acute muscular responses to these exercise protocols, not all, to make some inferences about expected training responses. To confirm, training studies comparing these conditions would be necessary.
Conclusions
Changes in muscle thickness, fatigue, EMG amplitude, and repetitions to failure differed across load and pressures. Since the difference in EMG amplitude is likely due to differences in the timing of motor unit recruitment between protocols, rather than a difference in the number offibers recruited, it seems as though exercising to failure with very low loads may induce a similar or greater muscular response in comparison to high-load training. Applying blood flow restriction, however, reduced the amount of work required to reach volitional failure in a pressure-dependent manner. Thesefindings may be important clinically in terms of limited ability or in healthy populations when wanting to avoid large amounts of mechanical work/stress, but long-term training studies should be conducted to confirm this hypothesis.
Acknowledgements
The authors would like to thank all the participants who took part in this study.
REFERENCES
1. American College of Sports Medicine Position Stand: Progression models in resistance training for healthy adults. Med. Sci. Sports Exerc. 41, 687–708 (2009)
2. Brandner CR, Warmington SA, Kidgell DJ: Corticomotor excitability is increased following an acute bout of bloodflow restriction resistance exercise. Front. Hum. Neurosci. 9, 652 (2015)
3. Burd NA, West DW, Staples AW, Atherton PJ, Baker JM, Moore DR, Holwerda AM, Parise G, Rennie MJ, Baker SK, Phillips SM: Low-load high volume resistance exercise stimulates muscle protein synthesis more than high-load low volume resistance exercise in young men. PLoS One 5, e12033 (2010)
4. Counts BR, Dankel SJ, Barnett BE, Kim D, Mouser JG, Allen KM, Thiebaud RS, Abe T, Bemben MG, Loenneke JP: Influence of relative bloodflow restriction pressure on muscle activation and muscle adaptation.
Muscle Nerve 53, 438–445 (2016)
5. Dankel SJ, Buckner SL, Jessee MB, Mattocks KT, Mouser JG, Counts BR, Laurentino GC, Loenneke JP: Can bloodflow restriction augment muscle activation during high-load training? Clin. Physiol. Funct. Imaging 38, 291–295 (2018)
6. Dankel SJ, Jessee MB, Buckner SL, Mouser JG, Mattocks KT, Loenneke JP: Are higher bloodflow restriction pressures more beneficial when lower loads are used? Physiol. Int. 104, 247–257 (2017)
7. Dankel SJ, Jessee MB, Mattocks KT, Mouser JG, Counts BR, Buckner SL, Loenneke JP: Training to fatigue: the answer for standardization when assessing muscle hypertrophy? Sports Med. 47, 1021–1027 (2017) 8. Drummond MJ, Fry CS, Glynn EL, Dreyer HC, Dhanani S, Timmerman KL, Volpi E, Rasmussen BB:
Rapamycin administration in humans blocks the contraction-induced increase in skeletal muscle protein synthesis. J. Physiol. 587, 1535–1546 (2009)
9. Enoka RM, Duchateau J: Inappropriate interpretation of surface EMG signals and musclefiber characteristics impedes understanding of the control of neuromuscular function. J. Appl. Physiol. 119, 1516–1518 (2015) 10. Fahs CA, Loenneke JP, Thiebaud RS, Rossow LM, Kim D, Abe T, Beck TW, Feeback DL, Bemben DA,
Bemben MG: Muscular adaptations to fatiguing exercise with and without bloodflow restriction. Clin. Physiol.
Funct. Imaging. 35, 167–176 (2015)
11. Fatela P, Reis JF, Mendonca GV, Avela J, Mil-Homens P: Acute effects of exercise under different levels of blood-flow restriction on muscle activation and fatigue. Eur. J. Appl. Physiol. 116, 985–995 (2016) 12. Fry CS, Glynn EL, Drummond MJ, Timmerman KL, Fujita S, Abe T, Dhanani S, Volpi E, Rasmussen BB:
Bloodflow restriction exercise stimulates mTORC1 signaling and muscle protein synthesis in older men. J.
Appl. Physiol. (1985). 108, 1199–1209 (2010)
13. Ganesan G, Cotter JA, Reuland W, Cerussi AE, Tromberg BJ, Galassetti P: Effect of bloodflow restriction on tissue oxygenation during knee extension. Med. Sci. Sports Exerc. 47, 185–193 (2015)
14. Haussinger D: The role of cellular hydration in the regulation of cell function. Biochem. J. 313(Pt. 3), 697–710 (1996)
15. Hermens HJ, Freriks B, Disselhorst-Klug C, Rau G: Development of recommendations for SEMG sensors and sensor placement procedures. J. Electromyogr. Kinesiol. 10, 361–374 (2000)
16. Holm L, Reitelseder S, Pedersen TG, Doessing S, Petersen SG, Flyvbjerg A, Andersen JL, Aagaard P, Kjaer M:
Changes in muscle size and MHC composition in response to resistance exercise with heavy and light loading intensity. J. Appl. Physiol. (1985) 105, 1454–1461 (2008)
17. Hunter SK, Enoka RM: Sex differences in the fatigability of arm muscles depends on absolute force during isometric contractions. J. Appl. Physiol. (1985) 91, 2686–2694 (2001)
18. Jessee MB, Buckner SL, Dankel SJ, Counts BR, Abe T, Loenneke JP: The influence of cuff width, sex, and race on arterial occlusion: implications for bloodflow restriction research. Sports Med. 46, 913–921 (2016) 19. Jessee MB, Mattocks KT, Buckner SL, Dankel SJ, Mouser JG, Abe T, Loenneke JP: Mechanisms of bloodflow
restriction: the new testament. Tech. Orthop. 33, 72–79 (2018)
20. Jessee MB, Mattocks KT, Buckner SL, Mouser JG, Counts BR, Dankel SJ, Laurentino GC, Loenneke JP: The acute muscular response to bloodflow-restricted exercise with very low relative pressure. Clin. Physiol. Funct.
Imaging. 38, 304–311 (2018)
21. Keyser RE: Peripheral fatigue: high-energy phosphates and hydrogen ions. PM R. 2, 347–358 (2010)
22. Lixandrao ME, Ugrinowitsch C, Laurentino G, Libardi CA, Aihara AY, Cardoso FN, Tricoli V, Roschel H:
Effects of exercise intensity and occlusion pressure after 12 weeks of resistance training with blood-flow restriction. Eur. J. Appl. Physiol. 115, 2471–2480 (2015)
23. Loenneke JP, Allen KM, Mouser JG, Thiebaud RS, Kim D, Abe T, Bemben MG: Bloodflow restriction in the upper and lower limbs is predicted by limb circumference and systolic blood pressure. Eur. J. Appl. Physiol. 115, 397–405 (2015)
24. Loenneke JP, Kim D, Fahs CA, Thiebaud RS, Abe T, Larson RD, Bemben DA, Bemben MG: The influence of exercise load with and without different levels of bloodflow restriction on acute changes in muscle thickness and lactate. Clin. Physiol. Funct. Imaging. 37, 734–740 (2017)
25. Morton RW, Oikawa SY, Wavell CG, Mazara N, McGlory C, Quadrilatero J, Baechler BL, Baker SK, Phillips SM:
Neither load nor systemic hormones determine resistance training-mediated hypertrophy or strength gains in resistance-trained young men. J. Appl. Physiol. (1985) 121, 129–138 (2016)
26. Motykie GD, Zebala LP, Caprini JA, Lee CE, Arcelus JI, Reyna JJ, Cohen EB: A guide to venous thromboembolism risk factor assessment. J. Thromb. Thrombolysis. 9, 253–262, (2000)
27. Nakajima T, Yasuda T, Koide S, Yamasoba T, Obi S, Toyoda S, Sato Y, Inoue T, Kano Y: Repetitive restriction of muscle bloodflow enhances mTOR signaling pathways in a rat model. Heart Vessels 31, 1685–1695 (2016) 28. Neto GR, Santos HH, Sousa JB, Junior AT, Araujo JP, Aniceto RR, Sousa MS: Effects of high-intensity blood
flow restriction exercise on muscle fatigue. J. Hum. Kinet. 41, 163–172 (2014)
29. Potvin JR, Fuglevand AJ: A motor unit-based model of muscle fatigue. PLoS Comput. Biol. 13, e1005581 (2017)
30. Stoll B, Gerok W, Lang F, Haussinger D: Liver cell volume and protein synthesis. Biochem. J. 287(Pt. 1), 217–222 (1992)
31. Takarada Y, Takazawa H, Ishii N: Applications of vascular occlusion diminish disuse atrophy of knee extensor muscles. Med. Sci. Sports Exerc. 32, 2035–2039 (2000)
32. Yasuda T, Abe T, Brechue WF, Iida H, Takano H, Meguro K, Kurano M, Fujita S, Nakajima T: Venous blood gas and metabolite response to low-intensity muscle contractions with external limb compression. Metabolism 59, 1510–1519 (2010)
33. Yasuda T, Fukumura K, Iida H, Nakajima T: Effect of low-load resistance exercise with and without bloodflow restriction to volitional fatigue on muscle swelling. Eur. J. Appl. Physiol. 115, 919–926 (2015)
34. Yasuda T, Loenneke JP, Thiebaud RS, Abe T: Effects of bloodflow restricted low-intensity concentric or eccentric training on muscle size and strength. PLoS One 7, e52843 (2012)