(will be inserted by the editor)
Code Coverage Dierences of Java Bytecode and Source Code Instrumentation Tools
Ferenc Horváth · Tamás Gergely · Árpád Beszédes · Dávid Tengeri · Gerg® Balogh · Tibor Gyimóthy
Received: date / Accepted: date
Abstract Many software testing elds, like white-box testing, test case gener- ation, test prioritization and fault localization, depend on code coverage mea- surement. If used as an overall completeness measure, the minor inaccuracies of coverage data reported by a tool do not matter that much; however, in certain situations they can lead to serious confusion. For example, a code element that is falsely reported as covered can introduce false condence in the test. This work in- vestigates code coverage measurement issues for the Java programming language.
For Java, the prevalent approach to code coverage measurement is using bytecode instrumentation due to its various benets over source code instrumentation. As we have experienced, bytecode instrumentation-based code coverage tools produce dierent results than source code instrumentation-based ones in terms of the re- ported items as covered. We report on an empirical study to compare the code coverage results provided by tools using the dierent instrumentation types for Java coverage measurement on the method level. In particular, we want to nd out how much a bytecode instrumentation approach is inaccurate compared to a source code instrumentation method. The dierences are systematically investi- gated both in quantitative (how much the outputs dier) and in qualitative terms (what the causes for the dierences are). In addition, the impact on test prioriti- zation and test suite reduction a possible application of coverage measurement is investigated in more detail as well.
Keywords Code coverage·white-box testing·Java bytecode instrumentation· source code instrumentation·coverage tools·empirical study
The nal publication is available at Springer via http://dx.doi.org/10.1007/
s11219-017-9389-z.
Ferenc Horváth·Tamás Gergely·Árpád Beszédes·Dávid Tengeri·Tibor Gyimóthy Department of Software Engineering, University of Szeged, Szeged, Hungary E-mail: {hferenc,gertom,beszedes,dtengeri,gyimothy}@inf.u-szeged.hu Gerg® Balogh·Tibor Gyimóthy
MTA-SZTE Research Group on Artical Intelligence, University of Szeged, Szeged, Hungary E-mail: {geryxyz,gyimothy}@inf.u-szeged.hu
1 Introduction
In software development and evolution, dierent processes are used to keep the required quality level of the software, while the requirements and the code are con- stantly changing. Several activities aiding these processes require reliable measure- ment of code coverage, a test completeness measure. As any other test complete- ness measure, it does not necessarily have a direct relationship to fault detection rate (Inozemtseva and Holmes, 2014), however code coverage is widely used and relied upon in several applications. This includes white-box test design, regression testing, selective retesting, ecient fault detection, fault localization and debug- ging, as well as maintaining the eciency and eectiveness of the test assets on a long term (Pinto et al,2012). Essentially, code coverage indicates which code parts are exercised during the execution of a set of test cases on the system under test.
The knowledge about the (non-)covered elements will underpin various decisions during these testing activities, so any inaccuracies in the measured data might be critical.
Software testers have long established the theory and practice of code cover- age measurement: various types of coverage criteria like statement, branch and others (Black et al, 2012), as well as technical solutions including various kinds of instrumentation methods (Yang et al,2009). This work was motivated by our experience in using code coverage measurement tools for the Java programming language. Even in a relatively simple setting (a method level analysis of medium size software with popular and stable tools), we found signicant dierences in the outputs of dierent tools applied for the same task. The dierences in the com- puted coverages might have serious impacts in dierent applications, such as false condence in white-box testing, diculties in coverage-driven test case generation, and inecient test prioritization, just to name a few.
Various reasons might exist for such dierences and surely there are pecu- liar issues which tool builders have to face, but we have found that in the Java environment, the most notable issue is how code instrumentation is done. Code in- strumentation technique is used to place probes into the program, which will be activated upon runtime to collect the necessary information about code coverage.
In Java, there are two fundamentally dierent instrumentation approaches: source code level and bytecode level. Both approaches have benets and drawbacks, but many researchers and practitioners prefer to use bytecode instrumentation due to its various technical benets (Yang et al, 2009). However, in most cases the application of code coverage is on the source code, hence it is worthwhile to in- vestigate and compare the two approaches. In earlier work (Tengeri et al, 2016), we investigated these two types of code coverage measurement approaches via two representative tools on a set of open source Java programs. We found that there were many deviations in the raw coverage results due to the various techni- cal and conceptual dierences of the instrumentation methods. In this work, we have ne-tuned our measurements based on the previous results, examined and de- scribed the deviations in the coverage in more detail, and performed experiments and quantitative analysis on the eect of the dierences. Similar studies exist in relation to branches and statements (Li et al,2013).
Extending the earlier experiment, this work reports on an empirical study to compare the code coverage results provided by tools using the dierent instru- mentation types for Java coverage measurement on the method level. We initially
considered a relatively large set of candidate tools referenced in literature and used by practitioners, and then we started the experiments with ve popular tools which seemed mature enough and actively used and developed. Overall coverage results are compared using these tools, but eventually we selected one representative for each instrumentation approach to perform the in-depth analysis of the dierences (JaCoCo1 andClover2). The measurements are made on a set of 8 benchmark pro- grams from the open source domain which are actively developed real size systems with large test suites. The dierences are systematically investigated both quanti- tatively (how much the outputs dier) and qualitatively (what the causes for the dierences are). Not only do we compare the coverages directly, but investigate the impact on a possible application of coverage measurement in more detail as well. The chosen application is test prioritization/test suite reduction based on code coverage information.
We believe that the two selected tools are good representatives of the two approaches and being the most widely used ones, many would benet from our results. A big initial question was, however, if we could use the tools as the ground truth in the comparison. Since most of the applications of code coverage operate on the source code, the source code instrumentation toolCloverwas the candidate for this role. Thus, we performed a manual verication of the code coverage re- sults provided by this tool by randomly selecting the outputs for investigation while maintaining a good overall functional coverage of the subject systems. We interpreted the results in terms of the actual test executions and program behav- ior on the level of source code. During this verication we did not nd any issues, which made it possible to use this tool as a ground truth for source code coverage results.
To perform the actual comparison of the tools, various technical modications had to be done on the tools and the measurement environment; for instance, to be able to perform per-test case measurements and calculate not only overall coverage ratios. This enabled a more detailed investigation of the possible causes for the dierence.
Our results indicate that the dierences between the coverage measurements can vary in a large range, and that it is dicult to predict in what situations will be the risk of measurement inaccuracy higher for a particular application. In summary, we make the following contributions:
1. The majority of earlier work in the topic dealt with lower level analyses such as statements and branches. Instead, we performed the experiments on the granularity of Java methods in real size Java systems with realistic test suites.
We found that contrary to our preliminary expectations even at this level there might be signicant dierences between bytecode instrumentation and source code instrumentation approaches. Method level granularity is often the viable solution due to the large system size. Furthermore, if we can demonstrate the weaknesses of the tools at this level, they are expected to be present at the lower levels of granularity as well.
2. We found that the overall coverage dierences between the tools can vary in both directions, and in seven out of the eight subject programs they are at most
1 http://eclemma.org/jacoco/
2 https://www.atlassian.com/software/clover/
1.5%. However, for the last program we measured an extremely large dierence of 40% (this was then attributed to the dierent handling of generated code).
3. We looked at more detailed dierences as well with respect to individual test cases and program elements. In many applications of code coverage (in debug- ging, for instance) subtle dierences at this level may lead to serious confusion.
We measured dierences of up to 14% between the individual test cases, and dierences of over 20% between the methods. In a dierent analysis of the re- sults, we found that a substantial portion of the methods in the subjects were aected by this inaccuracy (up to 30% of the methods in one of the subject programs).
4. We systematically investigated the reasons for the dierences and found that some of them were tool specic, while the others would be attributed to the instrumentation approach. This list of reasons may be used as a guideline for the users of coverage tools on how to avoid or workaround the issues when bytecode instrumentation based approach is used.
5. We also measured the eect of the dierences on the application of code cover- age to test prioritization. We found that the prioritized lists produced by the tools diered signicantly (with correlations below 0.5), which means that the impact of the inaccuracies might be signicant. We think that this low corre- lation is a great risk: in other words, it is not possible to predict the potential amplication of a given coverage inaccuracy in a particular application. This also aects any related research which is based on bytecode instrumentation coverage measurement to a large extent.
The paper is organized as follows. Section 2 gives the background of code coverage and its usability in dierent applications. We also list the risks of coverage measurement for Java and the relation to similar works in this section. We state our research aims in more detail in Section3. Section4describes the basic setup for the experiments, the tools, and the subject systems, while Section5presents the results of the empirical study. This section is organized according to our research agenda:
rst, we concentrate on the quantitative and qualitative dierences, and then, we investigate the eect on the test case prioritization application. In Section6, we summarize our ndings and provide a more general discussion before concluding in Section7.
2 Background
The term code coverage in software testing denotes the amount of program code which is exercised during the execution of a set of test cases on the system under test. This indicator may simply be used as an overall coverage percentage, a proxy for test completeness, but typically more detailed data is also available about individual program elements or test cases. Code coverage measurement is the basis of several software testing and quality assurance practices including white-box testing (Ostrand, 2002), test suite reduction (Rothermel et al, 2002), or fault localization (Harrold et al,1998).
2.1 Dierent Types and Levels of Code Coverage
Code coverage criteria are often used as goals to be achieved in white-box testing:
test cases are to be designed until the required coverage level has been reached ac- cording to the selected criteria. However, many possible ways exist to dene these criteria. They include various granularity levels of the analysis (such as component, method, or statement) and dierent types of exercised parts of program code (for instance, individual instructions, blocks, control paths, data paths, etc). The term code coverage without further specication usually refers to statement level analy- sis and denotes statement coverage. Statement coverage shows which instructions of the program are executed during the tests and which are not touched. Even at this level, there may be dierences in what constitutes an instruction, which complicates the uniform interpretation of the results. In Java, for instance, a single source code statement is implemented with a sequence of bytecode instructions, and the mapping between these two levels is not always straightforward due to various reasons such as compiler optimization.
Another common coverage criterion is decision coverage, where the question is whether both outcomes of a decision (such as an if statement) are tested, or if a loop is tested with entering and skipping the body. Since this level of analysis deals with not only individual instructions but control ow as well, coverage mea- surement at this level imposes more issues. For instance, Li et al. (Li et al,2013) showed that decision coverage at statement level for the Java language is prone to dierences between the source code and the bytecode measurements; they found that practically the two results were hardly comparable. The main reasons for this besides the dierent optimizations were the actual shortcuts built in the imple- mentation of the logical expressions: what seems to be a single logical expression in the source code can be a very complex control structure in the bytecode.
These examples show that even within a specic language diculties might occur in dening and interpreting code coverage criteria. This may be even more emphasized at more sophisticated levels such as control path or data-ow based coverages (Ntafos,1988).
Coarser granularity level coverage criteria (such as methods, classes, or compo- nents) are also common, for instance, when the system size and complexity do not enable a ne-grained analysis. Also, often it is more useful to start the coverage analysis in a top-down fashion by starting from the components that are not executed at all, extend the tests to cover that component at least once, and then continue the analysis with lower levels. In particular, procedure level coverage is a good compromise between analysis precision and the ability to handle big systems.
In our research, we primarily deal with this granularity, that is, we treat proce- dures (Java methods in particular) as atomic code elements that can be covered.
At this level covered means that the method has been executed at least once during the tests but we do not care about what instructions, paths, or data have been exercised in particular. Contrary to what would be expected, this granularity level also involves diculties in the interpretation of code coverage, which was the main motivation for our research. In particular, we found signicant dierences be- tween dierent code coverage measurement tools for Java congured for method level analysis (Tengeri et al,2016).
2.2 Applications of Code Coverage and Risks
Uncertainties in code coverage measurement may impose various risks. Here, we overview the notable applications of code coverage measurement and how they may be impacted by the uncertainties.
The most important application of code coverage measurement is white-box testing (often referred to as structure-based testing). It is a dynamic test design technique relying on code coverage to systematically verify the amount of tests needed to achieve a completeness goal, a coverage criterion. This goal is sometimes expected to be a complete (that is, 100%) coverage, however in practice, this high level is rarely attainable due to various reasons. As white-box testing directly uses coverage data, it is obvious that inaccuracies in the coverage results directly inuence the testing activity. On the one hand, a small dierence of one or two percentages in the overall coverage value is usually irrelevant if that value is used to assess the completeness. On the other hand, an item inaccurately reported to be covered provides false condence in the code during a detailed evaluation, and it may result in unnecessary testing costs if an item is falsely reported to be uncovered.
Other applications of code coverage measurement include general software quality assessment3, automatic test case generation (Rayadurgam and Heimdahl, 2001;Fraser and Arcuri,2011), code coverage-based fault localization (Jones and Harrold, 2005; Yoo et al, 2013), test selection and prioritization (Outt et al, 1995;Graves et al,2001;Vidács et al,2014), mutation testing (Usaola and Mateo, 2010; Jia and Harman, 2011), and in general, program and test comprehension with traceability analysis (Perez and Abreu, 2014). As in the case of white-box testing, the inaccuracy of code coverage measurement may aect these activities in dierent ways.
Certain applications do not suer that much if the coverage data is not pre- cise. This includes overall quality assessment, where the coverage ratio is typically used as part of a more complex set of metrics for software assessment. Here, a dierence of a few percentages usually does not aect the overall score. Program comprehension (and general project traceability) is supported by knowing which program code is executed by which test case. Depending on the usage scenario of this information, inaccurate results may lead to either false decisions or simply an increased eort to interpret the data.
The other mentioned applications have high signicance in academic research, and the accuracy and validity of the published results may be aected by the issues with the code coverage data. In coverage-driven test case generation, for instance, the generation engine can be confused by an imprecise coverage tool because a falsely reported non-coverage will keep the generation algorithm trying to generate test cases for the program element.
As another example, in code coverage-based fault localization the program elements are ranked according to how suspicious they are to contain the fault based on test case coverage and pass/fail status. Wrong coverage data may inuence the fault localization process because if the faulty element is erroneously reported as not covered by a failing test case, the suspicion will move to other (possibly non-defective) program elements.
3 http://www.sonarqube.org/
2.3 Code Coverage Measurement for Java
This paper deals with the applications of code coverage measurement for Java programs. Java itself is a popular language, and due to its language and runtime design, it can be more easily handled as the subject of code coverage measurement than other languages directly compiled for native code (like C++).
In addition, the increased demand for code coverage measurement in agile projects where continuous integration requires the constant monitoring of the code quality and regression testing has led to the appearance of a large set of tools for this purpose, many of which are free of charge and open source. However, it seems that the working principles, benets, drawbacks, and any associated risks with these tools are not well understood by practitioners and researchers yet.
In Java, two conceptually dierent approaches are used for coverage measure- ment. In both approaches, the system under test and/or the runtime engine is instrumented, meaning that measurement probes are placed within the system at specic points, which enables the collection of runtime data but do not alter the behavior of the system. The rst approach is to instrument the source code, which means that the original code is modied by inserting the probes, then this version is built and executed during testing. The second method is to instrument the com- piled version of the system, i.e., the bytecode. Here, two further approaches exist.
First, the probes may be inserted right after the build, which eectively produces modied versions of the bytecode les. Second, the instrumentation may take place during runtime upon loading a class for execution. In the following, we will refer to these two approaches as oine and online bytecode instrumentation, respectively.
Some example tools for the three approaches areClover2 (source code), Cobertura4
(oine bytecode) andJaCoCo1 (online bytecode).
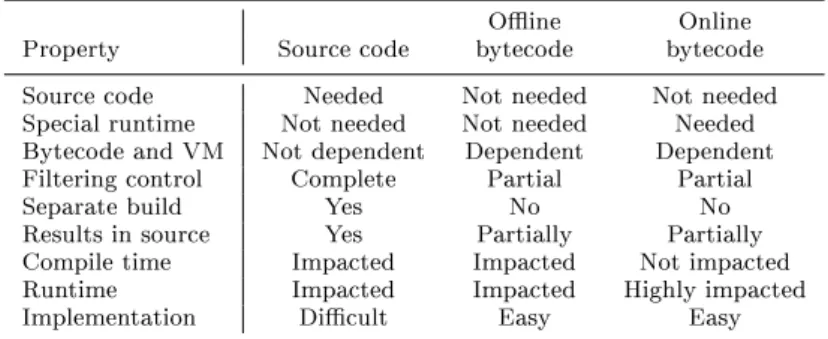
Dierent possible features are available in tools employing these approaches, and they also have various benets and drawbacks. In Table 1, we overview the most important dierences. Of course, many of these aspects depend on the ap- plication context; here, we list our subjective assessment. One benet of bytecode instrumentation is that it does not require the source code, thus it can be used e.g., on third party code as well. On the other hand, it is dependent on the bytecode version and the Java VM, thus it is not as universal as source code instrumen- tation. In turn, implementing bytecode instrumentation is usually easier than in- serting proper and syntactically correct measurement probe elements in the source code. Source code instrumentation requires a separate build for the instrumented sources, while bytecode instrumentation uses the compiled class les. However, the latter requires the modication of the VM in the online version. Source code instrumentation also allows full control over what is instrumented, while bytecode instrumentation is usually class-based (whole classes are instrumented at once).
Online bytecode instrumentation will not aect compile time, but its runtime overhead includes not only the extra code execution time, but (usually a one-time per class load) instrumentation costs too. Finally, the bytecode based results are sometimes dicult to be tracked back to source code, while source code instru- mentation results are directly assigned to the parts of the source code (Yang et al, 2009;Lingampally et al,2007).
4 http://cobertura.github.io/cobertura/
Table 1: Code Coverage Approaches for Java
Oine Online
Property Source code bytecode bytecode
Source code Needed Not needed Not needed
Special runtime Not needed Not needed Needed Bytecode and VM Not dependent Dependent Dependent Filtering control Complete Partial Partial
Separate build Yes No No
Results in source Yes Partially Partially Compile time Impacted Impacted Not impacted
Runtime Impacted Impacted Highly impacted
Implementation Dicult Easy Easy
These numerous benets of bytecode instrumentation (e.g., easier implemen- tation, no need for source code and separate build) are so attractive that tools employing this technique are far more popular than source code instrumentation- based tools (Yang et al,2009). Furthermore, most users do not take the trouble to investigate the drawbacks of this approach and the potential impact on their task at hand. Interestingly, scientic literature is also very poor in this respect, namely systematically investigating the negative eects of bytecode instrumentation on the presentation of results in source code (see Section2.4).
The important benets of source code instrumentation might overweight byte- code instrumentation in some situations, which are visible from Table1. The most important benet is that in the situations when the results are to be investigated on the source code level (in most of the cases!), mapping needs to be done from the computations made on the bytecode level. Due to the fact that perfect one-to-one mapping is generally not possible, this might impose various risks.
2.4 Related Work
There is a large body of literature on comparing various software analysis tools, for instance, code smell detection (Fontana et al,2011), static analysis (Emanuelsson and Nilsson, 2008), test automation (Raulamo-Jurvanen, 2017), just to name a few.
Most of the works that compare bytecode and source code instrumentation techniques focus on the usability, operability, and the features of certain tools, e.g., (Yang et al,2009;Lingampally et al,2007), but the accuracy of the results they provide is less often investigated despite the importance and the possible risks overviewed above.
Li and Outt (Li et al, 2013) examined the dierence between source code and bytecode instrumentation in relation to branches and statements. Their con- clusion was that due to several dierences between the two methods, source code instrumentation is more appropriate for branch coverage computation. We verify the dierences on coarser granularity (on method level), and how these dierences impact the results of the further applications of the coverage.
Kajo-Mece and Tartari (Kajo-Mece and Tartari,2012) evaluated two coverage tools (source code and bytecode instrumentation based ones) on small programs
and concluded that the source code based one was more reliable for the use in determining the quality of their tests. We also used Java source code and bytecode instrumentation tools in our experiments, but on a much bigger data set in a more comprehensive analysis.
Alemerien and Magel (Alemerien and Magel, 2014) conducted an experiment in order to investigate how the results of code coverage tools are consistent in terms of line, statement, branch, and method coverage. They compared the tools using the overall coverage as the base metric. Their ndings show that branch and method coverage metrics are signicantly dierent, but statement and line coverage metrics are only slightly dierent. They also found that program size signicantly aected the eectiveness of code coverage tools with large programs.
They did not evaluate the impact of the dierence on the applications of code coverage. We investigated only method level coverages, but we did not only use an overall coverage but analyzed detailed coverage information as well. Namely, we computed coverage information for each test case and method individually, and analyzed the dierences using this data.
Kessis et al. (Kessis et al,2005) presented a paper in which they investigated the usability of coverage analysis from the practical point of view. They con- ducted an empirical study on a large Java middleware application, and found that although some of the coverage measurement tools were not mature enough to han- dle large scale programs properly, using the adequate measurement policies would radically decrease the cost of coverage analysis, and together with dierent test techniques it could ensure a better software quality. Although we are not exam- ining the coverage tools themselves, we rely on their produced results and cannot exclude all of their individual features from the experiments.
This work is a followup of our previous work in the topic (Tengeri et al,2016), in which we investigated bytecode and source code coverage measurement on the same Java systems we used in this work. We found that there were many deviations in the raw coverage results due to the various technical and conceptual dierences of the instrumentation methods, but we did not investigate the reasons in detail and how these dierences could inuence the applications where coverage data was used.
There are many code coverage measurement tools for Java (e.g., Semantic Designs Test Coverage5, Cobertura4, EMMA6, FERRARI (Binder et al,2007), and others). In Section4.2, we discuss how we selected the tools for our measurements.
In this work, we consider test suite reduction and test prioritization, as the application of code coverage. Yoo and Harman conducted a survey (Yoo and Har- man, 2012) on dierent test suite reduction and prioritization methods among which coverage-based methods can also be found. The most basic coverage-based prioritization methods, which were studied by Rothermel et al. (Rothermel et al, 2001), are the stmt-total and stmt-addtl coverages. In our experiments, we applied these concepts on the method level, and referred to them as general, additional, and additional with resets. One of the test prioritization algorithms we used in our experiments was optimized for fault localization, which is based on the pre- vious work by Vidács et al. (Vidács et al, 2014). Fault localization aware test
5 http://www.semdesigns.com/Products/TestCoverage
6 http://emma.sourceforge.net/
suite reduction turned out to produce dierent results than fault detection aware reduction, which optimizes for code coverage.
3 Research Goals
Following earlier research on the drawbacks of bytecode instrumentation for Java code coverage on lower granularity levels (Li et al, 2013), and addressing chal- lenges listed in the previous sections, the aim of our research is the following. We investigate in quantitative and qualitative terms in what situations and to what extent Java method-level code coverage based on bytecode instrumentation is dif- ferent than coverage based on source code? We investigate the dierences between the actual coverage information on a detailed level and determine the root causes of these dierences after a manual investigation of the source code of the aected methods. In addition, we evaluate the impact of the inaccuracies on an application of code coverage measurement, namely test prioritization/reduction. We assume that a certain degree of the dierences in the coverages may be reected in a dierent degree of inaccuracies of the application.
To achieve our goal, we consider several candidate tools and then conduct an empirical study involving two representative tools, one with source code instru- mentation and one with online bytecode instrumentation. We then measure the code coverage results on a set of benchmark programs and elaborate on the possible causes and impacts.
More precisely, our research questions are:
RQ1 How big is the dierence between the code coverage obtained by an unmod- ied bytecode-instrumentation based tool and a source code-instrumentation based tool on the benchmark programs?
RQ2 What are the typical causes for the dierences?
RQ3 Can we eliminate tool-specic dierences, and if we can, how big the dier- ence, which can be possibly attributed to the dierences in the fundamental approach, that is, bytecode vs. source code instrumentation remains?
RQ4 How big is the impact of code coverage inaccuracies on the application in test prioritization/test suite reduction?
In this paper, we calculate and analyze coverage results on the method level.
More precisely, the basic element of a coverage information is whether a specic Java method is invoked by the tests or not, regardless of what statements or branches are taken in that method. At rst, this might seem too coarse a granu- larity, but we believe that the results will be actionable due to the following.
In many realistic scenarios, coverage analysis is done hierarchically starting from the higher level code components like classes and methods. If the coverage result is wrong at this level, it will be wrong at the lower levels too. Also, in the case of dierent applications, unreliable results at the method level will probably mean similar (if not worse) results at the level of statements or branches as well. Previous works have shown that notable dierences exist between the detailed results of bytecode and source code coverage measurements at statement and branch level (Li et al,2013), and that at method and branch level the overall coverage values show signicant dierences (Alemerien and Magel, 2014). So, this leaves the question whether there are notable dierences in method level coverage results as well open.
4 Description of the Experiment and Initial Measurements
To answer the research questions set forth in the previous section, we conducted an empirical study on eight open source systems (introduced in Section4.1) with code coverage tools for Java employing both instrumentation approaches. Initially, we involved more tools, but as Section4.2discusses, we continued the measurements with two representative tools. In Section4.3, we overview the measurement process and discuss some technical adjustments we performed on the tools and subjects.
Apart from the coverage measurement tools, our measurement framework con- sisted of some additional utility tools. The main tool we relied on was theSoDA7
framework (Tengeri et al, 2014). For the representation of the coverage data in
SoDA, the data generated in dierent forms by the coverage tools were converted into the common SoDArepresentation, the coverage matrix. Later, this represen- tation was used to perform the additional analyses. This framework also contains tools to calculate statistics, produce graphical results, etc.SoDAincludes the im- plementation of the test case prioritization and the test suite reduction algorithms, which we used for our Research Question 4. Apart from this, only general helping shell scripts and spreadsheet editors have been used.
4.1 Benchmark Programs
For setting up our set of benchmark programs, we followed these criteria. As we wanted to compare bytecode and source code instrumentation, the source code had to be available. Hence, we used open source projects, which also enables the repli- cation of our experiments. We used the Maven infrastructure in which the code coverage measurement tools easily integrate, so the projects needed to be com- pilable with this framework. Finally, it was important that the subject programs had a usable set of test cases of realistic size, which are based on theJUnitframe- work8(preferably version 4). The reason for the last restriction was that the use of this framework was the most straightforward for measuring per-test case method coverage.
We searched for candidate projects on GitHub9preferring those that had been used in the experiments of previous works. We ended up with eight subject pro- grams which belonged to dierent domains and were non-trivial in size (see Ta- ble2). The proportion of the tests in these systems as well as their overall coverage is varying, which makes our benchmark even more diversied. Columns All tests and Ex. tests show the size of the test suites and the number of testcases that were excluded (we discuss the technical modications that we performed in Sec- tion4.3in detail).
4.2 Selection of Coverage Tools
Our goal in this research was to compare the code coverage results produced by tools employing the two instrumentation approaches. Hence, we wanted to make
7 http://soda.sed.hu
8 http://junit.org/
9 https://github.com/
Table 2: Subject programs. Metrics were calculated from the source code (gener- ated code was excluded).
Program version LOC Methods All tests Ex. tests Domain
checkstyle 6.11.1 114K 2 655 1 589 104 static analysis
commons-lang #00fafe77 69K 2 796 3 683 358 java library
commons-math #2aa4681c 177K 7 167 5 842 902 java library
joda-time 2.9 85K 3 898 4 177 162 java library
mapdb 1.0.8 53K 1 608 1 786 68 database
netty 4.0.29 140K 8 230 4 066 247 networking
orientdb 2.0.10 229K 13 118 950 153 database
oryx 1.1.0 31K 1 562 208 0 mach. learning
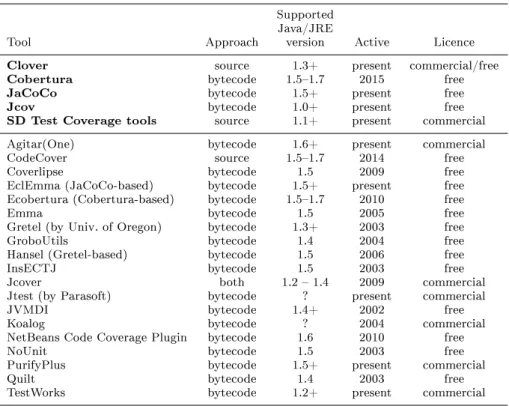
sure that the tools selected for the analysis are good representatives of the instru- mentation methods and that our results are less sensitive to tool specicities. The comprehensive list of tools we initially found as candidates for our experimentation is presented in Table3.
We ended up with this initial list after reading the related works (some of them are mentioned in Section 2), and searching for code coverage tools on the internet. We learned that the area of code coverage maeasurement for Java was most intensively investigated in the early 2000's. At that time there were several dierent tools available, but the support for most of these tools has long ended.
There were tools referred by related literature and some webpages which we could not even found, so we did not include them in the table.
In the next step, this list was reduced to ve tools, which are shown in the rst ve rows of the table and marked boldface. For making this shortlist, we established the following criteria. First, we aimed at actively developed and maintained tools that were popular among users. We measured the popularity of the tool candidates by reviewing technical papers, open source projects, and utilizing our experiences from previous projects. The tools had to handle older and current Java versions including new language constructs (support for at least Java 1.7 but preferably 1.8 was needed). Finally, we wanted the tool to easily integrate into the Maven build system10, as today this seems to be a popular build system used in many open source projects. In addition, the ability of smooth integration reduces the chances of unwanted changes in the behavior of the system and in the tests used in the experiments. Finally, among the more technical requirements for the tools was the ability to perform coverage measurement on a per test basis.
We ended up with ve tools to be used for our measurements meeting these criteria. Three of them use bytecode instrumentation, and two are based on source code instrumentation. In Section2.3, we discussed three fundamental code cover- age calculation approaches for Java. However, in the case of bytecode instrumen- tation, there are no fundamental dierences in how and which program elements are instrumented, only the timing of the instrumentation is dierent. Hence, we include source code instrumentation as one category, but we do not consider both types of bytecode instrumentation separately in the following.
In the following, we discuss briey the selected tools.
10 https://maven.apache.org/
Table 3: Tools for Java code coverage measurement
Supported Java/JRE
Tool Approach version Active Licence
Clover source 1.3+ present commercial/free
Cobertura bytecode 1.51.7 2015 free
JaCoCo bytecode 1.5+ present free
Jcov bytecode 1.0+ present free
SD Test Coverage tools source 1.1+ present commercial
Agitar(One) bytecode 1.6+ present commercial
CodeCover source 1.51.7 2014 free
Coverlipse bytecode 1.5 2009 free
EclEmma (JaCoCo-based) bytecode 1.5+ present free Ecobertura (Cobertura-based) bytecode 1.51.7 2010 free
Emma bytecode 1.5 2005 free
Gretel (by Univ. of Oregon) bytecode 1.3+ 2003 free
GroboUtils bytecode 1.4 2004 free
Hansel (Gretel-based) bytecode 1.5 2006 free
InsECTJ bytecode 1.5 2003 free
Jcover both 1.2 1.4 2009 commercial
Jtest (by Parasoft) bytecode ? present commercial
JVMDI bytecode 1.4+ 2002 free
Koalog bytecode ? 2004 commercial
NetBeans Code Coverage Plugin bytecode 1.6 2010 free
NoUnit bytecode 1.5 2003 free
PurifyPlus bytecode 1.5+ present commercial
Quilt bytecode 1.4 2003 free
TestWorks bytecode 1.2+ present commercial
4.2.1 Source code-based instrumentation tools
As mentioned earlier, there are comparably much less coverage tools employing this method. Essentially, we could nd only two active tools that are mature enough and meet our other criteria to serve the purposes of our experiment. The tools selected for the source code instrumentation approach wereClover by Attlassian2 (version 4.0.6), andTest Coverage11by Semantic Designs (version 1.1.32).
Clover is the product of Atlassian, and it was a commerical product for a long time but, recently, it became open source. It handles Java 8 constructs, easily integrates with the Maven build system, and can measure per-test coverage.
Test Coverage is a commercial coverage tool from Semantic Designs. Native, it works on Windows, handles most Java 8 code and can be integrated into the Maven build process as an external tool. Per-test coverage measurement is not feasible by this tool, because it could only be solved by the individual execution of test cases.
We performed some initial experiments to compare these two tools. The details and results of this investigation can be found in AppendixA. Results showed that there were only minimal dierences in the outputs produced by the two tools, their accuracy is almost the same.
Finally, we choseClover to be used in our detailed bytecode-source code mea- surements because it has better Maven and per-test coverage measurement sup-
11 http://www.semdesigns.com/Products/TestCoverage/JavaTestCoverage.html
port, which made it easier to integrate it into our experiments. Also,Test Coverage
had diculties in handling some parts of our code base, which would have required their exclusion from the experimentaion.
To be able to use the source code instrumentation results as the baseline in our experiments, we did a manual verication of the results of Clover by performing a selective manual instrumentation. A subset of the methods was selected for each of our subject systems, up to 300 methods per system. Then, we manually instrumented these methods and ran the test suite. We interpreted the results in terms of actual test executions and program behavior on the level of source code. When the results were checked, we found no deviations between the covered methods reported by the manual instrumentation and by Clover. Thus, we treat
Clover as a ground truth for source code coverage measurement from this point onward.
4.2.2 Bytecode-based instrumentation tools
We found three candidate tools in this category that met the mentioned criteria:
JaCoCo1(version 0.7.5.201505241946),Cobertura4(version 2.1.1) andJCov12(version c7a7c279c3a6). Contrary to the two previous ones, all three tools in this category are open source. We performed similar experiments to compare the results of these three tools, and investigated their dierences. These experiments and the results are detailed in Appendix B. Our conclusion was that the main cause of the dif- ferences was mostly due to the slightly dierent handling of compiler generated methods in the bytecode by the three tools (such as for nested classes). Since the quantitative dierences were at most 4% and they were concerned mostly gener- ated methods, which are less important for code coverage analysis, we concluded that one representative tool of the three should be sucient for further experi- ments.
We ended up usingJaCoCo1 for the bytecode instrumentation approach thanks to its popularity and slightly higher visibility and easier integration for use in our experiments than the other two. This is a free Java code coverage library devel- oped by the EclEmma team, which can easily be integrated into a Maven-based build system. JaCoCo has plug-ins for most of the popular IDEs i.e., Eclipse13, NetBeans14, IntelliJ15, for CI- and build systems e.g., Jenkins16, Maven10, Gra- dle17and also for quality assessment tools e.g., SonarQube3. These plug-ins have about 20k installations/downloads per month in total. In addition, several popu- lar projects, e.g., Eclipse Collections18, Spring Framework19, and Checkstyle20are utilizingJaCoCoactively.JaCoCohas up-to-date releases and an active community.
12 https://wiki.openjdk.java.net/display/CodeTools/jcov/
13 https://www.eclipse.org/
14 https://netbeans.org/
15 https://www.jetbrains.com/idea/
16 https://jenkins.io/
17 https://gradle.org/
18 https://www.eclipse.org/collections/
19 http://projects.spring.io/spring-framework/
20 http://checkstyle.sourceforge.net/
4.3 Measurement Process
In order to be able to compare the code coverage results and investigate the dif- ferences in detail, we had to calculate the coverages with the dierent settings and variations of the tools. In particular, we wanted the data from the two tools to be comparable to each other, and we wanted to eliminate tool-specic dier- ences. Hence, we essentially calculated dierent sets of coverage data, which we will denote byJaCoCoglob,JaCoCo,JaCoCosync,Cloverglob,Clover, andCloversync, with explanations following shortly.
The experiment itself was conducted as follows. First, we modied the build and test systems of each subject program to integrate the necessary tasks for collecting the coverage data using the two coverage tools. This task included a small modication to ignore the test failures of a module that would normally prevent the compilation of the dependent modules and the whole project. This was necessary when some tests of the project failed on the measured version, and in a few cases when the instrumentation itself caused some tests to fail. Furthermore, to avoid any bias induced by random tests, we executed each test case three times and excluded from further analysis the ones that did not yield the same coverage consistently every time. Eventually, we managed to arrive at a set of ltered test cases that was common for both tools. Column Excluded tests of Table2 gives the number of excluded tests for each subject.
Since we planned a detailed study on the dierences between the tools, we wanted to make sure that we could gather per-test case and per-method coverage results from the tools as well (i.e., which test cases covered each method and the opposite).Clover could be easily integrated in the Maven build process and there were no problems in producing the per-test case coverage information we needed.
JaCoCo measurements could also be integrated into a Maven-based build system, but originally it could not perform coverage measurements for individual test cases.
So, to be able to gather the per-test case coverage information, we implemented a special listener at rst. Then, we congured the test execution environment of each program to communicate with this listener. As a result, we were able to detect the start and the end of the execution of a test case (tools and examples are available at21). From the per-test case coverage, we then produced a coverage matrix for each program, which is essentially a binary matrix with test cases in its rows, methods in the columns and 1s in the cells if the given method is reached when executing the given test case. From this matrix, we could easily compute dierent kinds of coverage statistics including per-test case and per-method coverage.
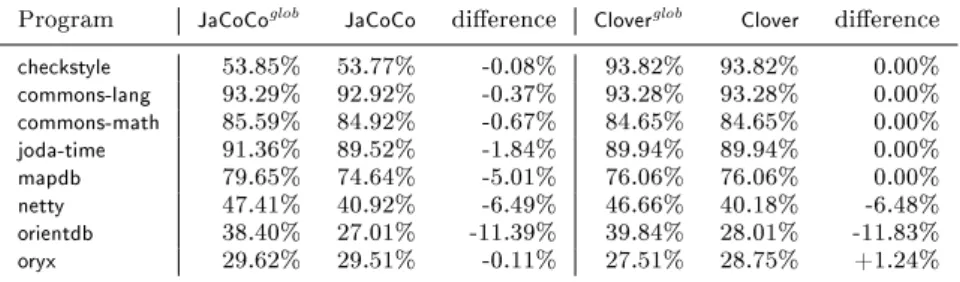
Due to the mentioned extension of the JaCoCo measurements, we essentially started with two dierent kinds of JaCoCo results: the original one without test case separation, which we will denote byJaCoCoglob, and the one with the special listener denoted byJaCoCo. Theoretically, there should be no dierences between the two types of measurements, but since we noticed some, we investigated their amount and causes. Table4shows the two overall coverage values for each program in columns two and three, with the dierences shown in the fourth column. It can be observed that JaCoCoresults are always somewhat smaller than theJaCoCoglob
measurements. The dierence is caused by executing and covering some general utility functions (such as the preparation of the test execution) in the unseparated
21 https://github.com/sed-szeged/soda-jacoco-maven-plugin
version during the overall testing, but these cannot be associated to any of the test cases. Since these methods have no covering test cases assigned, when we summarize the coverage of all test cases, the methods remain uncovered. Note, that Clover does not suer from this issue as it originally produces per-test case results.
Table 4: Eect of technical setup on overall coverage values.
Program JaCoCoglob JaCoCo dierence Cloverglob Clover dierence
checkstyle 53.85% 53.77% -0.08% 93.82% 93.82% 0.00%
commons-lang 93.29% 92.92% -0.37% 93.28% 93.28% 0.00%
commons-math 85.59% 84.92% -0.67% 84.65% 84.65% 0.00%
joda-time 91.36% 89.52% -1.84% 89.94% 89.94% 0.00%
mapdb 79.65% 74.64% -5.01% 76.06% 76.06% 0.00%
netty 47.41% 40.92% -6.49% 46.66% 40.18% -6.48%
orientdb 38.40% 27.01% -11.39% 39.84% 28.01% -11.83%
oryx 29.62% 29.51% -0.11% 27.51% 28.75% +1.24%
Another technicality with the Clover tool had to be addressed before moving to the experiments themselves. Namely, for handling multiple modules in projects we had two choices with this tool: either to integrate the measurement on a global level for the whole project, or to integrate it individually in the separate sub- modules (this conguration can be performed in the Maven build system). Since
JaCoCofollows the second approach, we decided to congureCloverindividually for the sub-modules as well. These measurements will be denoted simply by Clover, and will be used subsequently.
Three of the eight subject systems (netty, orientdbandoryx) include more than one sub-module, so this decision aected the measurement in these systems. To assess how such a handling of sub-modules diers from the other approach, we performed global measurements as well (denoted byCloverglob), whose results can be seen in the last three columns of Table 4. Cloverglob measurements typically include a smaller number of covered elements than Clover, but it may happen that the coverage itself is bigger, which is due to the dierent number of overall recognized methods. We will elaborate on the dierences caused by sub-module handling in detail in Section5.2.
5 Results
The experiment results presented in this section follow our RQs from Section3. As discussed in Sections2.3and4.2, we treat source code-based instrumentation as more suitable for source code applications andCloverresults as the ground truth, henceJaCoCoresults will be compared to Clover, serving as the reference.
5.1 Dierences in Unmodied Coverage Values RQ1
Our rst research question dealt with the amount of dierences we can observe in the overall coverage values calculated by the two tools. In this phase, we wanted
to compare the raw, unmodied data from the tools o the shelf, because this could reect the situations users would experience in reality as well. However, as explained in Section4.3, we needed to perform a modication of the tool execution environment to enable per-test case measurements, which caused slight changes in the overall coverages. In this section, we rely on this modied set of measurements, which is denoted simply byJaCoCoandClover.
5.1.1 Total coverage
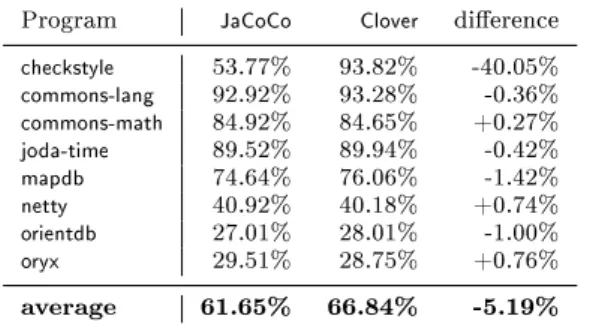
First, we compared the overall method-level coverage values obtained for our sub- ject programs, which are shown in Table 5. JaCoCo and Clover results are shown for each program, along with the dierence of the coverage percentages. Coverage ratios are given in percentages of the number of covered methods from all methods recognized by the corresponding tool.
Table 5: Overall coverage values for the unmodied tools
Program JaCoCo Clover dierence
checkstyle 53.77% 93.82% -40.05%
commons-lang 92.92% 93.28% -0.36%
commons-math 84.92% 84.65% +0.27%
joda-time 89.52% 89.94% -0.42%
mapdb 74.64% 76.06% -1.42%
netty 40.92% 40.18% +0.74%
orientdb 27.01% 28.01% -1.00%
oryx 29.51% 28.75% +0.76%
average 61.65% 66.84% -5.19%
Excluding the outlier programcheckstyle, the dierences between the tools range in a relatively small interval, from -1.42% to 0.76%. In the following sections, we seek for the reasons of the dierences, and we will explain the outlier as well (in Section5.2.4).
5.1.2 Per-test case coverage
While Table 5 presents the overall coverage values produced by the whole test suite, the coverage ratios attained by the individual test cases might show another range of specic dierences. Table 6acontains statistics about the coverages for the individual test cases forJaCoCo, and Table6b shows similar results forClover. (Coverage is again the number of covered methods relative to all methods). This includes minimum, maximum, median, and average values with standard devia- tion. In Table 6c the dierence in the average values between the two tools is shown (positive values denote bigger average coverage values forClover). It can be observed that checkstyle reects the high global dierence of Clover and JaCoCoin the per-test case results too, although not as emphasized as in the global case.
Interestingly, in the case ofmapdb,netty, andoryxthe average individual dierences betweenClover andJaCoCohave the opposite sign than the global dierences.
Table 6: Per-test case coverages
(a) JaCoCo results
Program min max med avg dev
checkstyle 0.00% 15.87% 4.11% 3.02% 2.36%
commons-lang 0.00% 3.10% 0.20% 0.61% 0.74%
commons-math 0.00% 4.34% 0.26% 0.47% 0.54%
joda-time 0.00% 8.84% 1.24% 1.62% 1.37%
mapdb 0.00% 20.86% 6.28% 7.67% 5.39%
netty 0.00% 3.43% 0.24% 0.32% 0.29%
orientdb 0.00% 9.40% 0.22% 0.58% 1.20%
oryx 0.00% 2.05% 0.33% 0.45% 0.40%
(b) Clover results
Program min max med avg dev
checkstyle 0.00% 30.13% 6.21% 4.66% 3.65%
commons-lang 0.00% 2.93% 0.21% 0.64% 0.76%
commons-math 0.00% 4.34% 0.25% 0.47% 0.55%
joda-time 0.00% 9.93% 1.23% 1.64% 1.39%
mapdb 0.00% 22.08% 6.09% 7.19% 6.08%
netty 0.00% 3.69% 0.26% 0.37% 0.33%
orientdb 0.00% 9.88% 0.24% 0.62% 1.28%
oryx 0.00% 1.79% 0.38% 0.48% 0.40%
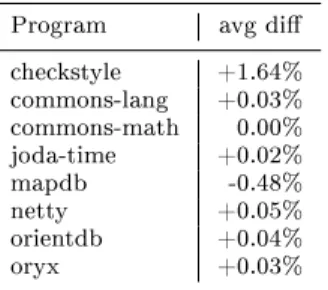
(c) JaCoCo to Clover average dierence
Program avg di
checkstyle +1.64%
commons-lang +0.03%
commons-math 0.00%
joda-time +0.02%
mapdb -0.48%
netty +0.05%
orientdb +0.04%
oryx +0.03%
Note, that it is not obvious how individual coverage dierences imply global coverage dierence and vice versa. It might happen that individual coverages dier greatly but the overall coverage is not changed. For example, one test case is enough for a method to be reported as covered, and if one instrumentation technique reports a hundred covering test cases while the other technique reports only one, the global coverage will not change only the individual ones. Similarly, low average individual dierences might result in a high global dierence; if many test cases have only one method which is reported dierently, and these methods are uniquely covered by those test cases, the small individual dierences will sum up in a high global coverage dierence.
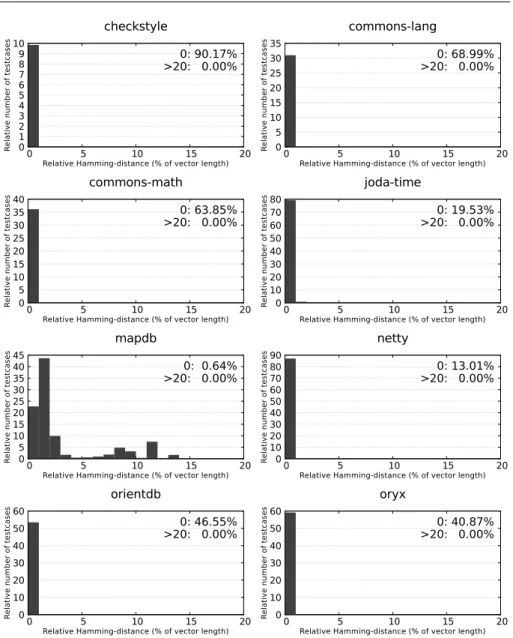
An even more detailed way to compare the per-test case coverages is inves- tigating not only the overall coverage ratios but the whole coverage vector (it is the row vector of binary values from the coverage matrix for the corresponding test case). Figure1shows the analysis of the dierence between the corresponding
coverage vectors produced by the two tools. The dierence was computed as the Hamming distance normalized to the vector lengths. Note, that the two tools may recognize a dierent number of methods (more on this in the next section), so in these cases the vectors were padded with no-coverage marks for the missing methods. Then, the distribution of the obtained dierences was calculated and shown as a histogram. The X axis of the graphs shows the ranges of dierences (size ranges are 1%) and the Y axis the number of cases (relative to all cases) for the given dierence range. As expected, a lot of small dierences occurred. In particular, a signicant portion of the vectors had 0 dierence. On the other end, none of the programs had vectors with Hamming distance values larger than 20%.
Hence, to ease readability, we omit the values that were 0 or larger than 20% from the diagrams and show the corresponding numbers instead in the top right corner of the graphs.
There are two interesting results here. The Hamming distances ofmapdbhave a dierent distribution than that of the other programs (the dierences go up to 14%
with this program), and not surprisingly, it is also reected in the higher average per-test case dierences. This shows that while dierences would occur in either direction, in most of the cases the JaCoCo coverage turns out to be higher than theClover result (in contrast to the others, where on averageClover reports higher coverage). The second interesting observation is thatcheckstyle behaves dierently than the other programs: the high average per-test case dierence measured for this program (1.64%) is not observable from the Hamming distances (more than 90% of the test cases show no dierence and the others are below 1%). This seems to be inconsistent at the rst sight. However, as we will explain it in Section5.2.4,
checkstyleshows a signicant dierence in the number of methods detected by the two instrumentation techniques. Thus, the average coverage values forJaCoCoand
Clover used signicantly dierent denominators, while during Hamming distance computation a common denominator was used and this caused the observed dif- ference.
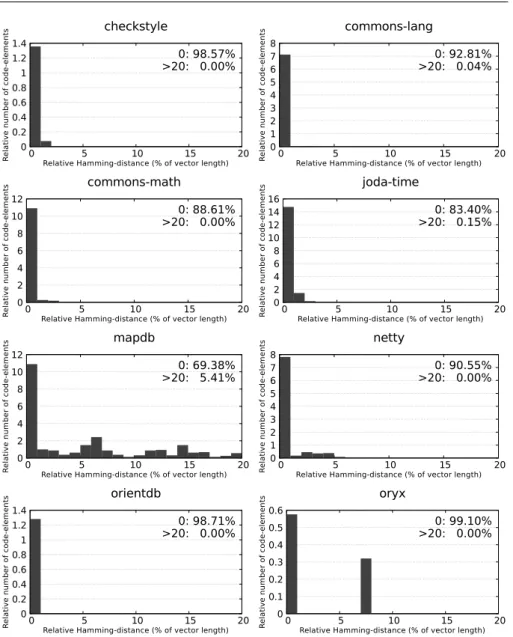
5.1.3 Per-method coverage
In the previous experiment, we investigated the coverage from the test case di- mension. In the next one, we did the same from the method dimension. The distributions of the Hamming distances were calculated similarly to the per-test case analysis. The results in Figure2show a similar overall picture to the per test- case analysis. Therefore, we used the same method to exclude and emphasize the dierences larger than 20% or equal to 0. The distribution of the distances and the average per-test case coverage values seem to be unrelated. However, check- styleandmapdbbehave dierently than the other programs in this case, too. The high average per-test case dierence measured forcheckstyleis not observable from the Hamming distances, while the high distances in the case ofmapdb result in a relatively high average dierence.
In this case, we performed another, slightly dierent analysis. For each method, we recorded how many of the test cases cover that method according to the two tools. Then, we counted the number of the methods for which the number of the covering test cases was equal, and how many times one or the other tool reported this dierently. This kind of analysis is useful because it helps to nd out the
0 1 2 3 4 5 6 7 8 9 10
0 5 10 15 20
Relative number of testcases
Relative Hamming-distance (% of vector length)
checkstyle
0: 90.17%
>20: 0.00%
0 5 10 15 20 25 30 35
0 5 10 15 20
Relative number of testcases
Relative Hamming-distance (% of vector length)
commons-lang
0: 68.99%
>20: 0.00%
0 5 10 15 20 25 30 35 40
0 5 10 15 20
Relative number of testcases
Relative Hamming-distance (% of vector length)
commons-math
0: 63.85%
>20: 0.00%
0 10 20 30 40 50 60 70 80
0 5 10 15 20
Relative number of testcases
Relative Hamming-distance (% of vector length)
joda-time
0: 19.53%
>20: 0.00%
0 5 10 15 20 25 30 35 40 45
0 5 10 15 20
Relative number of testcases
Relative Hamming-distance (% of vector length)
mapdb
0: 0.64%
>20: 0.00%
0 10 20 30 40 50 60 70 80 90
0 5 10 15 20
Relative number of testcases
Relative Hamming-distance (% of vector length)
netty
0: 13.01%
>20: 0.00%
0 10 20 30 40 50 60
0 5 10 15 20
Relative number of testcases
Relative Hamming-distance (% of vector length)
orientdb
0: 46.55%
>20: 0.00%
0 10 20 30 40 50 60
0 5 10 15 20
Relative number of testcases
Relative Hamming-distance (% of vector length)
oryx
0: 40.87%
>20: 0.00%
Fig. 1: Relative Hamming distances of test case vectors (JaCoCovs.Clover)
number of situations when the methods are found falsely (not) covered, which may lead to confusion in certain applications.
When we compared the number of covering test cases, we identied three kinds of dierences. First,JaCoCo andClover recognized dierent sets of methods, for which the reasons will be explained in Section5.2.4. Second, for some of the methods recognized by both approaches,Cloverreported at least one covering test case butJaCoCodid not, and vice versa. The third kind of dierence is when both tools reported that a method was covered, but by a dierent number of test cases.
Figure3shows the associated results. In particular, the percentage of the methods