The Application of Accelerated Life Testing Method for Micro Switches
VIVIEN SIPKÁS, GABRIELLA BOGNÁR University of Miskolc
Institute of Machine and Product Design H-3515 Miskolc - Egyetemváros
HUNGARY machsv@uni-miskolc.hu
Abstract: -The estimation of product reliability has attracted wordwile attention during the past decades. The estimation produce usually begins with parameter estimation based on test date.The aim of this paper is to introduce the Accelerated Life Testing (ALT) method for the testing of micro switches. The analysis aims to take many effecting factors into account, to provide statistical assurance of the reliability and to give statistically reliable lifetime data in brief time. The Weibull distribution is applied for the investigation of the failure rate in the product’s ‘bathtube’ lifetime curve.Weibull distribution capable of modelling bathtub shaped hazard rate function is defined. The importance of this distribution lies in its ability to model monotone as well as non-monotone failure rates, which are quite common in lifetime problems and reliability [10]. The most common failures of the micro switches have been collected, which are essential for testing and understanding the design of test equipment. It is necessary to learn more about the probability and frequency of these failures.
Key-Words: - Weibull-distribution, lifetime, Accelerated Life Testing, micro switches, ‘bathtube’ curve, failures, reliability
1 Introduction
The lifetime analysis includes technological examinations of different areas of material abrasion testing and wear testing as the end result of the test can only be answered at the end of the actual lifetime of a continuous tracking/curing for a given product. At the same time, we can perform tests based on a principle with special requirement, for example with higher load in systematic test environment. The advantage of the accelerated life experiment is that statistically reliable lifetime data can be obtained in a relatively short test period. The common feature of this test method is that we investigate the factor that determines lifetime, such as elevated frequency of use, speed change, load level rise and special environmental effects like heat or humidity. Accelerated Life Testing (ALT) uses the Weibull distribution introduced by Waloddi Weibull in 1951 [5,6]. This analysis is based on a probability theory in which a continuous probability distribution is examined. In analysing the failure of the micro switches to be tested, we investigate the effect of various failure processes on the life of the switches by overviewing the results of the test series using the mentioned distribution function [1,7-12].
The Weibull distribution, having exponential and Rayleigh as special cases, is a very popular method
An example of bathtub-shaped failure rate is the human mortality experience with high infant mortality rate which reduced rapidly to reach a low.
It then remains at that level for quite a few years before picking up again. The models that presented bathtub-shaped failure rate are very useful in survival analysis. In recent years new classes of distributions were proposed based on modifications of the Weibull distribution to cope with bathtube – shaped failure rate. Among these, the exponentiated Weibull distribution introduced by Mudholkar et al.
(1995, 1996) the additive Weibull distribution (Xie and Lai, 1995), the extended Weibull distribution presented by Xie et al. (2002), the modified Weibull distribution proposed by Lai et al. (2003) [10].Our aim is to analyze the Weibull distribution density function, failure rate function and time-diagram of the load to determine the failure rate of the micro switches in garden tools. It is intended to subject the above switches to complex stresses such as temperature fluctuations, frequency of switching, high humidity and other mechanical and electrical stresses. This article prepares the planning and design of a test equipment and the literature research of mathematical methods. Furthermore, the goal is to collect typical and most common malfunctioning methods of the product on the base of previous test
2 Failure of micro switches
Micro switches open and close contacts of the electrical circuit during operation. While in use the switches have to perform a large number of interruptions and closing cycles, so their life is influenced and determined by the material migration and wear of the contact surfaces. In recent years, the switches have undergone extensive miniaturization.
Their reliability has greatly increased, adapting the long life services of active and passive parts. One switch must provide up to 104 – 106 error-free switches. An arc may be formed while closing and interrupting the circuit and this affecting the size and the usability and the lifetime of the contacts as well [2,3,9]. Micro switches have a number of malfunctions, some of which showing typical failures. In case of an electrical garden tool a micro switch must have a 50·103 switch according to the relevant standard and 6·103 switching cycles for battery powered machines must be able to complete without problem.
One of the most common problems of a micro switch is the deformation due to high temperature.
There are several reasons for this problem, e.g., overheats due to overload and over switching.
When the circuit is closed and interrupted, an arc is created. The materials migration is the consequence of this phenomena, due to the heat generation and the increase of the temporary resistance. It results the overheating of the pre-assembled components such as springs.
A further breakdown when the current flow through the switch is greater than the allowed value, or in case of short circuit, the leaf spring can deform, losing its elasticity and ceasing its original function.
Therefore, the machine cannot be switched off or switched on. There may be a loss of material caused by a static discharge through the contacts. Due to electrical, thermal and mechanical stresses, the contact can break over a certain number of switches due to clamping.
Another typical failure problem is the wear of the micro switch’s switch-button, which could be the result of poor construction design, inadequate choice of parts, manufacturing defects, but also of the lateral compression loads in operation and high switching numbers. As a result of all these failures, the component may be damaged and broken.
3. The ‘bathtube’ curve
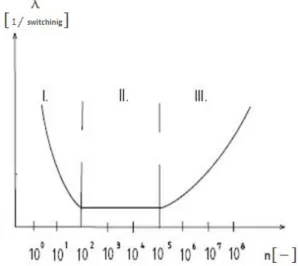
The shape of the characteristic cure representing the frequency of the failure as a time parameter called
‘bathtube’ characteristic curve. This curve shape contains many information.
In the field of biology there are similar features:
infant mortality, normal mortality rate of adults due to accidents and infections, and the death of the elders. The ‘bathtube’ curve illustrated in Fig. 1. is related to the relay contactor versus the characteristic influencing factor of its failure rate [5,6].
Figure 1. The ‘bathtube’ Curve
4. The Weibull distribution
The Weibull distribution is introduced by a Swedish engineer Waloddi Weibull (1887-1979) in the 1940s in connection with material misery related issues.
The time-dependent failure rate is approached by a power function. This allows a distribution that can be used for testing the full life expectancy. The exponential distribution is a special case of the of the Weibull distribution in the early phase of failure.
With the general three-parameter form of the Weibull distribution, the distribution function can be formulated as follows [4,5]:
𝐹𝐹(𝑡𝑡) =�1− 𝑒𝑒𝑥𝑥𝑥𝑥 �−(𝑡𝑡 − 𝛾𝛾) 𝛼𝛼
𝛽𝛽
�,𝑖𝑖𝑓𝑓 𝑡𝑡 ≥ 𝛾𝛾, 0 ,𝑖𝑖𝑓𝑓 𝑡𝑡<𝛾𝛾.
(1)
Function F(t) gives the failure probability during the actual operating time. In formula (1) the statistical variable is time t in hours or number of operations;
α> 0 is the scalar parameter, β> 0 is the shape parameter, γ≥0 is the location parameter.
The characteristic lifetime is 𝜂𝜂. Let us introduce the substitution 𝜂𝜂 =𝛼𝛼1/𝛽𝛽 in expression (1). Thus, the distribution function can be rewritten as follows.
𝐹𝐹(𝑡𝑡) =�1− 𝑒𝑒𝑥𝑥𝑥𝑥 �− �𝑡𝑡 − 𝛾𝛾 𝜂𝜂 �
𝛽𝛽�,𝑖𝑖𝑓𝑓 𝑡𝑡 ≥ 𝛾𝛾, 0, 𝑖𝑖𝑓𝑓 𝑡𝑡<𝛾𝛾.
(1𝑎𝑎)
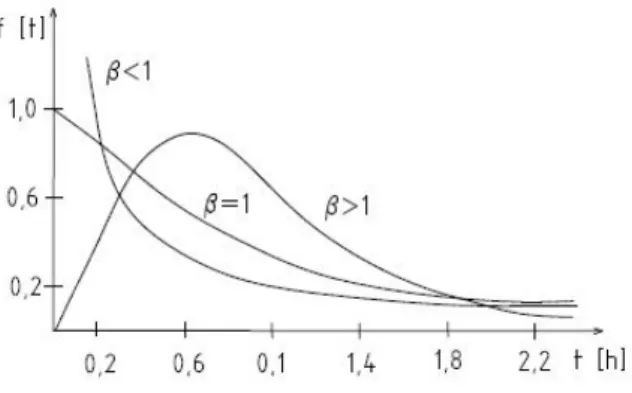
The position parameter γ is equal to 0 only for a few practical applications, but the sampling plans are designed for case γ = 0. The shape parameter β determines the figure of the density function. The density function f(t) of the Weibull distribution when γ = 0 can be determined by differentiation from formula (1a) (see Fig. 2):
𝑓𝑓(𝑡𝑡) =𝐹𝐹′(𝑡𝑡)
=� 𝛽𝛽
𝜂𝜂 � 𝑡𝑡 𝜂𝜂�
𝛽𝛽−1 𝑒𝑒𝑥𝑥𝑥𝑥 �− �𝑡𝑡 𝜂𝜂�
𝛽𝛽�,𝑖𝑖𝑓𝑓 𝑡𝑡 ≥0, 0, 𝑖𝑖𝑓𝑓 𝑡𝑡< 0. (2)
If β<1, then f (t) is a monotone decreasing function, this is the phase of early failures.
If β=1, then we get the exponential distribution, which is the phase of random failures.
If β>1, then density function has a maximum, this characterize the phase-related failure phase.
Figure 2. The density function of the Weibull distribution
For Weibull distribution, the failure rate as a function of time for the case of γ = 0 can be obtained as:
𝜆𝜆= 𝑓𝑓(𝑡𝑡)
1− 𝐹𝐹(𝑡𝑡) =�𝛽𝛽 𝜂𝜂 �
𝑡𝑡 𝜂𝜂�
𝛽𝛽−1,𝑖𝑖𝑓𝑓 𝑡𝑡 ≥0
0, 𝑖𝑖𝑓𝑓 𝑡𝑡< 0. (3)
In the case of the Weibull distribution, the expected actual operation belongs to γ = 0. If β < 1, then λ (t) is monotone decreasing. If β = 1, then λ (t) is constant, this is the case of exponential distribution.
But, if β > 1 then λ (t) is monotone increasing function (see Fig. 3). For the Weibull distribution, the expected actual operation for γ = 0 can be written as follows [4,5]:
µ= 𝐸𝐸(𝜏𝜏) =� 𝑡𝑡𝑓𝑓(𝑡𝑡)∞
0 𝑑𝑑𝑡𝑡
=� 𝑡𝑡𝛽𝛽 𝜂𝜂
∞ 0 �𝑡𝑡
𝜂𝜂�
𝛽𝛽−1𝑒𝑒𝑥𝑥𝑥𝑥 �− �𝑡𝑡 𝜂𝜂�
𝛽𝛽� 𝑑𝑑𝑡𝑡
=𝜂𝜂Γ �1 +1
𝛽𝛽� =𝛼𝛼12Γ �1 +1 𝛽𝛽�.
Based on the figure, one can find the following failure modes:
4.1. Early failures
In the early failure phase, the defective failure rate decreases over time (𝛽𝛽 < 1). For technical products, it would be ideal if the end of the early failure phase coincided in time with the completion of the manufacturing inspection.
4.2. Random failures
In the case of accidental malfunctions, the failure rate is independent of time (constant). The exponent is equal to unit value in the Weibull distribution (𝛽𝛽 = 1).
4.3 Usage Failures
At this stage of the curve, the failure rate increases over time. In this time period, more frequent failures are characterized due to wear and tear (3), in this case the exponent of the Weibull distribution is (𝛽𝛽 > 1). As the failures at this stage are becoming more common, therefore in this period parts subject to wear should be renewed [6].
5. Sampling produces
Sampling procedures can be divided into two groups: a procedure for verifying the requirement of the failure rate and for verifying the requirement for expected actual operation. If 𝛽𝛽 is unknown, the steps of the sampling procedure are the same.
i, Select n element of from the sample.
ii, Examine the actual operation for implemented time on the sample. If applicable, the test is performed not only in time, but it can be defined differently for example with switching cycles.
iii, Observe the number of failures for a given time [4].
iv, The item is taken over, if r ≤ c, where c is a predetermined receipt number, and the item is rejected if r >c.
6. Determination of failure rate
One of the most important parameters for defining the quality of life is the failure rate λ.
The characteristic lifetime η of the Weibull distribution between 1 and 2,5 is nearly equal to m for values β.
Each component is specified by a value λ derived from the defective mechanism. The value λ can be used to determine the following equation:
𝜆𝜆 ≈ 𝑐𝑐
𝑁𝑁 Δ𝑡𝑡, (5)
where c denotes the number of errors leading to failure, Δ𝑡𝑡 is the test time, N is the test size.
Malfunctions should only be considered for failure at nominal loads, and not for failures resulting from increased electrical, thermal, mechanical or chemical stresses [6].
7. Accelerated tests
In order to determine the failure rate, a particular component group must be loaded at nominal boundary data loads, and it is necessary to wait for failures. Such test requirements are unsuitable for production control. Therefore, the demand is to shorten the test time by increasing the loads. In this regard, the following questions arise:
- What acceleration methods can be performed?
- What is the increased use of the part allowed?
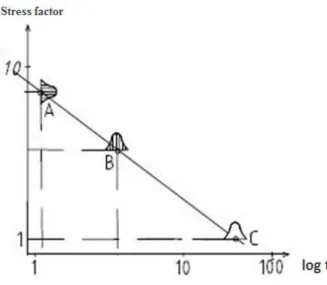
Figure 4. shows that in case of accelerated testing (point A) the test time is constant, and the load is changed in degrees. Then, failures are counted and classified into classes, segregated and recorded. For persistent tests (point B), the load is constant.
Failures are counted in subsequent periods and the number of the failures is recorded in a histogram, and then the resulting data is converted to operational applications (point C). At this point there is small stress but a long test time [6].
In this paper the application of the accelerated life testing method is considered for micro switches, which are applied in several machines and devices.
The determination of the failure modes and the effecting factors on the failure are investigated. For the characterization of the failure and the expected operation, the Weibull distribution has been applied.
Figure 4. Stress factor diagram
Summary
After studying the mathematical model of the accelerated testing and Weibull distribution, the next task of the research is to design and compile a workbench suitable for testing of micro switches, and then to define measurement parameters, followed by testing, evaluating and collecting data.
The further aim is to provide a detailed numerical analysis of the accelerated lifetime on the base of experimental data.
Acknowledgments
The research work described in this article is the Innovative Knowledge Center of the Youth and Renewal University, EFOP-3.6.1-16-2016-00011, the Institutional Development of Intelligent Specialization at the University of Miskolc as part of the Széchenyi 2020 project, with the support of the European Union, co-funded by the European Social Fund.
References:
[1] Tibor Gregász, Nemfémes szerkezeti anyagok élettartam-problémáinak minőségügyi megközelítése, PhD thesis, 2009, NYME-Sopron (in Hungarian)
[2] Pál Lautner, Mikrokapcsolók (Kontakta), Híradástechnika Vol. XXXIV, 1983, l No 5. pp 237-239. (in Hungarian)
[3] Imre Mojzes, Mikroelekronika és technológia, Publish Műegyetem, Budapest, 2005, ISBN 963 420 8479. (in Hungarian)
[4] Albert Balogh, Ferenc Dukáti, Megbízhatósági vizsgálatok Weibull-eloszláson alapuló mintavételi eljárásai és tervei, Híradástechnika No. XXX/1. pp 1-8. (in Hungarian)
[5] Albert Balogh, Ferenc Dukáti, László Sallay, Minőségellenőrzés és megbízhatóság, Publish Műszaki, Budapest, 1980, ISBN 0-262-04219-3.
(in Hungarian)
[6] Eugen Schaefer, Zuverlassigkeit, Verfügbarkeit und Sicherheit in der Elektronik, Publish Műszaki, Budapest, 1983, ISBN 963 10 49434.
[7] Sarath Jayatilleka, Geoffrey Okogbaa, Accelerated Life Testing, 2014 Workshop on Accelerated Stress Testing and Reliability Conference, Saint Paul, Minnesota 55101, USA, pp 1-21.
[8] Imre Jánok, Pn2 és Pm2 típusú mikrokapcsolók végminősítő eljárása, PhD thesis, 1984, Budapest, (in Hungarian)
[9] http://www.asqrd.org/wp-
content/uploads/2014/09/Accelerated-Life-Test- Tool-for-Speedier-Produdct-Development.pdf (downloaded 10.10.2017)
[10] Jalmar M.F. Carrasco, Edwin M.M. Ortega, Gauss M. Cordeiro, A generalized modified Weibull distribution for lifetime modelling, Computational Statistics and Data Analysis 53 (2008), pp.450-462.
[11] A.L. Hartzell, MEMS Reliability, MEMS Reference Shelf, Lifetime Prediction, DOI 10.1007/978-1-4419-6018-4_2, Springer Science + Business Media, LLC 2011, pp 9-42.
[12] Ping Jiang, Jae-Hak Lim, Ming J. Zuo, Bo Guo, Reliablity Estimation in Weibull Lifetime Distribution with Zero - Failure Field Data, Quality and Reliability Engineering International, 2010, DOI: 10.1002 qre.1138, pp.
691-701.