Application of General Tool-life Function under Changing Cutting Conditions
János Kundrák, Zoltán Pálmai
Department of Production Engineering, University of Miskolc Egyetemváros, H-3515 Miskolc, Hungary
janos.kundrak@uni-miskolc.hu; gepgyartas@uni-miskolc.hu
Abstract: The traditional Taylor formula T=f(vc) gives tool life of the cutting tool T as a function of the cutting speed at constant speeds in which the higher the speed, the lower the tool life. However, in a wider technological range, the function T=f(vc) has extreme values as well, which can be described by the general tool-life function. Frequently the tool is used until full wear of the edge at changing or alternating speeds, for which the general tool-life function can be extended. By using this extension, the general tool-life equation can be defined even under manufacturing conditions. Its applicability is demonstrated for examples of taper-turning and cutting optimisation.
Keywords: hard turning; tool life; economical cutting
1 Introduction
Several characteristics of machining are known, such as the surface quality of the workpiece, the shape of the chip, etc., and undoubtedly a great deal of attention is paid to tool life. Most often it is calculated by the well-known Taylor formula [1]
1 k
c v
v T C (1)
where vc is cutting speed and T is tool life, while –k and Cv are constants that are functions of the cutting conditions. Such conditions include the characteristics of the workpiece and the tool, the tool geometry and the cutting parameters (feed, depth of cut). On the basis of the Taylor formula several new research results have been obtained, such as the study by El Baradie [2] examining how the workpiece diameter influences the tool edge, or the examinations by Arsecuralante et al., who measured the volume of the material removed till the wear off of the tool edge [3], and who explained the tool wear by thematically activated processes [4]. Sahin [5], through a multiple regression analysis, attempted to apply a quadratic model that takes the hardness of the tool into account and also handles the product of the hardness and cutting speed, as well as the hardness and feed as separate
technological variables. The cutting forces and chip morphology also were taken into account when examining coated tool materials as, for example, Chinchanikar and Choudhunry [6] did in their experimental study. Still, similarly to other cutting investigations, the common characteristic feature of these differently orientated studies applying different methods is that they summarise the results in Taylor-like formulas.
The tool life equation is just as important from the point of view of the theory and practice of cutting. When qualifying the surfaces of the workpieces, which is often complicated [7], the state of the tool also has to be defined accurately, in addition to the cutting parameters. In the case of complicated procedures like the 3D end ball milling of steels [8], the knowledge of tool wear is needed for the actual realisation of the theoretically expected surface roughness. In turning alloys which are difficult to machine, such as Inconel, the planning of tool wear is especially important [9], and when optimising the cutting technology it is essential [10].
However, there are two obstacles (limitations) to the general application of the Taylor formula. The first one is that vc–T tool-life function is general, having extreme values but over a wide range of technological parameters rather than monotonously decreasing values, as is presented in Figure 1. The second obstacle is that the tool is used with alternating or changing cutting speed. A cutting test must be done where the cutting speed changes, both in the planning of practical technology and in the validation of the SEM simulation of tool wear [11]. In a case such as this not only the definition of tool life is questionable, but even its interpretation. Bridging these difficulties is the aim of this paper.
T23
T12
vc12 vc23 vcLmax
cutting speed, vc(m/min)
cutting length, L (m)
tool life, T (min)
TLmax Lmax
T=f(vc)
L=f(vc) 1
2 3
Figure 1
General tool-life function and the through cut length
2 General Tool-Life Function
Kundrák has demonstrated before that the general tool-life function worked out by him [12], which can be seen in Figure 1, describes the whole vc–T function. Later other similar attempts became known [13] which rely on a rather complicated mathematical model, thus their practical application is laborious. The Kundrák formula that takes cutting speed into account can be written as:
1
3 2
2 3
T
c T c T c
T C
v C v C v
(2)
where CT1, CT2 and CT3 are constants. At speeds vc12 and vc23 this function has an extreme value, which is naturally influenced by the technological parameters (feed f and depth of cut ap):
12 12 12
12 c12
x y q
c v p w
v C f a d (3)
23 23 23
23 c23
x y q
c v p w
v C f a d (4)
23 23
23 23
T T
x y
T p
T C f a (5)
where dw is the diameter of the workpiece, Cv
c12, Cv
c23, C
T23 and x
12, y
12, q
12, x
23, y23, q
23, x
T23, yT
23 are constants that can be defined by technological examinations [12].
By their use already the constants of the general tool-life equation (1) can be calculated:
3 2
1 23 23 2 23 3 23
T c T c T c
C T v C v C v (6)
2 12 23
3
T 2 c c
C v v (7)
3 3 12 23
T c c
C v v (8)
It frequently occurs in technological planning practice that the length cut through the wear of the edge has to be examined or used, which, using (2), can be calculated by the formula:
1 2
2 3
T c
c T c T
L T v C
v C v C
(9)
This L(vc) function has only one extreme value (maximum) at speed
2
max 2
T L
v C (10)
and its value can be calculated by
1
max 2
2 3
0.75
T
T T
L C
C C
(11)
The tool-life function and cutting length defined in this way can be used in a wide range of technological parameters [14, 15] and thus one of the problems mentioned in the Introduction in connection with the Taylor formula can be eliminated. Later we provide a solution for the frequently occurring cases of cutting alternating in stages or changing continuously. Henceforth, tool life at fixed (unchanging) speeds is indicated with Tvc,fix, while it is indicated with Tvc,vari at variable (changing) speeds.
3 Tool Life when Changing Cutting Speed
The solution is based on the principle of the proportional degradation of the tool.
If speeds change in stages, which is the case presented in Figure 2, as cutting is done at different speeds the wear of the tool is naturally cumulative [16].
tool life, T (min)
vc1 vci Ti
T=f(vc)
∆T1
∆T2 ∆Ti
cutting speed, vc(m/min) T2
vc2
∆Ti+1 Ti+1
vci+1 T1
Figure 2
Tool life at changing cutting speed
It is a proved fact that if cutting is done for ∆ti time at cutting speed vci, the corresponding tool life is Ti, and the following equation is valid [16]:
1
( ) ( ) 1
N i cii i ci
t v
T v (12)
where N is the number of the cutting stages [16].
Although it can easily be proved that by means of the Zorev power function
VB=CVB·tu (13)
(u=0.5-1) [17] the sum of Equation (12) can be described exactly as 1 in wear functions, this is valid only until inflection is reached on the wear curve. In wear curves in which there is inflection, too, Equation (12) can be considered as an approximation before reaching the wear defined as tool-life criterion. As is known, the degradation of the tool is the consequence of the accumulated influence of several processes, where occasionally a sudden disorder occurs such as chipping away or pitting [18]. Such cases are not covered by this investigation. If cutting speed changes continuously, as in cross turning or taper turning, the equation takes the form
2
1
( ) 1
t
t c
dt T v
(14)where vc=vc(t) is a function of time [19]. By connecting Equations (2), (12) and (14), a general tool-life equation can be gained which is valid for a wide range of cutting speeds, in the case of both constant and changing cutting speed. For cutting speed changing in stages
3 2
2 3 1
1
( )
N
i ci T ci T ci T
i
t v C v C v C
(15)however, for continuously changing cutting speed (e.g. taper turning or cross turning)
2
1 t
3 2
c T2 c T3 c T1
t
v t C v t C v t dt C
(16)Using these equations and the general tool-life equation (12) valid for the cutting speed changing in stages,
3 2
2 3
1
3 2
2 3
( )
N
i ci T ci T ci
c T c T c
t v C v C v
T v C v C v
(17) and using Equation (14) at continuously changing cutting speed
2
1
3 2
2 3
3 2
2 3
( ) ( ) ( )
t
c T c T c
t
c T c T c
v t C v t C v t dt
T v C v C v
(18) Equations (17) and (18), once we know constants CT2 and CT3, can be handled numerically.
These functions are valid if all conditions with the exception of cutting speed vc remain unchanged throughout the tool life. T calculated in this way cannot be considered as tool life in the strict sense, since tool life, according to the definition, means the time of cutting during which at a given vc cutting speed a predetermined amount of wear – the tool-life criterion – develops on the tool.
However, here the cutting speed is not unchanged till the edge wears off, rather it changes either periodically or continuously. The usual vc–T data pair may occur if, besides the cutting time calculated by Equations (17) or (18), using Equation (2) vc,eq is also calculated which is considered constant, and T=Teq can really be considered as tool life. This has significance in the economic or technological optimisation of productivity.
Essentially there are two basic cases of the practical utilisation of Equations (17) and (18) in the tool-life function (1):
a) CTi constants of Equations (17) and (18) are known and identical tools are used in operations carried out at either periodically or continuously changing speeds. Now, to define the number of workpieces that can be produced before the tool wears off Np, using the data of the operation plan and also Equations (12, 14),
1
3 2
2 3
1 ( )
T
p N
i ci T ci T ci
N C
t v C v C v
(19)and
3 2
2 3
0
2
2 3
( )
tp
c T c T c
p
c T c T
v t C v t C v t dt
N k v C v C
(20) can be applied, where
1000 ,
p p w
c c
t L D
k v v f (21)
where Dw (mm) is the diameter of the workpiece, f (mm/rev) is feed, Lp (mm) is the length that can be cut by the piece, tp is the operation time. These parameters can be used for data collection during production as well if the approach is reversed: the number of the different machined parts is registered for the tool used until it is worn off. The results can be used for the refinement of Equations (15) and (16) that is the CTi constants, as well.
b) CTi constants of the equation are not known. Then data Np,i can be collected for the values of ∆ti and vci. There will be Np,i data, too, for all the worn out tools, for which Equations (12) and (14) are true. Many equations (15), (16) offer themselves for the unknown CT1 and other constants as the worn off edges; that is, a linear equation system with a minimum of three equations will be dealt with, from which these constants can be calculated.
4 Cutting Model Experiment
Hard turning was completed by cutting an Ø45 mm inner cylindrical surface of 100Cr6 hardened steel (HRC=62±2) on an E400-1000 centre lathe. The length of the machined bore hole was Lp=30 mm. The characteristics of the tool: CBN K10,
=-5o, =’=15o,=0o, r=45o, r’=15o, the applied feed f=0.075 mm/rev., depth of cut ap=0.1 mm. The constants of the tool-life formula given in Equation (2) related to the boring of this material are summed up in Table 1, and the vc-Tvc,fix tool life curve defined this way for cutting by fixed speed can be seen in Figure 3.
For the comparison of cutting at a fixed and at periodically changing speed, Table 2, for 5 chosen revolution values, displays the Np,i number of workpieces completed before a tool wears out; that is, tool life is indicated by the number of the turned bore holes. Table 3 summarises the model experiment series in which the number of pieces Np,i is measured that can be produced by turning at two speeds each, chosen from the 5 different speeds. Index I refers to the cutting speeds listed in Table 2, and ti=Np,i×tpi. These Tmeas tool lives can also be seen in Figure 3.
Table 1
Constants of functions in Equations (3)–(5) with K10 tool [2]* Cv
c12 xv
12 yv
12 qv
12
1.06 -0.41 -0.40 0.19
Cv
c23 xv
23 yv
23 qv
23
3.32 -0.24 -0.49 0.16
CT23 xT
23 yT
23 qT
23
13.99 -0.19 -0.09 0.48
*[vc]=m/min, [f]=mm/rev., [ap]=mm.
0 40 80 120 160 200
0 20 40 60 80 100
tool life, T (min)
cutting speed, vc(m/min)
Tconst Tvari Tmeas
Tvc,fix
Tvc,vari
Tmeas
Figure 3
T-vc curves defined by fixed speed (Tvc,fix), changing speed (Tvc,vari) and measured (Tmeas) values
As Table 3 shows, the model experiment series consist of 3 variations each. The first part of the series covers the range of cutting speed where there is the maximum of vc–T curve, at cutting speed vc23.
Table 2
Technological parameters for fixed and periodically changing turning
Designation Symbol i=1 i=2 i=3 i=4 i=5
Number of revolutions nspindle [1/min] 142 250 354 480 650 Cutting speed vc,i [m/min] 20.06 35.33 50.02 67.82 91.85 Operation time tp,i [min] 2.8169 1.6000 1.299 0.8333 0.6154
Piece number Np,i [piece] 43 112 67 22 10
Tool life Tvc,fix [min] 121.1 179.2 75.7 18.3 6.15
Tvc,vari [min] 131.2 178 71.8 17.2 4.6
Tvc,fix: constant vc, continuous cutting; Tvc,vari: variable vc, periodical cutting Table 3
Number of bore holes turned with two speeds each until the wear off of the cutting edge Number
of experimen t Speed
1 2 3 4 5 6
Σti/T Np,1 i
[piece ]
t1 [min
] Np,2
[piece ]
t2 [min
] Np,3
[piece ]
t3 [min]
Np,4
[piece ]
t4 [min
] Np,5
[piece ]
t5 [min
] Np,6
[piece ]
t6 [min
] vc1 and vc3 24 67.6
1 — — 31 35.0
3 — — — — — — 1.021
vc1 and vc2 30 84.5
1 40 64 — — — — — — — — 1.055
vc2 and vc3 — — 36 57.6 43 48.5
9 — — — — — — 0.963
vc3 and vc4 — — — — — — 28 31.6
4 11 9.17 — — 0.918 vc3 and vc5 — — — — — — 40 45.2
0 — — 5 3.08 1.097 vc4 and vc5 — — — — — — — — 15 12.5 3 1.85 0.982 Numerical data of speeds from Table 2
By means of Equation (15), in any part of the series 3 equations can be set up from which the constants CT1, CT2, and CT3 can be calculated. Table 4 summarises the constants defined from the results of the first part of the series.
The last column of Table 3 also contains the sums calculated by Equation (12), whose dispersion is indicated in Figure 4 on a so-called Gauss paper. Here on the vertical axis (ordinate) the scale was made on the basis of the error function; Pi, however, is the estimation of the error function calculated from the results
obtained by the formula given in Figure 4. The dispersion of the data Σ∆ti/∆Ti is typical in cutting examinations; their average, however, closely approaches the value 1 given in Equation (9).
By means of the constants summarised in Table 4, the values can be calculated of Tvc,vari in the vc–T curve which can be defined by turning at periodically changing speeds. The bottom line of Table 2 contains this data, while the close relationship of values Tvc,fix and Tvc,vari is presented in Figure 5.
The number of the parts produced with the tool edge until reaching the allowed value of wear (e.g. VB) can also be calculated from the data above. For the variations indicated in Table 3, the number of the parts is shown in Figure 6.
Table 4
Constants of function (2) at speeds changing periodically*
Constant CTi Value
CT1 1334540
CT2 -74.51304
CT3 1596.56
*Calculated from vc1-vc3 data
0.5 99.5
90
10 80
20 70
30 40 60 50
5 95
97.72
84.13
2.27 15.87
0.90 0.95 1.00 1.05 1.10 99.87
0.0013
Σ∆ti/Ti Pi(%)
i
100 i
P %
n 1
Figure 4 Dispersion of Σ∆ti/Ti values
y = 1.0390x - 0.7362 R² = 0.9952
0 40 80 120 160 200
0 40 80 120 160 200
tool life, Tvc,vari(min)
tool life, Tvc,fix(min)
Figure 5
The relationship of tool lives stated by Tvc,fix fixed speed and Tvc,vari changing speed cutting
0 20 40 60 80 100
0 20 40 60 80 100
turned piece number, Np
cutting speed, vc(m/min)
Ndb,const Ndb,vari Ndb,meas
Np,fix Np,vari Np,meas
Figure 6
Number of parts as a function of cutting speed
5 Applications
The applicability of the general tool life function extended to the cutting with changing or alternate speed can be illustrated well in the examples of face turning and taper turning and also by the economic examination of tool performance.
5.1 Turning of Conical Surfaces
In the machining of internal cylindrical surfaces it has been found that constants CTi also depend on diameter of the workpiece Dw besides feed f and depth of cut ap [12]. In these cases Equation (12) takes the form of
3 2
2 3
1 1
1
N
c T i c T i c
i
i T i
v C v C v
t C
(22)with continuously changing cutting speed; however, in face turning or taper turning, for example, it takes the form of
3 2
2 3
0 1
1
tp
c T c T c
T
v C v C v
C dt
(23)In the frequent case when Np parts are produced in sequence until the edge is worn off, on the right side of Equations (21) and (22) there is 1/Np instead of 1.
For an example of the continuous change of cutting speed, the task is the hard turning of an internal cylindrical surface with a 1:5 taper made of 100Cr6 (HRC60±2) hardened steel. In this example the length of the cone is ℓ=40 mm, the tool geometry, the feed f and depth of cut ap are the same, however, diameter D changes:
( ) 0
5
D t D n f t (24)
Therefore here the values vc12, vc23 and T23 defining CTi constants also depend on time. Putting technological data into Equations (3)-(5) we obtain
vc
12=7.7007·D0.19 vc
23=24.1192·D0.16 (25)
T23=101.6348·D0.48
with which the constants CT1, CT2, CT3 can be calculated. The number of parts Np that can be produced until the tool edge has been worn off can be simply calculated with a numerical method by means of Equation (23)
3 2
2 3
1 0
p 1
t
c T c T c
T p
v C v C v
C dt N
The cutting time before the tool wears off
Tcut=Np×tp, (26)
where tp=ℓ/(f×n). The results of the calculation are shown in Figure 7. As can be seen, the character of the vc-Tcut function can be compared with tool life T according to Figure 3; however, because of the continuous change of speed in taper turning, the locations of the extreme values are somewhat modified: they are shifted towards the higher values, however, their maximums are almost the same.
0 10 20 30 40 50 60 70 80 90 100
0 40 80 120 160 200
0 10 20 30 40 50 60 70 80
turned piece number, Np
cutting time, Tcut(min)
initial speed, vc0[m/min]
Tforg Ndb Tcut
Np
Figure 7
Number of parts and cutting time machined by taper turning until the wear off of the edge
5.2 Economics of Cutting
Several points of view have to be considered in economic examinations of cutting;
however, in the present case the aim the economic analysis is to explore how the tool life influences the economy and productivity. So at first approach, the other cost factors of production beyond the technological parameters and the related different technological limits can be ignored.
Productivity can be characterised in the simplest way by the material volume cut during a time unit, that is, it can be calculated by
p c
ch
a f v
Q T
t T (cm
3/min) (27)
where tch is the time needed to change the tool.
To define the cutting speed economically from the point of view of tool life, it is expedient to calculate the cost of cutting of the material quantity by unit of volume:
1 ch m tool
m
p c
t k K
K k
a f v T
(€/cm3), (28)
and here km is the so-called minute cost of the machine tool, however Ktool is the cost of one edge of the tool.
As is known, these specific economic indexes have extreme values depending on the cutting speed, the position of which can simply be expressed with formulas; in the case of the Taylor formula, by calculating the tool life that is optimal from the point of view of productivity and economy. In the case of the general vc-T tool life
function the calculation of this optimal tool life would need the solution of a cubic equation originating from Equations (2) and (17), which can be handled by the Cardano method – a program can be created for it, but that would be rather labor intensive. However, by means of a direct numerical method, e.g. an ordinary spreadsheet program, all the necessary information on productivity and economy can be gained.
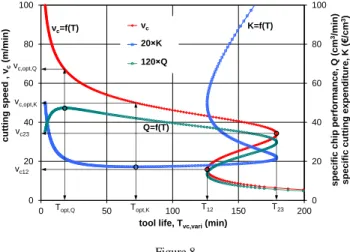
Functions (27) and (28) can be seen in Figure 8 with the experimental data of turning discussed in Section 4, where the time of the tool change is tch=5 min, the cost of the edge is Ktool=4 €, the minute cost of the machine tool is km=0.25 €/min and ap×f=0.0075 mm2. So that the characteristic curve of vc cutting speed and K specific cost of cutting as well as Q productivity can be illustrated in a diagram:
Figure 8 shows a 20-fold K specific cost and a 120-fold Q specific chip output.
Here tool life T is an independent variable of the calculation; in reality, however, the aim is to define the cutting speed that is optimal from the point of view of productivity or expenditure. The characteristic curve of economic indices can be evaluated on the basis of Figure 8, then from the related spreadsheet table the vc,opt value, which is in Table 5, can be read with optional accuracy. It can be seen that the specific economic characteristics defined for turning with fixed speed and for turning with periodically changing speed are almost the same.
0 20 40 60 80 100
0 20 40 60 80 100
0 50 100 150 200
specific chip performance, Q (cm3/min) specific cutting expenditure, K (€/cm3) cutting speed , vc(m/min)
tool life, Tvc,vari(min)
vc m/min
20*€/cm3
120*Q cm3/min
Topt,Q Topt,K T12 T23
vc,opt,Q
vc,opt,K
vc
20 K 120 Q
vc=f(T) K=f(T)
Q=f(T) vc23
vc12
Figure 8
Specific cutting expenditure (K, €/cm3) and chip performance (Q, cm3/min) in hard boring It follows from Equation (28) that the increase of tool expenditure Ktool increases the tool life optimal for economy. In an extreme case it may occur that Topt,K slides in between the borders of T12–T23, where – as can be seen in the T–vc curve – up to three values offer themselves for the speed and consequently for machining cost K. Obviously, the most economically beneficial one is to be chosen from them if the other circumstances make that possible. When the application of optimal cutting speed defined in that way encounters some barriers, it can easily be decided what technology may closest approach the optimum.
Table 5
Comparison of specific characteristics of cutting in continuous cutting and cutting with changing speed
Cutting method vc,opt,Q Topt,Q Qopt vopt,K Topt,Q Kopt
[m/min] [min] [cm3/min] [m/min] [min] [€/cm3] Cutting with fixed speed 67.5 18.8 0.400 51.0 71.1 0.847 Cutting with changing speed 67.8 17.3 0.400 49.3 76.9 0.881 Summary
The most important point of view of cutting ability is tool life. Usually it is described by the well-known Taylor formula, which, in the basic case gives the tool life as function of the cutting speed, but this is only valid for a monotonously decreasing T–vc curve. To describe a T–vc curve having extreme values as well, we introduced a general tool life function proved by cutting experiments. A frequent problem is, however, that cutting goes on sequentially with the same tool at several different speeds, and then this formula can be used only with difficulty.
With periodically changing cutting speed the equation Σti/Ti
1 is valid theoretically and experiments have proven this. From this a general form of T–vc curve can be deduced which can also be used with cutting at periodically changing cutting speeds. In the case of cutting at different speeds, an equivalent speed and the related tool life can be defined which can already been handled by the general Kundrák tool-life function. By the calculation of the equivalent speed it is possible to define the T–vc curve under manufacturing conditions, even in cutting with changing speed, and the general tool life function can be defined by operational measurements. The applicability of this function is demonstrated by examples of taper turning and cutting optimisation.Acknowledgements
This research was (partially) carried out in the framework of the Centre of Excellence of Innovative Engineering Design and Technologies at the University of Miskolc. The work was presented with the support of the Hungarian Scientific Research Fund (Number of Agreement: OTKA K 78482), which the authors greatly appreciate.
References
[1] ISO Standard 3685 Tool-Life testing with Single-Point Turning Tools [2] El Baradie M. A.: The Effect of Varying the Workpiece Diameter on the
Cutting Tool Clearance Angle in Tool-Life Testing. Wear 195 (1996) pp.
201-205
[3] Arsecularatne J. A., Zhang L. C., Montross C., Mathew P.: On Machining of Hardened AISI D2 Steel with PCBN Tools, Journal of Material Processing Technology 171 (2006) pp. 244-252
[4] Arsecularatne J. A., Zhang L. C., Montross C.: Wear and Tool Life of Tungsten Carbide, PCBN and PCD Cutting Tools, International Journal of Machine Tools and Manufacture 46 (2006) pp. 482-491
[5] Sahin Y.: Comparison of Tool Life between Ceramic and Cubic Boron Nitride (CBN) Cutting Tools when Machining Hardened Steel, Journal of Material Processing Technology 209 (2009) pp. 3478-3489
[6] Chinchanikar S., Choudhury S. K.: Investigations on Machinability Aspect of Hardened AISI 4340 Steel Different Levels of Hardness Using Coated Carbide Tools, Int. Journal of Refractory Metals and Hard Materials 38 (2013) pp. 124-133
[7] Fekete G., Horváth S., Czifra Á.: Microgeometry Tests of ‘Contradictory’
Surfaces with Various Evaluation Techniques, Acta Polytechnica Hungarica, Vol. 4, No. 2, 2007, pp. 87-97
[8] Mikó B., Beňo J., Maňková I.: Experimental Verification of Cups Heights when 3D Milling Rounded Surfaces, Acta Polytechnica Hungarica, Vol. 9, No. 6, 2012, pp. 101-116
[9] Khan S. A., Soo S. L., Aspinwall D. K., Sage C., Harden P., Fleming M., White A., M’Saoubi R.: Tool Wear/Life Evaluation when Finish Turning Inconel 718 Using PCBN Tooling, 5th CIRP Conference on High Performance Cutting, Procedia CIRP Vol. 1, 2012, pp. 283-288
[10] Aykut S., Kentli A., Gülmez S., Yazıcıoğlu O.: Robust Multiobjective Optimization of Cutting Parameters in Face Milling, Acta Polytechnica Hungarica, Vol. 9, No. 4, 2012, pp. 85-100
[11] Salvatore F., Saad S., Hamdi H.: Modelling and Simulation of Tool Wear During the Cutting Process, 14th CIRP Conference on Modelling of Machining Operations (CIRP CMMO) Procedia CIRP 8 (2013) 305-310 [12] Kundrák J.: The Scientific Principles of Increasing the Effectiveness of
Inner Surfaces Cutting with CBN Tools, Kharkov, 1996, p. 368
[13] Pluta Z., Hrynieviez T.: Advanced Model of the Tool Edge Blunting under Machining, Int. J. Manuf. Technol. 51 (2010) pp. 35-43
[14] Mamalis A. G., Kundrák J., Horváth M.: Wear and Tool Life of CBN Cutting Tools, Int. J. Adv. Manuf. Technol. 20 (2002) pp. 475-479
[15] Kundrák J., Pálmai Z.: Investigation of Machinability in Boring of Inner Cylindrical Surfaces of Hardened Bearing Steels, Proc. ICT-2012, 13th International Conference on Tools, 2012 Miskolc, Hungary, pp. 165-170 [16] Pálmai Z.: Anwendung der Taylorschen Gleichung auf die Zerspanung mit
wechselnd sich Änderungen Schnittgeschwindigkeiten. Archiv für das Eisenhüttenwesen 49 Nr. 2 (1979) pp. 89-93
[17] Zorev N. N., Granovskij G. I., Loladze T. N., Tretyakov I. P.: Razvitie nauki o rezanii metallov, Mashinostroenije, Moscow, 1967, p. 413
[18] Olovsjö S., Nyborg L.: Influence of Microstructure on Wear Behaviour of Uncoated WC Tools in Turning of Alloy 718 and Waspaloy, Wear 282-283 (2012) pp. 12-21
[19] Pálmai Z.: Standzeit des Werkzeuges beim Plandrehen. Archiv für das Eisenhüttenwesen 49 Nr. 10 (1984) pp. 499-502