1
Graphite Oxide-TiO
2Nanocomposite Type Photocatalyst for Methanol Photocatalytic Reforming Reaction
Topics in Catalysis (2018) 61:1323–1334
Katalin Majrik, Árpád Turcsányi, Zoltán Pászti, Tamás Szabó, Attila Domján, Judith Mihály, András Tompos, Imre Dékány, Emília Tálas
https://doi.org/10.1007/s11244-018-0989-z
Published online: 11 May 2018
© Springer Science+Business Media, LLC, part of Springer Nature 2018
2 Graphite oxide-TiO2 nanocomposite type photocatalyst for methanol photocatalytic
reforming reaction
Katalin Majrik2, Árpád Turcsányi1, Zoltán Pászti2, Tamás Szabó1, Attila Domján3, Judith Mihály2, András Tompos2, Imre Dékány1, Emília Tálas2
1Department of Physical Chemistry and Materials Science, University of Szeged, H-6720 Szeged, Aradi vértanúk tere 1, Hungary,
2Institute of Materials and Environmental Chemistry, Research Centre for Natural Sciences, Hungarian Academy of Sciences, H-1117 Budapest, Magyar tudósok körútja 2, Hungary,
3NMR Research Group, Research Centre for Natural Sciences, Hungarian Academy of Sciences, H-1117 Budapest Magyar tudósok körútja 2, Hungary,
Acknowledgements
The research within project No VEKOP-2.3.2-16-2017-00013 was supported by the European Union and the State of Hungary, co-financed by the European Regional Development Fund.
Financial support by the National Research, Development and Innovation Office (Hungary) via the grant FK-124851 is greatly acknowledged. The authors thank Ágnes Veres for her aid in sample preparation, Gábor P. Szijjartó for the help in the operation of the photocatalytic reactor system and Ildikó Turi for the technical assistance.
Corresponding author, Tel.: +36 1 382 6916, email: talas.emilia@ttk.mta.hu, address: H-1519 Budapest, P.O.Box 286, Hungary (Emília Tálas)
3 Abstract:
Graphite-oxide/TiO2 (GO/TiO2) composite materials were prepared by heterocoagulation method from Brodie’s graphite-oxide (GO) in order to test them as catalysts in the methanol photocatalytic reforming reaction in liquid phase. The preparation of the composite itself resulted in only little changes in the structure of GO as it was indicated by attenuated total reflection infrared (ATR-IR) and 13C magic-angle spinning nuclear magnetic resonance (13C MAS NMR) spectroscopic measurements. However, during the photocatalytic reaction, all of the GO/TiO2 samples darkened strongly indicating structural changes of GO. X-ray photoelectron spectroscopy (XPS) along with NMR confirmed the loss of oxygen functionalities and emergence of graphitic species in the samples recovered from the photocatalytic reaction. Model experiments were designed to identify the key factors determining the activity of the GO/TiO2 derived photocatalysts. It was found that the emergence of a pronounced coupling between TiO2 and the graphite-like carbonaceous material is the most important contribution to get active and stable photocatalysts.
Keywords: graphite oxide, TiO2, methanol, hydrogen, XPS, MAS NMR
4 1. Introduction
Nowadays, hydrogen is regarded as one of the emerging sources of clean energy [1-3].
Photocatalytic hydrogen production is a promising approach for transforming solar energy into chemical energy for storage and transport. Methanol photocatalytic reforming (1) is a potential reaction for large-scale H2 production [4].
Photocatalyst, h
CH3OH + H2O 3 H2 + CO2 (1)
Since Fujishima’s and Honda’s pioneering work in 1972 [5], there has been a continuously growing interest in TiO2 as a photocatalyst because of its efficiency, long term stability, cheapness and low toxicity [6-9]. Although TiO2 is a good candidate for photocatalyst in general, especially in degradation of organic pollutants both in gas phase [7, 10] and in liquid phase [7, 11-13] bare TiO2 (in the absence of metal co-catalyst) results only in poor H2 evolution in reaction (1) [14,15]. The activity of TiO2 in the hydrogen producing reaction can be increased at least by an order of magnitude when a proper co-catalyst is involved [16-18]. The advantages of the co-catalysts are attributed to the suppressed charge recombination; promoted charge separation and transport driven by junctions/interfaces [19- 21]. Pt is one of the most effective co-catalysts for H2 production [16, 20] however it is rather expensive and is available in limited quantities.
Combination of carbon materials with a semiconductor has been reported to enhance the photocatalytic activity [22, 23]. The enhancement mechanism can be related to carbon materials, which (i) offer more active and larger number of adsorption sites and photocatalytic reaction centers, (ii) contribute to the suppression of the recombination of the photogenerated electron/hole pairs, (iii) prolong the lifetime of electrons and holes, (iv) narrow the band gap of photocatalyst, and (v) act as photosensitizer for catalytic reaction [24-25].
Graphite oxide (GO) is an excellent supporting matrix in nanocomposite materials due to its high specific surface area. GO is a layer-structured graphite compound which is relatively cheap, easily available and suitable for mass production. It can be prepared from graphite by electrochemical oxidation [26], most frequently by strong oxidizing agents according to the two main preparation procedures and their more elaborated versions (e.g.
NaClO3/HNO3 in Brodie’s method [27]; KMnO4, H2SO4, NaNO3 in Hummers-Offeman method [28]). GO is a non-stoichiometric compound with an empirical chemical formula of C4O2H for well-oxidized samples [29], although the structure of GO depends on the type of the oxidation method [30-31]. Dynamic changes of its structure have also been suggested [32]. GO has weakly acidic character [33] owing to O and H containing functional groups
5 which are covalently attached to the carbon skeleton [29, 34]. Typical functional groups of GO are -OH, cyclic ether, C=O and COOH. Nevertheless, non-oxidized aromatic regions and/or isolated C=C double bonds are also characteristic for the structure of GO. However, O- containing functional groups provide relatively hydrophilic character of GO [35] so unlike graphene it is easy to use in wet-chemistry [36]. The GO is built up from hydrophilic, stacked graphene-based sheets, exfoliated GO is often added to TiO2 in aqueous dispersions [37-38]
or used as a “base board” for TiO2 preparation from different Ti precursors [39-41] in order to get reduced graphene oxide (R-GO) containing composites after reduction processes [42-45].
Hydrothermal treatment of the GO-TiO2 (i.e. treatment with the mixture of water and ethanol at elevated temperature in autoclave) also leads to the reduction of the GO, with the formation of R-GO/TiO2 composite materials [38, 46]. During the hydrothermal treatment removal of O containing functional groups of GO has been observed [47] which has led to re-establishment of conjugated graphene network [48] along with the possible appearance of C-O-Ti bonds [46-47, 49-50]. Composites prepared from GO and TiO2 have been found beneficial for hydrogen producing reactions [42, 49]. Several works have reported a synergism between reduced graphene oxide (R-GO), TiO2 and Pt [26, 51].
The key point to taking the benefits of GO is in its exfoliation. Different methods, such as sonication, thermal treatment, microwave treatment, etc., can be used for the above purpose [36]. Sonication seems to be a clean and comfortable method to separate the GO sheets from each other in case of Hummers’ GO, however sonication itself is not satisfactory for exfoliation of Brodie’s GO [25, 30] and slightly basic conditions are needed to achieve larger degrees of dispersion [33]. However, the application of graphite oxide samples synthesized via Brodie protocol may be superior to Hummers’ GO in terms of purity (metal and sulfur-containing species are absent in Brodie-GO which can have a detrimental effect related to the activity of catalytic reactions) [30]. Recently, GO/TiO2 exfoliated nanocomposite has been prepared from Brodie’s GO by heterocoagulation [52]. In this method the negative charges on the GO sheets formed in mild alkaline solution contribute to the exfoliation of GO and to the nanocomposite formation driven by the emergence of electrostatic interaction between GO and TiO2 colloidal particles, which possess a net positive surface charge density in aqueous electrolyte solutions below the pH of the point of zero charge (pHp.z.c. = 6.3) [53].
Our goal was to prepare GO/TiO2 composite type materials from Brodie’s GO by heterocoagulation in order to test them as catalysts in the methanol photocatalytic reforming reaction in liquid phase. To our knowledge, it is the first use of this type of composite in the
6 above reaction. Correlations between the photocatalytic behavior and the interaction of the carbonaceous material and the semiconductor were sought. Our recent results revealed that the working conditions of the methanol photocatalytic reforming reaction may result in significant changes of the structure of certain metal oxide-semiconductor catalyst systems involving both the semiconductor [54] and co-catalyst [15] compared to the fresh state.
Therefore we characterized both the fresh and recovered samples by bulk and surface characterization methods such as diffuse reflectance UV-Vis, 13C MAS NMR, ATR-IR spectroscopy and XPS.
2. Experimental 2.1 Materials
Nanocomposites were prepared using commercially available P25 TiO2 (Evonik, Germany). This solid contains 75% anatase and 25% rutile with a specific surface area (aSBET) of 50 m2/g and its average primary particle size is 30 nm (manufacturer data). GO was synthesized from natural flaky graphite (Graphitwerk Kropfmühl AG, Germany) by the Brodie method. This sample is highly oxidized (C2O0.98H0.40), and it is identical with that codenamed as GO-2 in an earlier publication [29]. Sodium hydroxide, hydrogen chloride used for pH setting and methanol, absolute ethanol solvent were products of Reanal (Hungary).
Double distilled water (18 M) was used in every experiment.
2.2 Preparation of photocatalysts
A series of GO/TiO2 nanocomposite type photocatalysts with various GO content (1w%, 2w%, 10w%) were prepared from aqueous dispersions of P25 TiO2 and exfoliated GO by heterocoagulation as described before [52]. Briefly, 40-400 mg of GO samples was dispersed in 1.6 L of water. In each case, the pH was adjusted to 8.5±0.3. After 15 min of sonication and one day of continuous stirring in the dark the pH was reset to 8.5±0.3. Next, these suspensions were poured into 0.4 L of 9–9.9 g/L aqueous colloid dispersions of TiO2
(pH=5) upon which the system coagulated in several seconds. However, we must note that the composites, unlike to the reported cases in ref [52], settled completely only after the first washing step and the supernatants remained slightly turbid even at larger GO concentrations when they were progressively washed from the electrolyte contaminations. The reason might have been the ageing of the GO samples, resulting in incomplete exfoliation. After decantation or centrifugation the wet sediment was dried at 50°C and then crushed into powder. Blank TiO2 was obtained by the same procedure in the absence of GO.
7 In order to simulate the effect of each assumed process which can contribute to the structural changes of the heterocoagulated GO/TiO2 composites under the conditions of the photocatalytic reaction, samples for model experiments were prepared by certain treatments of the fresh GO/TiO2 composite. In order to simulate the physical removal of GO sheets from the composites and their rupture, the fresh sample of 2w% GO/TiO2 was stirred for a week at room temperature in the aqueous methanol reaction mixture in dark. This agitated sample was denominated as A-GO/TiO2 and it was used in the same reaction mixture in which it was prepared. Removal of functional groups and reduction of carbon skeleton can also occur in the methanol solution during the photoinduced reaction. In order to get a model sample representing this process the fresh composite of 2w% GO/TiO2 underwent a hydrothermal treatment at 120°C for 24h in an N2 rinsed autoclave in ethanol/water 1:1 mixture similarly to the procedure used for composite preparation from Hummer’s GO [46]. This hydrothermally treated sample was denominated as HT-GO/TiO2. Model sample AHT-GO/TiO2 was obtained by agitation of HT-GO/TiO2and it also was used in the same reaction mixture in that it was stirred. In order to show the sole effect of UV irradiation during the photoinduced reaction the dry sample of the fresh 2w% GO/TiO2 was exposed to UV irradiation (430 nm) for 2h. The UV irradiated model sample was denominated as UV-GO/TiO2.
2.3 Characterization of the photocatalysts
ATR-IR spectra were recorded by the means of a Varian 2000 (Scimitar Series) FT-IR spectrometer (Varian Inc, US) equipped with an MCT (Mercury-Cadmium-Telluride) detector and with a ‘Golden Gate’ diamond single reflection ATR unit (Specac Ltd, UK). 64 scans were collected at a spectral resolution of 4 cm-1. Baseline correction was performed using the GRAMS/AI (7.02) software (ThermoGalactic Inc., US).
Solid state NMR magic angle spinning (MAS) spectra of the fresh and recovered samples were recorded on a Varian NMR System (Varian Inc., Palo Alto, CA, U.S.A.) operating at 1H frequency of 400 MHz with a Chemagnetics T3 4.0 mm narrow bore double resonance probe.
The 1H MAS spectra were measured with a rotor spinning rate of 12 kHz. The 1H π/2 pulse was 3 μs and a repetition delay of 30 seconds was used. For the 13C CP MAS (cross- polarization magic angle spinning) [55] spectra 20000 transients were recorded with 2 ms of contact time with SPINAL-64 decoupling [56] and 5 seconds of recycle delay. The direct polarization 13C MAS spectra were recorded with 60 s of relaxation delay and 20000 transients were collected. For the 13C spectra adamantane was used as external chemical shift reference (38.55 and 29.50 ppm), π/2 pulse lengths were 3.0 μs for carbon and 3.0 μs for the
8 proton channel. For the 13C measurements a rotor spinning rate of 8 kHz were used. The measuring temperature was 20°C in all cases.
X-ray photoelectron spectroscopy (XPS) measurements were carried out using an EA125 electron spectrometer manufactured by OMICRON Nanotechnology GmbH (Germany). The photoelectrons were excited by MgK (1253.6 eV radiation. Spectra were recorded in the Constant Analyzer Energy mode of the energy analyzer with 30 eV pass energy resulting in a spectral resolution of around 1 eV. For XPS experiments the samples in the form of fine powder were suspended in isopropyl alcohol. Drops of this suspension were placed on standard OMICRON sample plates; after evaporation of the solvent catalyst coatings with sufficient adhesion and electric conductivity were obtained. Effects of possible electric charging were compensated by adjusting the binding energy of the Ti 2p3/2 peak to 458.8 eV (consensual value for TiO2 [42]). Chemical states of the elements were deduced from high resolution spectra using XPS databases [57-58]. Quantification was performed using combination of CasaXPS [59] and XPS MultiQuant [60].
2.4 Photocatalytic hydrogen generation
The photocatalytic reaction was carried out in liquid phase in a reactor system of 10 quartz glass units equipped with magnetic stirrers, gas inputs and outputs as described before [15].
The size of the cylindrical glass units were: 60 mm in height and 140 mm in diameter.
Nitrogen gas with 20 ml/min flow rate was continuously bubbled through all reactor units in parallel. Gas outlets were connected to the gas chromatograph (GC) via a ten position selector valve. According to blank experiments all of the reactor units were equivalent in terms of the catalytic activity. In case of kinetic measurements one channel mode was used. The initial concentration of methanol was 6 v % in distilled water. It has been known that the rate of hydrogen generation vs. methanol concentration relationship gives a saturation curve and use of diluted solution is favorable [16]. The reaction was carried out at room temperature. The amount of catalyst and the reaction volume in every unit was 0.100 g and 280 ml, respectively. Osram HQL de luxe 125W lamps were used as light sources operated in UV- visible region. The reaction was monitored for 4 h. Hydrogen formation was followed by GC analysis of the outlet gas upon using SUPELCO Carboxen 1010 column, TCD and FID detection and argon internal standard. The calculation of the H2 formation rate was based on the results obtained by TCD. FID was used to monitor the methanol signal, sudden decrease of which indicated if clogging from the water appeared in the gas tube system.
9 After the photocatalytic reaction, the samples were recovered from the aqueous methanol solution by centrifugation, washing with 3x50 ml absolute ethanol followed by drying under N2 flow.
3. Results and discussion
3.1 Behavior of the nanocomposites obtained by heterocoagulation
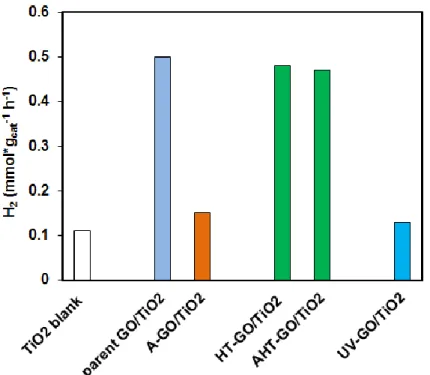
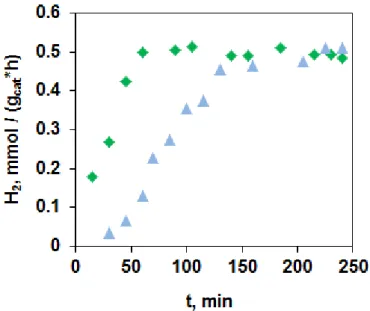
As products, only H2 and CO2 could be detected by TCD in the outlet gas. Although the liquid phase was not analyzed, it is known that methanol is photooxidized to CO2 via the formation of the stable intermediates [4]. Consequently, presence of formaldehyde, formic acid, methyl formate, and CO2 can be supposed in the diluted aqueous solution besides the starting MeOH. Regarding the photocatalytic behavior in the methanol reforming reaction, the introduction of GO into the composite increased the catalytic activity about three-to-fourfold compared to the blank TiO2 while unsupported GO led to H2 formation at the detection limit (see Fig. 1). This increase is slightly less than that reported by El-Bery et al. [61]. The H2
evolution showed a maximum as a function of the GO content, similarly as reported before [42, 49]. For comparison, significantly smaller hydrogen formation rates were observed with 1.0wt% Ag/TiO2 reference catalysts prepared by sodium borohydride reduction, while a 0.5wt% Pt/TiO2 reference catalyst obtained by impregnation and subsequent reduction in H2 gave outstandingly better results (see data of H2 formation and details of preparation of reference catalysts in the Electronic Supplementary Materials). We must note here also that, for the fair comparison of activities expressed in mmolg-1h-1 dimension, the specific surface area of the catalysts needs to be similar to each other. Here, this criterion is fulfilled because the composite particles are characterized by a large mass excess of TiO2. Although graphite oxide particles have a large specific surface area at high degrees of exfoliation, the surface area of the composites must fall close to that of the TiO2 particles (aSBET = 50 m2/g) that completely cover the surface of the delaminated carbon sheets at low GO loadings, as shown in our previous publication [52]. Moreover, although the total surface area may be slightly higher than for the bare particles, the reactive surface area is only represented by the TiO2
particles, which is exactly the same for both the “TiO2 blank” and for the nanocomposite samples irrespectively of their phase ratios.
10 Fig. 1 Rate of H2 formation after 240 min reaction time
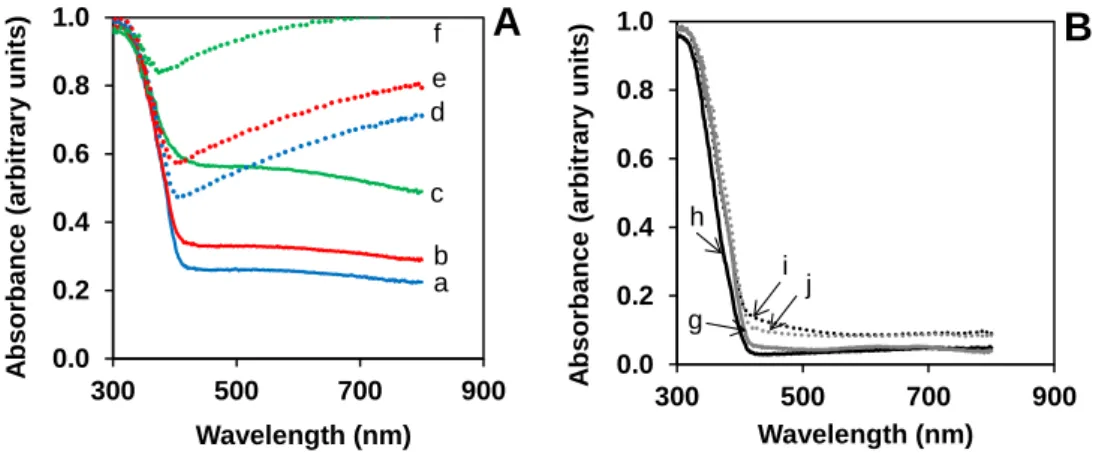
During the photocatalytic reaction significant color change (blackening) of the GO/TiO2 composites was observed. The UV-visible spectroscopic measurements of fresh and recovered composite samples confirmed the darkening (see Fig. 1SA in the Electronic Supplementary Materials). The absorbance of the fresh GO/TiO2 samples was proportional to the carbon content (see Fig. 1SA in the Electronic Supplementary Materials) as has been described in the literature [26, 49]. At the same time the color change of pristine TiO2 and blank TiO2 (see diffuse reflectance UV-Vis spectra in Fig. 1SB in the Electronic Supplementary Materials) during the irradiation in methanol solution was negligible. The slight grey color can be explained by the organic deposits picked up from the solution.
According to photoelectron spectroscopy measurements, no reduction of the TiO2 particles is evident after the photocatalytic reaction, thus the significant blackening of the recovered composite type samples indicates that structural changes of the GO/TiO2 composites occurred during the reaction and these changes must be related to the GO part.
In order to map the supposed structural/chemical changes of GO, ATR-IR spectra of fresh (Fig. 2A) and recovered samples (Fig. 2B) were recorded. It has to be noted that unsupported GO and 10w% GO/TiO2 had rather dark color, resulting in a heavy baseline shift so all the discussed spectra underwent baseline correction. It can be safely reported that composite preparation by heterocoagulation method resulted in only little changes in the structure of GO, as all major spectral features are observable after the procedure (cf. lines a and b in Fig. 2A). In details, pure GO exhibits several bands corresponding to oxygen containing surface species like –OH groups (v-OH stretchings around 3735, 3600 and 3460 cm-1), carbonyl group (C=O at 1711 cm-1) and carboxylates (COO at 1641 and 1367 cm-1).
11 The latter may be overlapped with C=C stretching of aromatic rings. The bands between 1000 and 800 cm-1 belong to C-O stretching vibrations of C-OH and C-O-C species. The spectrum resembles that of pure TiO2; only very small bands referring to oxygen-containing surface species can be witnessed (surface –OH and surface carbonates/carboxylates at 3734 cm-1 and at 1419, 1123 and 1061 cm-1, respectively).
As far as the recovered samples are concerned, little changes are seen in the case of the pure GO. On the other hand, in the case of the used GO/TiO2 catalysts, several bands indicate species derived from adsorbed MeOH/organic compounds on TiO2 (Fig. 2B, lines b, c and d) which resulted in difficulty in the interpretation of the spectra.
12 Fig. 2 ATR-IR spectra of fresh (A) and recovered samples (B)
a: GO; b: 10w% GO/TiO2; c: 2w% GO/TiO2; d: TiO2
Accordingly, ATR-IR analysis of the recovered samples was not really informative for the changes of the supported GO but it is important to mention that newly formed OH groups (at 3736 and 3685 cm-1) in the GO containing recovered samples were well-marked (see lines b and c in Fig. 2B. It seems reasonable that the GO activates the TiO2 surface.
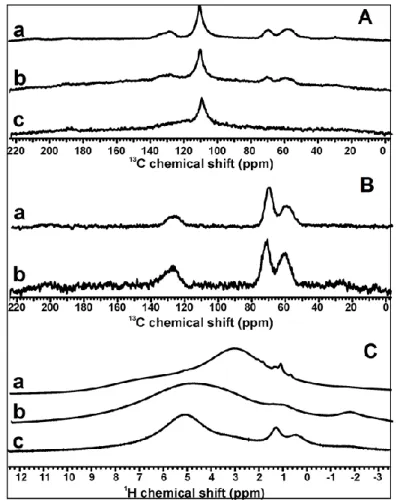
In order to get further information exclusively about the carbonaceous part of the fresh and recovered samples, 13C solid state MAS NMR technique was chosen. Because of the low carbon content of the samples only the composite sample of 10w% GO/TiO2 and unsupported GO were investigated in detail. Direct polarization spectra of fresh GO/TiO2 composite and bulk GO are very similar to each other (cf. spectrum a and b in Fig. 3A) confirming the finding with ATR-IR, i.e. no significant structure change of GO appeared during the composite preparation by heterocoagulation. Characteristic functional groups on the carbon skeleton such as primary alcohol (55-65 ppm), secondary alcohol and ether (65-75 ppm), and oxo (195-215 ppm) groups could be identified. Beside them signal of isolated C=C and polyaromatic part (120-140 ppm) could be observed. The strong signal at 110 ppm belongs to the Teflon parts of probe.Cross polarization MAS NMR technique enhances the intensity of
13 carbon signals and removes the Teflon background. This enhancement is weaker for quaternary carbons and it is suitable for direct quantitative analysis. Signals in the region of 50-80 ppm belonged to CH connected with heteroatom (O) and the edge of the graphite sheets as C-H signals in these spectra were more intense than that of quaternary or condensed aromatic carbons.
Fig. 3 MAS NMR spectra of GO and GO/TiO2 composite samples A: 13C MAS NMR spectra;
B: 13C MAS NMR cross polarization spectra; C: 1H MAS NMR a: GO; b: fresh 10w% GO/TiO2; c: recovered 10w% GO/TiO2.
Contrary to the fresh composite, the recovered sample showed significant differences compared to starting GO; it lost its functional groups (cf. spectrum a and c in Fig. 3A).
Furthermore, significant decrease of the carbon content was indicated by the less intense signals and the need of the increased time of measurement. In addition, CP spectra could not be recorded over this sample which suggested that magnetic susceptibility and/or dielectric parameters of the 10w% GO/TiO2 composite also changed drastically.
Results of 1H MAS NMR measurements are presented in Fig. 3C. Signals of aromatic (~7 ppm) and to heteroatom connected aliphatic (~3.5 ppm) protons can identified
14 on the spectrum of GO (line a in Fig. 3C). Spectra of fresh and recovered composites (lines b, c in Fig. 3C) fit to the characteristic spectrum of TiO2 [62]. In the composites water could be present related to TiO2 by adsorption and to GO sheets by intercalation which cannot be distinguished. In case of the recovered sample the signal intensity decreases and at 5 ppm in the region of bridged OH groups and adsorbed water a narrower band appears, while the loosely bonded broad water signal vanishes. This observation suggests that the recovered composite sample has more hydrophobic character than the fresh one in accordance with the removal of O-containing functional groups which was indicated by 13C MAS NMR. Parallel, newly formed terminal OH groups (0-2 ppm) can provide certain hydrophilicity for the composite.
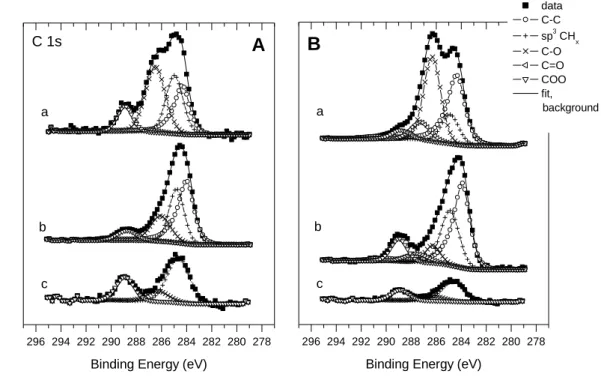
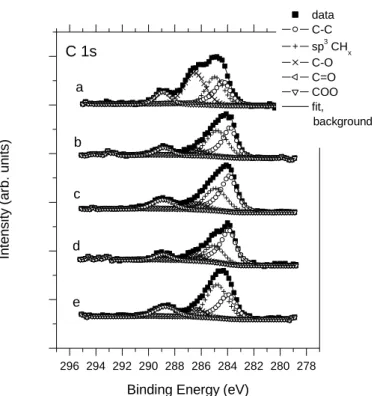
Composition of the parent GO and the fresh and recovered photocatalysts as well as the bonding environment of the components were also investigated by X-ray photoelectron spectroscopy. Fig. 4 shows the C 1s XPS spectra of unsupported GO in the as received state (line a) and after reduction in H2 for 1h (line b). Deconvolution of the spectra was carried out by considering quantitative relationships with the corresponding O 1s spectra [63, 64]. In the case of the initial GO sample, the two-peaked spectrum contains a broad, slightly asymmetric feature around 284.4 eV, which can be assigned to carbon atoms participating in C-C bonds.
Its large width probably indicates a distribution of slightly different local environments due to the disturbing effect of the neighboring oxygen-containing functional groups [64]. The other main feature around 286.2 eV is due to carbon atoms singly bonded to oxygen, such as in sp2 or sp3 C-OH or C-O-C in cyclic ethers. A small peak around 285.0 eV can be assigned to sp3 CHx species or defect sites in aromatic environments [64]. Finally, a weak contribution around 287.4 eV indicates the presence of carbonyl functionalities. XPS data are in good agreement with NMR as both techniques indicate alcoholic and carbonyl-like functional groups as the main oxygen-containing moieties in GO.
Reduction at 300 °C in H2 for 1 h results in a very significant loss of oxygen- containing functional groups of unsupported GO and leads to the appearance of a graphite- like spectrum. This can be explained well by the complete thermal decomposition of graphite oxide because the annealing temperature exceeds the deflagration temperature of Brodie-GO [29] of ca. 275 °C. The asymmetric main component of the spectrum of Fig. 4 arises at 284.4 eV and is accompanied by characteristic energy loss features shifted by some 6 eV from the main peak as a result of π-π* excitations in the aromatic system. Nevertheless, small contributions around 285.0 eV (hydrocarbon-like moieties or defect sites in the graphite planes), 286.3 eV (C-O bonds in alcoholic or ether groups), 287.5 eV (C=O groups) and 289.1
15 eV (carboxylic groups) are still present. These structural parameters are in accordance with the common observation that the carbon material formed upon thermal degradation still contains oxygenated functional groups [64, 65].
295 290 285 280
b a
C 1s
data C-C sp3 CHx C-O C=O COO fit, background
Intensity (arb. units)
Binding Energy (eV)
Fig. 4 C 1s XPS spectra of GO in its initial state (a) and after reduction at 300 °C in hydrogen for 1 h (b)
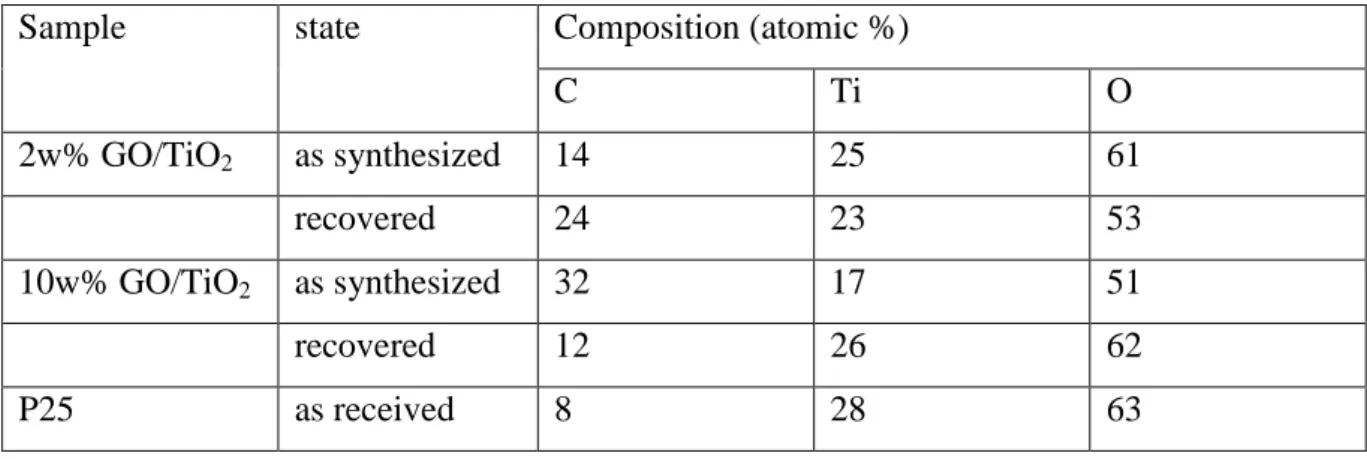
In Fig. 5 C 1s spectra of the 2% (A) and the 10w% GO/TiO2 (B) samples are compared before and after the photocatalytic process. Evaluation of the data is complicated by the fact that even the pristine P25 powder contains a significant amount of carbonaceous contaminants. The C 1s spectrum of this contamination is shown after scaling according to the C/Ti ratio as the lowermost curves both in (A) and (B) panels. A quantitative evaluation of the composition of the samples is given in Table 2.
Table 2. A quantitative evaluation of the composition of the samples based on XPS data
Sample state Composition (atomic %)
C Ti O
2w% GO/TiO2 as synthesized 14 25 61
recovered 24 23 53
10w% GO/TiO2 as synthesized 32 17 51
recovered 12 26 62
P25 as received 8 28 63
16
296 294 292 290 288 286 284 282 280 278
A
c b a C 1s
Intensity (arb. units)
Binding Energy (eV)
296 294 292 290 288 286 284 282 280 278 c
b a
B
data C-C sp3 CHx C-O C=O COO fit, background
Binding Energy (eV)
Fig. 5 C 1s XPS spectra of the 2w% (A) and the 10w% GO/TiO2 (B) samples in the fresh (curve a) and recovered (curve b) state. C 1s region of the bare P25 TiO2 is also shown indicating the presence of adventitious hydrocarbon contamination (curve c, intensity is scaled according to the C/Ti ratio).
Spectra of the GO/TiO2 samples were analyzed by deconvolution using the components found already in the spectra of the original and the reduced GO. This analysis suggests that the main contribution to the spectra of the fresh samples in both the 2w% and 10w% cases comes from a double-peaked feature with maxima at 284.3 and 286.3 eV, which corresponds to the C-C and C-O peaks from the spectrum of GO. The relatively strong peak at 284.9 eV and the weaker one at 288.9 eV in the spectrum of the 2w% sample can be assigned to the contamination on the TiO2 (hydrocarbon and carboxyl, respectively). The same contamination-related peaks appear at a much smaller relative intensity in the case of the as synthesized 10w% sample, in agreement with its expected higher GO content. The fact that GO-like features can be identified in the C 1s spectra of the GO/TiO2 photocatalysts confirms that the exfoliation resulted in no drastic change of the functionalities of GO, as already indicated by ATR-IR and NMR.
Regardless to the initial GO content, very similar changes are observed in the recovered samples. A very significant loss of the C-O-type contribution (286.3 eV) occurs and
17 the graphite-like C-C contribution becomes the dominating spectral feature along with a shift to binding energies slightly below 284.0 eV. The hydrocarbon peak at 284.8 eV remains strong. The observed changes are qualitatively similar to those reported previously for GO/TiO2 photocatalysts used for photocatalytic degradation of phenol [52]. In case of the 2w% sample the carbon content somewhat increased during the photocatalytic reaction, while a drastic decrease was found in the 10w% case.
3.2 Model experiments for identifying the processes leading to structural transformation of the GO/TiO2 composite during photocatalytic methanol reforming
Comparison of fresh and recovered samples by UV-Vis, MAS NMR and XPS techniques (Chapter 3.1) revealed that the GO/TiO2 composite did not keep its structure under the conditions of the photocatalytic reaction. Physical removal of GO sheets during the long time stirring was just as imaginable as the reduction of GO by the alcohol in the slurry and/or by the reaction product i.e. the in situ formed hydrogen. UV-induced degradation of the carbonaceous material also could not be excluded.
Fig. 6 Rate of H2 formation in model experiments with specially treated catalysts after 240 min reaction time. For abbreviations see the experimental part
In an attempt to study the effect of these probably parallel processes separately, catalyst samples were specially treated to model their influence (see experimental part).
Photocatalytic behavior of the model system prepared by agitation in the non-illuminated
18 reaction mixture (A-GO/TiO2 (Fig. 6)) indicated that long term stirring of the slurry in dark had significant negative effect on the activity of H2 formation in accordance with the supposed mechanical disintegration of the composite. The sample obtained using UV-treated GO (UV-GO/TiO2) showed also strongly decreased activity, while the hydrothermal treated sample (HT-GO/TiO2) was as active as the starting composite prepared by heterocoagulation.
During the hydrothermal treatment the composite obtained by heterocoagulation was transformed into a stable form, because it maintained the activity of the parent composite;
even long-term agitation did not reduce its activity (see AHT-GO/TiO2 in Fig. 6). These findings strongly imply that the strength of electrostatic forces between the oppositely charged TiO2 particles and GO platelets decrease in aqueous methanol solution in contrast to pure water phase. The presence of the alcohol changes both the dielectric and solvation properties of the medium and causes a significant effect on the structure of the electric double layer developed at the surface of charged colloidal particles. However, the fact the hydrothermally treated samples retain their nanostructure shows that under these conditions stronger bonds form between the counterparts of the composite sample.
Regarding the color of fresh and recovered model samples, the most striking observation was the appearance of dark color in the fresh HT-GO/TiO2 which then did not change significantly during the photocatalytic reaction. The other model samples behaved very similarly to the parent 2w% GO/TiO2; strong darkening was observed during the photocatalytic reaction regardless of the degree of development of the H2. For further details see the Electronic Supplementary Materials.
ATR-IR spectra of model catalysts are presented in Fig. 7.
19 Fig. 7 ATR-IR spectra of model catalysts
a: fresh UV-GO/TiO2, b: fresh HT-GO/TiO2, c: recovered A-GO/TiO2, d: recovered AHT- GO/TiO2, e: recovered UV-GO/TiO2. For abbreviations see the experimental part
It can be seen that UV irradiation of the parent composite in dry condition (cf. line b in Fig. 7 and line c in Fig. 3A) removed certain functional groups of the initial sample (-OH, C=O, C-O). Agitation did not result in significant change of the spectra of the recovered composite (cf. line c in Fig. 7 and line b in Fig. 3B), however, the relative intensity of C-O bands (1250-800 cm-1) was increased (for comparison all spectra were normalized to the highest Ti-O band around 628 cm-1; not shown). It seems plausible that the GO framework fractures were followed by formation of end C-OH groups. The same phenomenon was witnessed also in the case of hydrothermal treated agitated and recovered sample (see line d in Fig. 7). Moreover, the relative intensity of asCOO- (around 1572 cm-1) of recovered UV and HT treated spectra is also increased, suggesting a small change in GO geometry.
In Fig. 8 C 1s XPS spectra of the model samples recovered after the photocatalytic methanol reforming reaction are compared with that of the parent 2w% GO/TiO2 catalyst. In addition, spectrum for the fresh HT-GO/TiO2 is also shown. The spectra of the recovered catalysts are generally similar, containing mainly graphitic and hydrocarbon-like contributions; the relative amount of oxidized carbon species becomes small. This overall
20 reduction correlates well with the observed darkening of all model samples. Even agitation in the reaction mixture is enough for disruption of the original GO structure, which results in a very significant loss of the C-O functionalities. In the spectra of the hydrothermally treated catalysts both in the fresh and the recovered state the dominant contribution arises from graphitic carbon; its binding energy around 284.0 eV suggests the pronounced coupling of the carbon skeleton to TiO2 during the treatment. According to the XPS data, the least graphitic system is the UV-illuminated sample; the spectra suggest that illumination in the absence of the reaction mixture produces hydrocarbon-like species, which have lost their cocatalytic activity. The carboxyl-like contribution around 289 eV can most probably be assigned to the inevitable adventitious hydrocarbon contamination.
296 294 292 290 288 286 284 282 280 278 e
d c b a C 1s
data C-C sp3 CHx C-O C=O COO fit, background
Intensity (arb. units)
Binding Energy (eV)
Fig. 8 XPS spectra of the 2w% GO/TiO2 samples used in the model experiments
a: parent 2w% GO/TiO2; b: recovered A-GO/TiO2; c: fresh HT-GO/TiO2; d: recovered HT- GO/TiO2; e: recovered UV-GO/TiO2. For abbreviations see the experimental part
3.3 Role of GO/TiO2 transformation during the photocatalytic reaction
Comparison of fresh and recovered composites obtained by heterocoagulation (Chapter 3.1) showed that the liquid phase working form of the catalyst evolved in situ under
21 the conditions of the photocatalytic reaction. The most important changes affected the GO part of the composite. These were the removal of the O containing functional groups (demonstrated by 13C MAS NMR results) and graphitization (shown by XPS). It's worth mentioning that GO lost its functional groups by UV irradiation in model catalyst UV- GO/TiO2 similarly to GO/TiO2 did under the photocatalytical conditions, however the beneficial effect in the former case was missing. Most likely the remaining carbon skeleton was different.
It also could be concluded that transformation of GO itself was not the only factor in the achievement of higher H2 formation compared to the bare TiO2. As the darkening in the recovered model samples did not bring increased H2 production in every case, a specific transformation had to be assumed.
Results of 13C MAS NMR and XPS measurements on recovered samples presented loss of carbon content indicating that certain physical degradation occurred due to agitation under the photocatalytical conditions of (i.e. long time stirring in aqueous reaction mixture) which was confirmed by the photocatalytic behavior of model sample A-GO/TiO2. Despite the above effect which had obviously negative influence on the H2 production, the composite sample obtained by heterocoagulation kept its activity. This probably happened because other factors had offset; such a factor could be the formation of a strong Ti-O-C interaction.
According to the literature this kind of strong Ti-O-C interaction develops on points of the GO sheets from where functional groups were removed by the hydrothermal treatment [46- 47]. In addition, the UV-assisted photocatalytic reduction of graphene oxide for preparation of R-GO/TiO2 composites is a well-known method [66], during which TiO2 and GO is irradiated in a slurry in a reductive medium i.e. ethanol. We believe in the UV-treated model sample (UV-GO/TiO2), depletion of functional groups did not allow such a linkage in the subsequent reaction and/or the damaged carbon skeleton prevented the formation of the preferred RGO structure. Similarly, agitation in the non-illuminated reductive reaction mixture may have resulted in too much damage in the carbon structure, so the beneficial Ti-O-C coupling only partly formed during the subsequent photocatalytic process.
In the hydrothermally treated composite sample (HT-GO/TiO2) the structure coupled with electrostatic interactions was transformed into TiO2-bound RGO prior to the photocatalytic reaction. This strong connection provided stability against mechanical effects too, which explained that model sample AHT-GO/TiO2 was as active as the starting one.
Moreover, the differences in the hydrogen formation rate - reaction time dependencies which were obtained upon using the parent 2%GO/TiO2 or the hydrothermal treated (HT-GO/TiO2)
22 photocatalysts (see chapter “2.4S Time dependence of H2 production rate” in the Electronic Supplementary Materials) provided evidences for the in situ changes of the GO/TiO2 catalysts during the photocatalytic reaction.
ATR-IR results suggest that presence of GO contributes to the activation of TiO2; ordered OH groups of TiO2 appeared in the recovered samples prepared by heterocoagulation.
Cao and coworkers [67] reported that OH-TiO2@TiO2 nanocrystal heterojunctions formed on RGO sheets enhanced the photocatalytic activity. In another work hydroxylation of the semiconductor was mentioned to prevent the closure of the photocatalytic cycle [68]. Further investigations are needed to decide whether the newly formed ordered OH groups in the recovered heterocoagulated samples, which were absent in the bare TiO2 and the catalysts treated for the model experiments, played a certain role in the activity enhancement or not.
Although RGO/TiO2 composites have been widely used as photocatalysts for different reactions, a new study proved that RGO was not a universal promoter [69]. The factor of photocatalytic activity enhancement was strongly affected by the various functional groups appearing in the organic substances. The length of alkyl chain in alcohols and carboxylic acids had minimal influence on the overall activity while the number of hydroxyl groups could promote the activity enhancement in the presence of RGO. The enhancement factor for RGO/TiO2 (5w% loading) in the mineralization of MeOH was only 1.1 [69]. The enhancement effect of the carbonaceous part in our composites was also relatively moderate compared to that of Pt co-catalyst (near 20 times less). However introduction of a small amount of Pt could result in a synergistic effect [26], this way the Pt demand could be reduced significantly. Consequently, the GO may become an important material which could make the photocatalyst cheaper; that’s why understanding its behavior in composites is essential.
4. Summary
GO/TiO2 composites prepared by heterocoagulation from Brodie type GO were active as catalyst in the photocatalytic reforming of methanol. Diffuse reflectance UV-Vis, ATR-IR,
13C MAS NMR and XPS spectroscopic measurement of fresh and recovered samples revealed that these composites underwent structural transformation (such as mechanical degradation, reduction and graphitization) during the photo-induced reaction. Model experiments with specially pre-treated photocatalysts suggested that in situ development of a strong chemical coupling between the reduced graphene oxide sheets and TiO2 may be the key factor for the beneficial co-catalytic effect of the GO. This process is analogous to the strong Ti-O-C formation reported in RGO/TiO2 composites obtained by UV-assisted photocatalytic
23 reduction in ethanol, which is confirmed by the fact that the fresh GO/TiO2 composites could be transformed into highly active and more stable form by hydrothermal treatment.
References
1. Mazloomi K, Gomes C (2012) Hydrogen as an energy carrier: Prospects and challenges. Renew Sustainable Energy Rev 16:3024-3033
2. Cipriani G, Di Dio V, Genduso F, Cascia D, Liga R, Miceli R, Galluzzo GR (2014) Perspective on hydrogen energy carrier and its automotive applications. Int J Hydrogen Energy 39:8482-8494
3. Sharma S, Ghoshal SK (2015) Hydrogen the future transportation fuel: From production to applications. Renew Sustainable Energy Rev 43:1151-1158
4. Kandiel TA, Dillert R, Robben L, Bahnemann DW (2011) Photonic efficiency and mechanism of photocatalytic molecular hydrogen production over platinized titanium dioxide from aqueous methanol solutions. Catal Today 161:196-201
5. Fujishima A, Honda K (1972) Electrochemical photolysis of water at a semiconductor electrode. Nature 238:37-38
6. Chen X, Mao SS (2007) Titanium dioxide nanomaterials: synthesis, properties, modifications, and applications. Chem Rev 107:2891-2959
7. Fujishima A, Zhang X, Tryk DA (2008), TiO2 photocatalysis and related surface phenomena. Surf Sci Reports 63:515-582
8. Ni M, Leung MKH, Leung DYC, Sumathy K (2007) A review and recent
developments in photocatalytic water-splitting using TiO2 for hydrogen production.
Renew Sust Energ Rev 11:401-425
9. Chen X, Shen S, Guo L, Mao SS (2010) Semiconductor-based photocatalytic hydrogen generation. Chem Rev 110:6503-6570
10. Verbruggen SW (2015) TiO2 photocatalysis for the degradation of pollutants in gas phase: From morphological design to plasmonic enhancement. J Photoch Photobio C 24:64-82
11. Lin HS, Chiou CH, Chang CK, Juang RS (2011) Photocatalytic degradation of phenol on different phases of TiO2 particles in aqueous suspensions under UV irradiation. J Environ Manage 92:3098-3104
12. Kun R, Mogyorósi K, Dékány I (2006) Synthesis and structural and photocatalytic properties of TiO2/montmorillonite nanocomposites. Appl Clay Sci 32:99-110
24 13. Kőrösi L, Papp Sz, Ménesi J, Illés E, Zöllmer V, Richardt A, Dékány I (2008)
Photocatalytic activity of silver-modified titanium dioxide at solid–liquid and solid–
gas interfaces. Colloids and Surfaces A: Physicochem Eng Aspects 319:136-142 14. Naldoni A , D’Arienzo M, Altomare M, Marelli M, Scotti R, Morazzoni F, Selli E,
Dal Santo V (2013) Pt and Au/TiO2 photocatalysts for methanol reforming: Role of metal nanoparticles in tuning charge trapping properties and photoefficiency. Appl Catal B: Environmental 130-131:239-248
15. Tálas E, Pászti Z, Korecz L, Domján A, Németh P, Szíjjártó GP, Mihály J, Tompos A (2017) PtOx-SnOx-TiO2 catalyst system for methanol photocatalytic reforming:
Influence of cocatalysts on the hydrogen production Catal Today in press https://doi.org/10.1016/j.cattod.2017.02.009
16. Al-Mazroai LS, Bowker M, Davies P, Dickinson A, Greaves J, James D, Millard L (2007) The photocatalytic reforming of methanol, Catal Today 122:46-50
17. Cui W, Feng L, Xu C, Lü S, Qiu F (2004) Hydrogen production by photocatalytic decomposition of methanol gas on Pt/TiO2 nano-film. Catal Commun 5:533-536 18. Lin WC, Yang WD, Huang IL, Wu TS, Chung ZJ (2009) Hydrogen production from
methanol/water photocatalytic decomposition using Pt/TiO2−xNx catalyst. Energy Fuels 23:2192-2196
19. Linsebigler AL, Lu G, Yates JT Jr (1995) Photocatalysis on TiO2 surfaces: principles, mechanisms, and selected results. Chem Rev 95 (1995) 735-758.
20. Yang J, Wang D, Han H, Li C, Roles of cocatalysts in photocatalysis and
photoelectrocatalysis. Acc Chem Res 46:1900-1909 and the references cited herein 21. Gupta B , Melvin AA, Matthews T, Dash S, Tyagi AK (2016) TiO2 modification by
gold (Au) for photocatalytic hydrogen (H2) production. Renew Sustainable Energy Rev 58:1366-1375
22. Krissanasaeranee M, Wongkasemjit S, Cheetham AK, Eder D (2010) Complex carbon nanotube-inorganic hybrid materials as next-generation photocatalysts. Chem Phys Lett 496:133-138
23. Cruz M, Gomez C, Duran-Valle CJ, Pastrana-Martínez LM, Faria JL, Silva AMT, Faraldos M, Bahamonde A (2017) Bare TiO2 and graphene oxide TiO2 photocatalysts on the degradation of selected pesticides and influence of the water matrix. Appl Surf Sci in press doi.org/10.1016/j.apsusc.2015.09.268
25 24. Chen D, Zou L, Li S, Zheng F (2016) Nanospherical like reduced graphene oxide
decorated TiO2 nanoparticles: an advanced catalyst for the hydrogen evolution reaction https://www.nature.com/articles/srep20335.pdf Acessed 01 Febr 2016 25. Faraldos M, Bahamonde A (2017) Environmental applications of titania-graphene
photocatalysts. Catal Today 285:13-28
26. Park Y, Kang SH, Choi W (2011) Exfoliated and reorganized graphite oxide on titania nanoparticles as an auxiliary co-catalyst for photocatalytic solar conversion. Phys Chem Chem Phys 13:9425-9431
27. Brodie BC (1859) On the atomic weight of graphite. Phil Trans R Soc Lond 149:249- 259
28. Hummers WS, Offeman RE, (1958) Preparation of graphitic oxide. J Am Chem Soc 80:1339-1339
29. Szabó T, Berkesi O, Forgó P, Josepovits K, Sanakis Y, Petridis D, Dékány I (2006) Evolution of surface functional groups in a series of progressively oxidized graphite oxides. Chem Mater 18:2740-2749
30. You S, Luzan SM, Szabó T, Talyzin AV (2013) Effect of synthesis method on solvation and exfoliation of graphite oxide. Carbon 52:171-180
31. Marcano DC, Kosynkin DV, Berlin JM, Sinitskii A, Sun Z, Slesarev A, Alemany LB, Lu W, Tour JM (2010) Improved synthesis of graphene oxide. ACS Nano 4:4806- 4814
32. Dimiev AM, Alemany LB, Tour JM (2013) Graphene oxide. Origin of acidity, its instability in water, and a new dynamic structural model. ACS Nano 7: 576-588 33. Szabó T, Tombácz E, Illés E, Dékány I (2006) Enhanced acidity and pH dependent
surface charge characterisation of successively oxidized graphite oxides. Carbon 44:357-545
34. Lerf A, He H, Foster M, Klinowski J (1998) Structure of graphite oxide revisited. J Phys Chem B 102:4477-4482
35. Lerf A, Buchsteiner A, Pieper J, Schöttl S , Dekany I , Szabo T, Boehm HP (2006) Hydration behavior and dynamics of water molecules in graphite oxide. J Phys Chem Solids 67:1106-1110
36. Zhang N, Yang MQ, Liu S, Sun Y, Xu YJ (2015) Waltzing with the versatile platform of graphene to synthesize composite photocatalysts. Chem Rev 115:10307- 10377
26 37. Zhang H, Lv X, Li Y, Wang Y, Li J (2010), P25-Graphene composite as a high
performance photocatalyst. ACS Nano 4:380-386
38. Pan X, Zhao Y, Liu S, Korzeniewski CL, Wang S, Fan Z (2012) Comparing graphene- TiO2 nanowire and graphene-TiO2 nanoparticle composite photocatalysts. ACS Appl Mater Interfaces 4:3944-3950
39. Liang Y, Wang H, Casalongue HS, Chen Z, Dai H (2010) TiO2 nanocrystals grown on graphene as advanced photocatalytic hybrid materials. Nano Res 3:701-705
40. Zhang Q, He YQ, Chen XG, Hu DH, Li LJ, Yin T, Ji LL (2011) Structure and
photocatalytic properties of TiO2-Graphene Oxide intercalated composite. Chinese Sci Bull 56:331-339
41. Ismail AA, Geioushy RA, Bouzid H, Al-Sayari SA, Al-Hajry A, Bahnemann DW (2013) TiO2 decoration of graphene layers for highly efficient photocatalyst: Impact of calcination at different gas atmosphere on photocatalytic efficiency. Appl Catal B:
Environmental 129:62-70
42. Fan W, Lai Q, Zhang Q, Wang Y (2011) Nanocomposites of TiO2 and reduced graphene oxide as efficient photocatalyst for hydrogen evolution. J Phys Chem C 115:10694-10701
43. Minella M, Sordello F, Minero C (2017) Photocatalytic process in TiO2/graphene hybrid materials. Evidence of charge separation by electron transfer from reduced graphene oxide to TiO2. Catal Today 281:29-37
44. Al-Kandari H, Abdullah AM, Al-Kandari S, Mohamed AM (2015) Effect of the graphene oxide reduction method on the photocatalytic and electrocatalytic activities of reduced graphene oxide/TiO2 composite. RSC Adv 5:71988-71998
45. Ding H, Zhang S, Chen JT, Hu XP, Du ZF, Qiu YX, Zhao DL (2015) Reduction of graphene oxide at room temperature with vitamin C for RGO–TiO2 photoanodes in dye-sensitized solar cell. Thin Solid Films 584:29-36
46. Zhang Y, Tang ZR, Fu X, Xu YT (2010) TiO2-graphene nanocomposites for gas- phase photocatalytic degradation of volatile aromatic pollutant: is TiO2-graphene truly different from other TiO2-carbon composite materials? ACS Nano 4:7303-7314 47. Zhuang W, He L, Zhu J, An R, Wu X, Mu L, Lu X, Lu L, Liu X, Ying H (2015) TiO2
nanofibers heterogeneously wrapped with reduced graphene oxide as efficient Pt electrocatalyst support for methanol oxidation. Int J Hydrogen Energy 40:3679-3688
27 48. Leong KH, Sim LC, Bahnemann D, Jang M, Ibrahim S, Saravanan P (2015) Reduced
graphene oxide and Ag wrapped TiO2 photocatalyst for enhanced visible light photocatalysis. Apl Mater 3. Doi: 10.1063/1.4926454
49. Zeng P, Zhang Q, Zhang X, Peng T (2012) Graphite oxide–TiO2 nanocomposite and its efficient visible-light-driven photocatalytic hydrogen production. J Alloys Comp 516:85-90
50. Vasilaki E, Georgaki I, Vernardou D, Vamvakaki M, Katsarakis N (2015) Ag-loaded TiO2/reduced graphene oxide nanocomposites forenhanced visible-light photocatalytic activity. Appl Surf Sci 353:865-872
51. Kamat PV (2010) Graphene-based nanoarchitectures anchoring semiconductorand metal nanoparticles on a two-dimensional carbon support. J Phys Chem Lett 1:520- 527
52. Szabó T, Veres Á, Cho E, Khim J, Varga N, Dékány I (2013) Photocatalyst separation from aqueous dispersion using graphene oxide/TiO2 nanocomposites. Coll Surf A Physicochem Eng Aspects 433:230-239
53. Preočanin T, Kallay N (2006) Point of zero charge and surface charge density of TiO2 in aqueous electrolyte solution as obtained by potentiometric mass titration. Croat Chem Acta 79:95-106
54. Vass Á, Pászti Z, Bálint Sz, Németh P, Szíjjártó GP, Tompos A, E. Tálas E (2016) Structural evolution in Pt/Ga-Zn-oxynitride catalysts for photocatalytic reforming of methanol. Mater Res Bull 83:65-76
55. Hartmann SR, Hahn EL (1962) Nuclear double resonance in the rotating frame. Phys Rev 128: 2042-2053.
56. Fung BM, Khitrin AK and Ermolaev KJ (2000) An improved broadband decoupling sequence for liquid crystals and solids. J Magn Reson 142:97-101
57. Moulder JF, Stickle WF, Sobol PE, Bomben KD (1992) Handbook of X-Ray Photoelectron Spectroscopy. Perkin-Elmer Corp, Eden Prairie, Minnesota, USA 58. Wagner CD, Naumkin AV, Kraut-Vass A, Allison JW, Powell CJ, Rumble JR Jr
(2003) NIST X-ray Photoelectron Spectroscopy Database, Version 3.4. National Institute of Standards and Technology, Gaithersburg, MD http://srdata.nist.gov/xps/
59. CasaXPS: Processing Software for XPS, AES, SIMS and More (2016) Casa Software Ltd. www.casaxps.com
60. Mohai M (2004) XPS MultiQuant: Multimodel XPS Quantification Software. Surf Interface Anal 36:828-832
28 61. El-Bery HM, Matsushita Y, Abdel-moneim A (2017) Fabrication of efficient TiO2-
RGO heterojunction composites for hydrogen generation via water-splitting:
Comparison between RGO, Au and Pt reduction sites. Appl Surf Sci 423:185-196 62. Jiang Y, Scott J, Amal R, (2012) Exploring the relationship between surface structure
and photocatalytic activity of flame-made TiO2-based catalysts. Appl Catal B:
Environmental 126: 290-297
63. Stobinski L, Lesiak B, Zemek J, Piricek K, (2012): Time dependent thermal treatment of oxidized MWCNTs studied by the electron and mass spectroscopy methods. Appl Surf Sci 258:7912-7917
64. Yamada Y, Yasuda H, Murota K, Nakamura M, Sodesawa T, Sato S (2013) Analysis of heat-treated graphite oxide by X-ray photoelectron spectroscopy. J Mater Sci 48:8171-8198
65. Yang D, Velamakanni A, Bozoklu G, Park S, Stoller M, Piner RD, Stankovich S, Jung I, Field DA, Ventrice CA Jr., Ruoff RS (2009) Chemical analysis of graphene oxide films after heat and chemical treatments by X-ray photoelectron and Micro-Raman spectroscopy. Carbon 47:145-152
66. Yang WD, Li YR, Lee YC (2016) Synthesis of r-GO/TiO2 composites via the UV- assisted photocatalytic reduction of graphene oxide. Appl Surf Sci 380:249-256 67. Cao S, Liu T, Tsang Y, Chen C (2016) Role of hydroxylation modification on the
structure and property ofreduced graphene oxide/TiO2 hybrids. Appl Surf Sci 382:225- 238
68. Emeline AV, Ryabchuk VK, Serpone N (2007) Photoreactions occurring on metal- oxide surfaces are not all photocatalytic. Description of criteria and conditions for processes to be photocatalytic. Catal Today 122: 91-100
69. Tan HL, Denny F, Hermawan M, Wong RJ, Amal R, Ng YH (2017) Reduced graphene oxide is not a universal promoter for photocatalytic activities of TiO2. J Materiomics 3:51-57
29
SUPPLEMENTARY MATERIAL
Graphite oxide-TiO2 nanocomposite type photocatalyst for methanol photocatalytic reforming reaction
Katalin Majrik2, Árpád Turcsányi1, Zoltán Pászti2, Tamás Szabó1, Attila Domján3, Judith Mihály2, András Tompos2, Imre Dékány1, Emília Tálas2
1Department of Physical Chemistry and Materials Science, University of Szeged, H-6720 Szeged, Aradi vértanúk tere 1, Hungary,
2Institute of Materials and Environmental Chemistry, Research Centre for Natural Sciences, Hungarian Academy of Sciences, H-1117 Budapest, Magyar tudósok körútja 2, Hungary,
3NMR Research Group, Research Centre for Natural Sciences, Hungarian Academy of Sciences, H-1117 Budapest Magyar tudósok körútja 2, Hungary,
1S. Experimental
1.1S Preparation of reference catalysts
Pt(NH3)4(NO3)2 (Aldrich) was used as a precursor of supported Pt nanoparticles.
AgNO3 was purchased from Molar (Hungary) as analytical grade chemical.
In order to prepare reference Pt/TiO2 catalyst P25 was impregnated by aqueous solution of Pt(NH3)4(NO3)2. The dried sample with 0.5% w Pt load was reduced for 1 hour at 400oC in H2 flow. The Ag/TiO2 reference catalysts were made by mixing the dispersion of TiO2 and aqueous solution of AgNO3. Silver was reduced by adding freshly made sodium borohydride solution (5:1 molar ratio (4x excess) in respect of silver) to the catalyst dispersions. After centrifuging the samples were dried at 50°C then crushed into powder.
1.2S Sample preparation for model experiments
In order to simulate the effect of each assumed process which can contribute to the structural changes of the heterocoagulated GO/TiO2 composites under the conditions of the photocatalytic reaction, model samples were prepared by certain treatments of the fresh GO/TiO2 composite. In order to simulate the physical removal of GO sheets from the composites and their rupture, the fresh sample of 2w% GO/TiO2 was stirred for a week at room temperature in the aqueous methanol reaction mixture in dark. This agitated sample was denominated as A-GO/TiO2 and it was used in the same reaction mixture in which it was prepared. Removal of functional groups and reduction of carbon skeleton can also occur in the methanol solution during the photoinduced reaction. In order to get a model sample representing this process the fresh composite of 2w% GO/TiO2 underwent a hydrothermal
Corresponding author, Tel.: +36 1 382 6916, email: talas.emilia@ttk.mta.hu, address: H-1519 Budapest, P.O.Box 286, Hungary (Emília Tálas)
30 treatment at 120°C for 24h in an N2 rinsed autoclave in ethanol/water 1:1 mixture similarly to the procedure used for composite preparation from Hummer’s GO [1]. This hydrothermally treated sample was denominated as HT-GO/TiO2. Model sample AHT-GO/TiO2 was obtained by agitation of HT-GO/TiO2and it also was used in the same reaction mixture in that it was stirred. In order to show the sole effect of UV irradiation during the photoinduced reaction the dry sample of the fresh 2w% GO/TiO2 was exposed to UV irradiation (430 nm) for 2h. The UV irradiated model sample was denominated as UV-GO/TiO2.
1.3S Sample characterization
Diffuse reflectance UV-visible spectra of the samples were registered using a Jasco V- 570 UV-VIS spectrophotometer equipped with a NV-470 type integrating sphere. The data were collected between 800 and 200 nm wavelengths with 100 nm/min speed.
2S. Results
2.1S Characterization of the fresh and recovered photocatalysts
Fig. 1S Diffuse reflectance UV -Vis spectra of the fresh and recovered samples A: GO/TiO2 composites; B: TiO2;
a: fresh 1w% GO/TiO2; b: fresh 2w% GO/TiO2; c: fresh 10w% GO/TiO2; d: recovered 1w%
GO/TiO2; e: recovered 2w% GO/TiO2; f: recovered 10w% GO/TiO2; g: pristine TiO2; h:
blank TiO2 fresh; i: recovered TiO2; j: recovered blank TiO2
Fig. 1S shows the diffuse-reflectance UV-Vis spectra of the fresh and recovered photocatalysts. The absorbance of the fresh GO/TiO2 samples was proportional to the carbon content (cf. line a, b, c in Fig.1S) as has been described in the literature [2, 3]. The recovered samples showed much higher absorption than the fresh ones, especially in the visible region and these values were also proportional to the initial carbon content of the composites (cf. line d, e, f in Fig. 1S). At the same time the color change of pristine TiO2 and blank TiO2 (see Fig.
0.0 0.2 0.4 0.6 0.8 1.0
300 500 700 900
Absorbance(arbitrary units)
Wavelength (nm) a b c d e
f A
0.0 0.2 0.4 0.6 0.8 1.0
300 500 700 900
Absorbance(arbitrary units)
Wavelength (nm) h
j g
i
B