II in Oriented Lipid Bilayers: Theory Meets Experiment
Parveen Akhtar, Dominik Lindorfer, Mónika Lingvay, Krzysztof Pawlak, Ottó Zsiros, Giuliano Siligardi, Tamás Jávorfi, Márta Dorogi, Bettina Ughy, Gyözö Garab, Thomas Renger, and Petar Haralampiev Lambrev
J. Phys. Chem. B, Just Accepted Manuscript • DOI: 10.1021/acs.jpcb.8b12474 • Publication Date (Web): 03 Jan 2019 Downloaded from http://pubs.acs.org on January 3, 2019
Just Accepted
“Just Accepted” manuscripts have been peer-reviewed and accepted for publication. They are posted online prior to technical editing, formatting for publication and author proofing. The American Chemical Society provides “Just Accepted” as a service to the research community to expedite the dissemination of scientific material as soon as possible after acceptance. “Just Accepted” manuscripts appear in full in PDF format accompanied by an HTML abstract. “Just Accepted” manuscripts have been fully peer reviewed, but should not be considered the official version of record. They are citable by the Digital Object Identifier (DOI®). “Just Accepted” is an optional service offered to authors. Therefore, the “Just Accepted” Web site may not include all articles that will be published in the journal. After a manuscript is technically edited and formatted, it will be removed from the “Just Accepted” Web site and published as an ASAP article. Note that technical editing may introduce minor changes to the manuscript text and/or graphics which could affect content, and all legal disclaimers and ethical guidelines that apply to the journal pertain. ACS cannot be held responsible for errors or consequences arising from the use of information contained in these “Just Accepted” manuscripts.
Anisotropic Circular Dichroism of Light-Harvesting Complex II in Oriented Lipid Bilayers: Theory
Meets Experiment
Parveen Akhtar†,‡, Dominik Lindorfer§, Mónika Lingvay†,#, Krzysztof Pawlak†,¦, Ottó Zsiros†, Giuliano Siligardi⊥, Tamás Jávorfi⊥, Márta Dorogi†, Bettina Ughy†, Győző Garab†,⋄, Thomas Renger§, Petar H. Lambrev†*
† Hungarian Academy of Sciences, Biological Research Centre, Temesvári krt. 62, 6726 Szeged, Hungary
‡ ELI-HU Nonprofit Kft., Budapesti út 5, 6728 Szeged, Hungary
§ Johannes Kepler University Linz, Institute for Theoretical Physics, Altenberger Str. 69, 4040 Linz, Austria
# University of Szeged, Faculty of Science and Informatics, Doctoral School of Physics, Dóm tér 9, 6720 Szeged, Hungary
⊥ Diamond Light Source Ltd., Harwell Science and Innovation Campus, Didcot, Oxfordshire OX11 0DE, U.K.
⋄ University of Ostrava, Faculty of Science, Department of Physics, Chittussiho 10, 710 00, Ostrava, Czech Republic
3 4 5 6 7 8 9 10 11 12 13 14 15 16 17 18 19 20 21 22 23 24 25 26 27 28 29 30 31 32 33 34 35 36 37 38 39 40 41 42 43 44 45 46 47 48 49 50 51 52 53 54 55 56
KEYWORDS
photosynthetic complexes, model membranes, optical spectroscopy, excitonic CD, exciton theory, oriented CD
ABSTRACT
Anisotropic circular dichroism (ACD) spectroscopy of macroscopically aligned molecules reveals additional information about their excited states that is lost in the CD of randomly-oriented solutions. ACD spectra of light-harvesting complex II (LHCII)—the main peripheral antenna of photosystem II in plants—in oriented lipid bilayers, were recorded from the far-UV to the visible wavelength region. The ACD spectra show a drastically enhanced magnitude and level of detail compared to the isotropic CD spectra, resolving a greater number of bands and weak optical transitions. Exciton calculations show that the spectral features in the chlorophyll Qy region are well reproduced by an existing Hamiltonian for LHCII, providing further evidence for the identity of energy sinks at chlorophylls a603 and a610 in the stromal layer and chlorophylls a604 and a613 in the luminal layer. We propose ACD spectroscopy to be a valuable tool linking the three- dimensional structure and the photophysical properties of pigment–protein complexes.
3 4 5 6 7 8 9 10 11 12 13 14 15 16 17 18 19 20 21 22 23 24 25 26 27 28 29 30 31 32 33 34 35 36 37 38 39 40 41 42 43 44 45 46 47 48 49 50 51 52 53 54 55 56
Introduction
In photosynthetic pigment–protein complexes (PPCs), electrostatic (Coulomb) interactions among pigment molecules give rise to partially delocalized molecular exciton states, which largely determine the photophysical and spectroscopic properties of the system.1,2 Light-harvesting complex II (LHCII), the major trimeric peripheral antenna of photosystem II (PSII), binds 14 chlorophylls (Chls) and 4 carotenoid xanthophylls per monomer.3 The spectral characteristics of protein-bound Chls are modulated by their protein environment giving rise to Chl forms having different transition (site) energies. In principle, all pigments in LHCII participate in all exciton states, but depending on the strength of coupling and site energies, only 1–3 Chls have a predominant contribution to a given state4. Since the publication of the LHCII crystal structure, several groups have applied structure-based approaches to calculate the exciton states.4-11 The site transition and interaction energies have been calculated for all Chls in the LHCII trimer—using atomic coordinates from the crystal structure and applying various approximations and theoretical approaches to construct the electronic Hamiltonian of the complex and evaluate the complete set of eigenstates.
The exciton model is refined by reconstructing a set of experimental optical spectroscopic data and finding the best fit. Standard optical measurements are linear absorption, fluorescence, circular dichroism (CD) and linear dichroism (LD) spectra. Among these, CD is the most sensitive to the exciton coupling strength and the mutual geometry of the coupled chromophores, thus it is a useful structural probe for multi-chromophore aggregates such as photosynthetic PPCs. Excitonic CD, in simple cases, can be easily recognized by a split conservative band structure—positive and negative bands with zero integrated area. It has been shown that the excitonic CD of LHCII depends strongly on the folding,12 pigment composition,13,14 oligomerization and aggregation
3 4 5 6 7 8 9 10 11 12 13 14 15 16 17 18 19 20 21 22 23 24 25 26 27 28 29 30 31 32 33 34 35 36 37 38 39 40 41 42 43 44 45 46 47 48 49 50 51 52 53 54 55 56
state15,16 of the complex and is widely used for characterizing isolated native and reconstituted complexes. The CD spectrum is also sensitive to the molecular environment.17,18
A few theoretical studies have been dedicated to modelling the visible-range CD spectrum of LHCII based on exciton theory. Georgakopoulou et al.19 were able to reproduce the main spectral features of trimeric and monomeric LHCII forms as well as alterations due to site-directed mutations affecting pigment binding. However, the model required considerable structural adjustments to reproduce the fine spectral details and showed that small changes in the degree of rotation of the transition dipole moments significantly alter the CD signal.
Untangling the underlying exciton structure from the CD spectra is evidently a challenge. In principle, this can be facilitated by measuring anisotropic (or oriented) CD (ACD)—the CD of molecules with fixed macroscopic spatial orientation. ACD has been developed and used with chiral anisotropic phases, such as liquid crystals, and for small chiral molecules.20,21 It has been shown to reveal additional independent structural information not contained in the isotropic CD.
Psi(polymer and salt-induced)-type and excitonic ACD spectra have been published for thylakoid membranes and PSII-enriched membranes22 but not for isolated LHCII, which is more difficult to align.
A clear example of using ACD to separately probe exciton transitions is the CsmA baseplate protein found in the chlorosome antenna of photosynthetic green-sulfur bacteria, where bacteriochlorophyll a effectively forms exciton dimers.23 The ACD spectra of the CsmA protein were theoretically calculated following the molecular exciton approach.24,25 More recently, a simplified theoretical description of ACD has been presented26 that can be of general use in the verification and optimization of structural models of such light-harvesting systems.
3 4 5 6 7 8 9 10 11 12 13 14 15 16 17 18 19 20 21 22 23 24 25 26 27 28 29 30 31 32 33 34 35 36 37 38 39 40 41 42 43 44 45 46 47 48 49 50 51 52 53 54 55 56
The aim of this work was to obtain high-fidelity reproducible ACD spectra in the visible, and far- and near-UV regions of macroscopically aligned isolated LHCII complexes. ACD spectra will help the understanding and interpretation of the excitonic CD features, providing additional physical information directly related to the structural and photophysical properties of the LHCII complex. This will reduce the number of free parameters in exciton calculations. To achieve this scope, we embedded LHCII trimers in lipid membranes orienting them as compressed gel slabs or surface-supported films. We show that the method greatly enhances the power and sensitivity of CD spectroscopy to resolve excitonic transitions. The qualitative features of the ACD spectra could be reproduced with an existing excitonic model and were proven more sensitive to changes in the model parameters than the CD spectra.
Experimental methods
Preparation of LHCII proteoliposomes
LHCII trimers were isolated by solubilizing PSII-enriched membrane fragments with 0.7% n- Dodecyl β-D-maltoside (β-DDM) followed by sucrose density gradient ultracentrifugation.27 Reconstituted membranes of LHCII and plant thylakoid lipids were prepared as described previously.28
Absorption and circular dichroism spectroscopy
Absorption spectra were recorded using an Evolution 500 dual-beam spectrophotometer (Thermo Scientific, USA). CD spectra in the visible region were recorded with a J-815 (Jasco, Japan) and a Chirascan Plus (Applied Photophysics, UK) spectropolarimeters. Absorption and CD spectra were recorded with spectral bandwidth of 1 nm and 3 nm, respectively. Measurements were carried out at room temperature. The samples were diluted in buffer to an absorbance of ca.
3 4 5 6 7 8 9 10 11 12 13 14 15 16 17 18 19 20 21 22 23 24 25 26 27 28 29 30 31 32 33 34 35 36 37 38 39 40 41 42 43 44 45 46 47 48 49 50 51 52 53 54 55 56
1 at the red maximum in the 600–700 nm region and placed in standard glass cuvettes of 1 cm optical path length.
Linear dichroism and anisotropic circular dichroism spectroscopy
Room-temperature LD and ACD spectra were recorded from macroscopically aligned samples.
LHCII membranes were aligned by polyacrylamide gel compression as in ref. 22 or by drying the vesicles on a quartz surface under N2 gas purging. The latter method promotes vesicle fusion into planar bilayer membrane patches. ACD was measured in face-aligned direction, with incident light parallel to the axis normal to the membrane plane (Supporting Figure S1). LD was measured in edge-aligned direction, with incident light perpendicular to the membrane normal.
Synchrotron-radiation circular dichroism spectroscopy
UV CD/ACD measurements were performed at the Diamond B23 Beamline for synchrotron radiation circular dichroism (SRCD). SRCD spectra were measured under purging N2 at room temperature in the range 180–540 nm. Liquid suspensions of the samples were placed in quartz cells with optical path length of 0.2 mm. Dry films with LHCII membrane patches were mounted on a Linkam motorized XY stage held on the vertical sample chamber29, where the incident beam was focused onto the membrane patches with a 10x microscope objective. In this manner, a 5x5 mm grid was scanned at 1 mm spatial intervals resulting in 25 SRCD spectra.
Results
We incorporated LHCII into lipid vesicles to facilitate the macroscopic orientation of the complexes and measured CD spectra in the visible as well as the far- and near-UV regions. CD in the visible region originates exclusively from the pigment cofactors, Chls and carotenoids, and is mostly due to excitonic interactions between the pigments. In contrast, the UV region contains contributions from the pigments and the apoprotein (secondary structure in the far-UV and
3 4 5 6 7 8 9 10 11 12 13 14 15 16 17 18 19 20 21 22 23 24 25 26 27 28 29 30 31 32 33 34 35 36 37 38 39 40 41 42 43 44 45 46 47 48 49 50 51 52 53 54 55 56
aromatic side chains and disulfide bonds in the near-UV). The trimeric complexes are embedded in the planar lipid bilayer such that their axis of C3 symmetry is parallel to the axis normal to the membrane plane 𝒏⊥. The membranes were in turn oriented either in compressed gels or by forming flat surface-supported bilayers on fused silica window substrates. ACD measurements were conducted in the face-aligned direction, where the angle α between the light propagation direction k and the axis normal to the membrane plane 𝒏⊥ was 0°.
ACD in the visible region
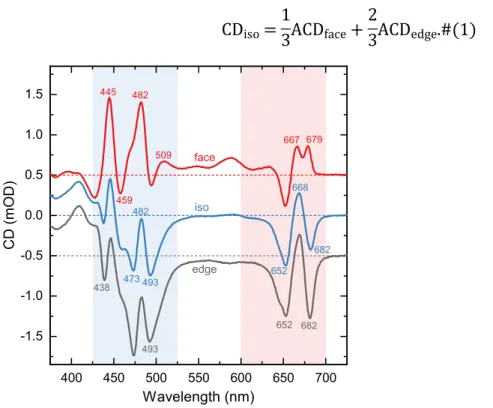
The isotropic CD spectrum of lipid vesicles in buffer and the ACD spectra of dehydrated membrane patches in the visible region are shown in Figure 1. In addition to the measured face- aligned ACD spectrum (ACDface), the figure shows the complementary edge-aligned spectrum at α = 90° (ACDedge), calculated considering the relationship22
CDiso=1
3ACDface+2
3ACDedge.#(1)
400 450 500 550 600 650 700 -1.5
-1.0 -0.5 0.0 0.5 1.0 1.5
679
652 682 482
493 509
668
473
iso
edge
CD (mOD)
Wavelength (nm)
438 459
493
682 667 445 482
652 face
Figure 1. CD and ACD spectra of reconstituted LHCII membranes. Red curve – face-aligned ACD recorded from dehydrated membrane patches; blue curve – isotropic CD measured in buffer
3 4 5 6 7 8 9 10 11 12 13 14 15 16 17 18 19 20 21 22 23 24 25 26 27 28 29 30 31 32 33 34 35 36 37 38 39 40 41 42 43 44 45 46 47 48 49 50 51 52 53 54 55 56
medium; gray curve – edge-aligned ACD calculated as (3CDiso − ACDface)/2.22,26 The spectra are plotted in units of ∆A 10−3(mOD) and normalized to unity isotropic absorbance at 675 nm. For clarity, the ACD spectra are shifted vertically by 0.5. For each spectrum the horizontal dotted line is the corresponding zero line. Numbers indicate peak wavelengths.
Compared with the well documented isotropic CD spectrum of membrane-inserted LHCII17,30,31, the face-aligned ACD spectrum (ACDface) was strikingly different. Qualitatively, it exhibits the following characteristic features:
- a positive peak at 679 nm instead of the negative 682 nm peak in the isotropic spectrum;
- intense positive 445 nm and 482 nm bands;
- clearly pronounced bands originating from weak optical transitions—at 510, 540 and 590 nm;
- the negative peaks at 438 and 473 nm found in the isotropic spectrum vanish and the shoulders at 428 and 459 nm become negative peaks.
Bands observed in the isotropic CD spectrum of LHCII membranes in solution but not in the face-aligned ACD spectrum, can evidently be found in the complementary edge-aligned (α = 90°) ACD spectrum. To this group belong the negative 438, 473 and 493 nm bands, and the negative shoulder around 645 nm, that is characteristic for LHCII trimers as opposed to monomers15.
The interpretation of the spectra can be rather challenging as ACD can be even more prone to perturbations and optical artefacts than isotropic CD. To rule out the presence of any unwanted distortions, the spectra of reconstituted LHCII membranes oriented by two different methods were recorded and additionally compared with those of solubilized complexes as controls. After rehydration of the dry LHCII membrane patches, the isotropic CD spectrum was completely restored (Supporting Figure S2). Furthermore, drying of LHCII trimers solubilized in detergent
3 4 5 6 7 8 9 10 11 12 13 14 15 16 17 18 19 20 21 22 23 24 25 26 27 28 29 30 31 32 33 34 35 36 37 38 39 40 41 42 43 44 45 46 47 48 49 50 51 52 53 54 55 56
micelles had no effect on their CD spectra (Supporting Figure S3). Therefore, it is highly unlikely that the ACD spectra contain optical artefacts or reflect structural alterations in the complexes that might have occurred upon drying.
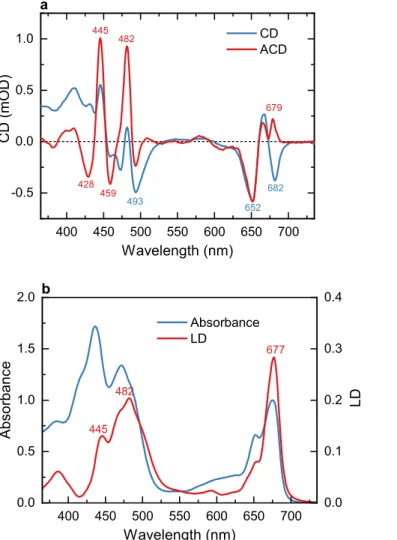
As a further test, we compared the ACD spectra obtained by gel compression, which was applied earlier22 to isolated thylakoid membranes and PSII-enriched membrane fragments. Uniaxial gel compression deforms the spherical vesicles into flattened ellipsoids with the membrane normal parallel to the compression direction.32 The face-aligned ACD spectrum and the CD spectrum 𝒏⊥
of LHCII membranes in uncompressed gel are shown in Figure 2a.
400 450 500 550 600 650 700 -0.5
0.0 0.5 1.0
Wavelength (nm) a
428 459 682
679 445 482
493
CD ACD
CD (mOD)
652
400 450 500 550 600 650 700 0.0
0.5 1.0 1.5 2.0
Wavelength (nm)
Absorbance
445 482
Absorbance
LD 677
b
0.0 0.1 0.2 0.3 0.4
LD
Figure 2. Optical spectra of reconstituted LHCII membranes in buffer and polyacrylamide gel. a).
CD and ACD spectra measured on uncompressed or face-aligned uniaxially compressed gel,
3 4 5 6 7 8 9 10 11 12 13 14 15 16 17 18 19 20 21 22 23 24 25 26 27 28 29 30 31 32 33 34 35 36 37 38 39 40 41 42 43 44 45 46 47 48 49 50 51 52 53 54 55 56
respectively. b). Absorption spectrum (in buffer) and LD spectrum (edge-aligned compressed gel).
The spectra are normalized to unity absorbance at 675 nm, 1 cm optical path length.
Some minor changes can be detected in the CD spectrum of LHCII in gel compared to buffer medium—the intensity of the negative 473 nm band is diminished. More importantly, the ACD spectra in compressed gels and in dry membrane patches are virtually identical. The similarity strongly suggests that (1) both methods effectively orient the membranes in the expected manner, and (2) the spectra are free from artefacts such as inadvertent structural changes or optical (flattening, scattering) effects. The LD measured in edge-aligned orientation, at an angle α = 90°, is plotted in Figure 2b. Note that in randomly oriented samples, LD is zero. Due to rotational symmetry, LD was also zero in the face-aligned orientation (data not shown) and the ACD spectrum showed no change when rotating the sample (about axis of compression). Therefore, artifacts in the ACD spectra arising from linear anisotropy or birefringence interference can be completely ruled out. The LD spectrum of LHCII has peaks at 445, 482 and 677 nm that matched the main positive peaks in the ACD spectrum. Positive LD means that the underlying transition dipole moments are oriented preferentially in the membrane plane.33 As a first approximation, it can be expected that CD bands originating from the same transitions will be enhanced in the face- aligned ACD spectrum due to photo-selection of those transitions. It is important to note that the sign of the CD bands do not need necessarily to be positive.
This agreement provides strong support that the features of the ACD spectrum are solely a consequence of the alignment of the LHCII membranes with respect to the direction of the incident beamlight. Additional support for this assumption is obtained from exciton simulations of the ACD spectra reported below.
UV region
3 4 5 6 7 8 9 10 11 12 13 14 15 16 17 18 19 20 21 22 23 24 25 26 27 28 29 30 31 32 33 34 35 36 37 38 39 40 41 42 43 44 45 46 47 48 49 50 51 52 53 54 55 56
Isotropic and anisotropic UV CD spectra of reconstituted LHCII membranes (Figure 3) were measured using Diamond B23 beamline for SRCD. The advantages of SRCD measurements are not only in the increased sensitivity and signal-to-noise ratio, especially in the far-UV region, but also in the ability to conduct microscopic measurements with the highly collimated microbeam.
This allowed us to probe the chiral heterogeneity of the dehydrated membrane patches. Note that compressed gels are not suitable for UV measurements because of the high absorption from polyacrylamide media.
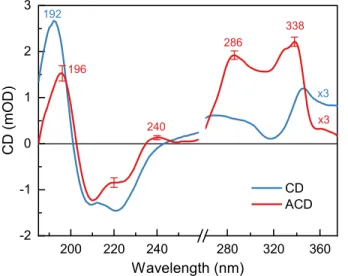
200 220 240 280 320 360
-2 -1 0 1 2 3
CD (mOD)
Wavelength (nm)
196 192
240
286
CD ACD
x3 x3 338
Figure 3. UV SRCD and ACD spectra of reconstituted LHCII membranes. The SRCD spectrum
was recorded from liquid suspension in a quartz cell of 0.2 mm path length. The ACD spectrum is an average of 25 measurements at different spots of the 5x5 mm grid of a dried membrane patch, and error bars show standard deviations. The spectra are normalized to unity absorbance at 675 nm and multiplied by 3 in the near-UV region (above 260 nm).
The UV CD spectrum of LHCII in lipid membranes is virtually identical to that in detergent- solubilized LHCII (Supporting Figure S4) retaining the characteristic profile of α-helical secondary structures of the proteins—two negative bands of approximately equal amplitude at 210 nm and at 224 nm, and a strong positive band at 192 nm with nearly double the intensity of the
3 4 5 6 7 8 9 10 11 12 13 14 15 16 17 18 19 20 21 22 23 24 25 26 27 28 29 30 31 32 33 34 35 36 37 38 39 40 41 42 43 44 45 46 47 48 49 50 51 52 53 54 55 56
negative bands.34 The ACD spectrum recorded from dry membrane patches contains several notable differences with respect to the isotropic CD spectrum in the far-UV (below 260 nm):
- lower intensity of the 192 nm band (up to one-half);
- lower negative amplitude at 224 nm;
- a characteristic positive peak at 240 nm, followed by a trough at 250–260 nm.
Remarkable features were also observed in the near-UV region (260–350 nm): positive peaks at 286 and 338 nm and a pronounced shoulder at 324 nm. The strong ACD signal in this region is surprising because of the small absorption and almost negligible isotropic CD.
It must be noted that, whereas the visible and near-UV SRCD varied very little between measurements and sample batches, the shape of the ACD spectrum in the far-UV region, particularly the intensity of the 210 nm band displayed pronounced variability. To avoid artefacts from uneven drying and inhomogeneities in the membrane patches, SRCD spectra were scanned on 25 different spots using a highly focused microbeam. These spectra show qualitatively similar features despite variability in the relative intensities of the bands reflecting variable thickness.
Importantly, the UV SRCD spectra of dry films of detergent-solubilized LHCII (not shown) were indistinguishable from the spectra of LHCII trimers in buffer solution.
Discussion
The landscape of excited states of an aggregate of coupled pigment molecules encompasses, in principle, couplings between all pigment excited states. For a system of N pigments, each with m energy levels, the total number of exciton levels to consider is N(m−1). The CD spectrum contains signals from all exciton states, which can be positive or negative, overlapping in energy and hence cancelling each other. It is generally not possible to extract unambiguously the energy levels and pigment couplings from CD/SRCD spectra alone, because different configurations can result in
3 4 5 6 7 8 9 10 11 12 13 14 15 16 17 18 19 20 21 22 23 24 25 26 27 28 29 30 31 32 33 34 35 36 37 38 39 40 41 42 43 44 45 46 47 48 49 50 51 52 53 54 55 56
practically identical spectra. This is true even for the simplest possible scenario of a dimer of two- level chromophores.2,26 ACD can provide, in principle, additional information inaccessible from CD and LD, that imposes constraints on the possible geometries and electronic couplings between pigment molecules.20,23,26
The applicability and usefulness of ACD for extracting or validating the excitonic Hamiltonian of molecular aggregates can be demonstrated considering the simplest of exciton systems—the dimer of identical molecules. The electronic eigenstates of the dimer can be approximated as orthogonal linear combinations of the monomer wave functions. Taking into account only the lowest-lying excited state of the monomers, the dimer will have two excitonic states that are split in energy depending on the coupling strength, and whose transition dipole moments have magnitude depending on the dimer geometry but are invariably perpendicular to each other. The excitonic coupling gives rise to a pair (couplet) of CD bands of equal magnitude and opposite sign, centered at the respective excitonic transition frequencies. Different geometries of the dimer and different combinations of spectral bandwidths and exciton coupling strengths can result in indistinguishable CD spectra. In principle, ACD measurements enable the observation of the exciton transitions separately even if the coupling strength is so small that the bands largely overlap and cancel each other in the isotropic phase. This was shown both theoretically and experimentally for the chlorosome baseplate protein CsmA in green-sulfur photosynthetic bacteria, which effectively contains dimers of bacteriochlorophyll a.23,26 When the baseplate is attached to the membrane, one of the exciton transitions is polarized parallel to the axis normal to the membrane plane and the other is in the membrane plane. The face-aligned ACD spectrum arises only from the transition in the membrane plane revealing its exact wavelength position, bandwidth and the
3 4 5 6 7 8 9 10 11 12 13 14 15 16 17 18 19 20 21 22 23 24 25 26 27 28 29 30 31 32 33 34 35 36 37 38 39 40 41 42 43 44 45 46 47 48 49 50 51 52 53 54 55 56
sign of the rotational strength. The extra information uniquely defines the exciton Hamiltonian and the dimer geometry.26
ACD of LHCII in the visible region
The simplest qualitative interpretation of the ACD spectra is based on the expectation that the excitonic states with transition dipole moments oriented preferentially in the membrane plane are selectively probed in the face-aligned direction (α = 0°), whereas transitions which tend to be aligned perpendicularly to the membrane plane are suppressed. Accordingly, the CD bands at 445 nm, 482 nm and 679 nm must originate from excitonic transition dipoles lying parallel to the membrane plane. To lend further support to this interpretation, positive peaks are observed in the LD spectrum at these wavelengths (Figure 2b). Conversely, the 438 nm, 473 nm and 493 nm bands, which are missing in the face-aligned ACD spectra, must reflect transitions perpendicular to the membrane plane. This information is directly related to the relative geometry of the respective pigment entities, but a more detailed analysis requires exciton calculations of optical spectra presented in the following.
Exciton calculations of optical spectra
The information potential of the ACD measurements was further analyzed by exciton calculations. The theory of optical spectra, based on the exciton Hamiltonian of the PPC, is described in the Supporting Information. The parameters of the Hamiltonian that includes the ground and the lowest-lying singlet excited states of the Chls in the LHCII have been previously obtained10 from a combination of quantum-chemical and electrostatic computations, and then refined by comparison with experimental absorption, CD and isotropic CD spectra. To account for dynamic localization effects in the excitonic wavefunction, exciton domains are introduced10,35, splitting the exciton Hamiltonian into blocks encompassing strongly coupled pigments. Exciton
3 4 5 6 7 8 9 10 11 12 13 14 15 16 17 18 19 20 21 22 23 24 25 26 27 28 29 30 31 32 33 34 35 36 37 38 39 40 41 42 43 44 45 46 47 48 49 50 51 52 53 54 55 56
delocalization is only permitted within each exciton domain, and the optical spectra are obtained as a sum over the domain spectra. The expressions for linear absorption (OD), LD and CD of an exciton domain read (see e.g. ref. 1):
OD(𝜔)∝ 𝜔
∑
𝑀
|𝝁𝑀0|2 𝐷𝑀(𝜔 ― 𝜔𝑀0) #(2)
LD(𝜔)∝ 𝜔
∑
𝑀
|𝝁𝑀0|2(1―3cos2(𝜃𝑀)) 𝐷𝑀(𝜔 ― 𝜔𝑀0)#(3)
CD(𝜔)∝ 𝜔2
∑
𝑀
∑
𝑚,𝑛
𝑐(𝑀)𝑚 𝑐(𝑀)𝑛 (𝑹𝑚𝑛⋅(𝝁𝑚0×𝝁𝑛0))𝐷𝑀(𝜔 ― 𝜔𝑀0)#(4)
with the exciton transition dipole moment 𝝁𝑀0=∑ and where is the local transition
𝑚𝑐(𝑀)𝑚 𝝁𝑚0 𝝁𝑚0
dipole moment of molecule , 𝑚 𝑐(𝑀)𝑚 is the contribution of molecule to the delocalized exciton 𝑚 state (see Supporting Information), 𝑀 𝜃𝑀 is the angle between the exciton transition dipole moment 𝝁𝑀0 and the membrane normal 𝒏⊥, which is represented by the C3-symmetry axis of the LHCII trimer, and 𝑹𝑚𝑛=𝑹𝑚― 𝑹𝑛 is the vector that connects the centers of pigments and . 𝑚 𝑛 The 𝐷𝑀(𝜔 ― 𝜔𝑀0) denotes a lineshape function, which contains vibrational sidebands and lifetime broadening induced by exciton relaxation.36 Recently, an exciton-theory–derived formalism of ACD has been developed.26 Here we tested the predictive power of the exciton Hamiltonian proposed earlier10 by calculating ACD spectra without further refinement of the model parameters.
For light propagation in face direction, that is parallel to the membrane normal 𝒏⊥, the expression for the ACD signal reads26
ACDface(𝜔)∝ 𝜔2
∑
𝑀
∑
𝑚,𝑛
𝑐(𝑀)𝑚 𝑐(𝑀)𝑛
{
(𝑹+𝑚𝑛( (
𝑄⋅ 𝒏′𝑚0⊥⋅ 𝒏)(𝝁⊥𝑚0)
××𝝁𝝁𝑛0𝑛0)
)⋅ 𝒏⋅ 𝒏⊥⊥}
𝐷𝑀(𝜔 ― 𝜔𝑀0)#(5)where 𝑄′𝑚0is the electric quadrupole transitions moment of pigment . The component 𝑚 𝑄′𝑚0(𝛼𝛽) is defined as
3 4 5 6 7 8 9 10 11 12 13 14 15 16 17 18 19 20 21 22 23 24 25 26 27 28 29 30 31 32 33 34 35 36 37 38 39 40 41 42 43 44 45 46 47 48 49 50 51 52 53 54 55 56
𝑄′𝑚0(𝛼𝛽)=
∑
𝐼
𝑞𝐼
(
𝑹(𝑚)𝛼,𝐼 ― 𝑹(𝑚)𝛼)
(
𝑹(𝑚)𝛽,𝐼 ― 𝑹(𝑚)𝛽)
#(6)Here, 𝑹(𝑚) denotes the molecular center of pigment , and is the atomic transition charge, 𝑚 𝑞𝐼 placed at the position 𝑹(𝑚)𝐼 of the 𝐼th atom of pigment , obtained from a fit of the three-𝑚 dimensional electrostatic potential of the ab-initio transition density of the Qy transition of the pigments37. The present transition charges were obtained with time-dependent density functional theory, using the B3LYP exchange-correlation functional and a 6-31G* basis set, in ref. 37 for Chl a and in ref. 38 for Chl b. The numerical values of these transition charges are given in the respective supporting informations.37,38
The expressions for LD and CD in eqs. 3 and 4 assume ideal alignment of the PPC, whereas the measured ensemble spectra necessarily reflect a degree of randomness in the orientation.
Accordingly, the calculated anisotropic spectra were represented as weighted sums of ACD of perfectly aligned complexes and isotropic CD. An orientation factor ϕ = 0.41 was estimated from the relative ratio of the measured LD magnitude (Figure 2b) and the calculated ideal-orientation LD magnitude and used as a weighting coefficient for the ACD spectra.
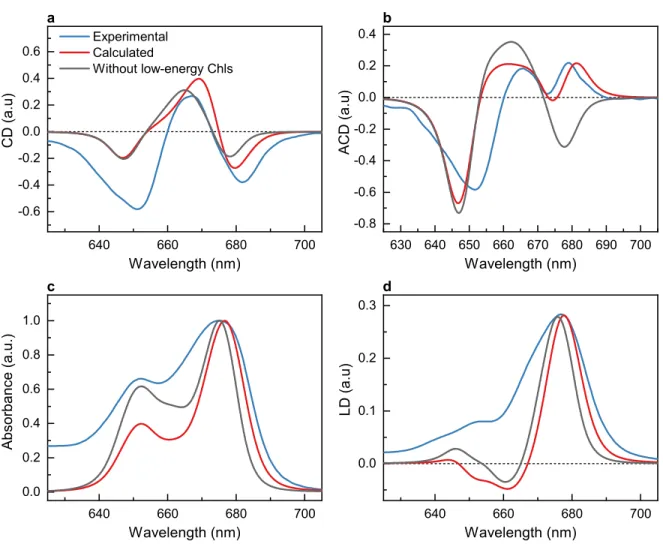
The calculated CD, ACD, OD and LD spectra in the Chl Qy region are compared with the experimental data in Figure 4. The calculated spectra in general contain somewhat narrower peaks than the experimental ones. The inhomogeneous width Δinh of the distribution function of site energies as well as the Huang–Rhys factor S, characterizing the dynamic modulation of site energies, might be larger at 300 K than at cryogenic temperatures, for which the present Δinh = 120 cm-1 and S = 0.5 have been estimated.10 In our calculations the temperature dependence of the spectra is solely determined by the Bose–Einstein distribution function of vibrational quanta entering the homogeneous lineshape function (eqs. S7, S13–S14). From quasi-elastic neutron scattering experiments on LHCII evidence about a strong increase of protein flexibility above the
3 4 5 6 7 8 9 10 11 12 13 14 15 16 17 18 19 20 21 22 23 24 25 26 27 28 29 30 31 32 33 34 35 36 37 38 39 40 41 42 43 44 45 46 47 48 49 50 51 52 53 54 55 56
glass transition temperature of 240 K, leading to an increase of the dynamic and/or static disorder, was reported,39 which could be responsible for the larger broadening of the experimental spectra in Figure 4.
640 660 680 700
0.0 0.1 0.2 0.3
Wavelength (nm) d
LD (a.u)
640 660 680 700
0.0 0.2 0.4 0.6 0.8 1.0
Wavelength (nm) c
Absorbance (a.u.)
630 640 650 660 670 680 690 700 -0.8
-0.6 -0.4 -0.2 0.0 0.2 0.4
Wavelength (nm) b
ACD (a.u)
640 660 680 700
-0.6 -0.4 -0.2 0.0 0.2 0.4 0.6
Experimental Calculated
Without low-energy Chls
Wavelength (nm) a
CD (a.u)
Figure 4. Calculated CD (a), ACD in face configuration (b), absorption (c) and LD (d) spectra of
LHCII trimers based on the model including (red curves) and excluding (gray curves) the four low-energy pigments, compared to the respective experimental spectra (blue curves, data from Figure 2). The LD and ACD spectra are calculated assuming orientation factor ϕ = 0.41. All spectra were measured and calculated at room temperature (300 K).
3 4 5 6 7 8 9 10 11 12 13 14 15 16 17 18 19 20 21 22 23 24 25 26 27 28 29 30 31 32 33 34 35 36 37 38 39 40 41 42 43 44 45 46 47 48 49 50 51 52 53 54 55 56
The calculated CD spectrum in Figure 4a shows a negative band at 679 nm and a positive peak at 670 nm, which are consistent with the experimental spectral features. The negative peak in the calculated spectrum at 648 nm is weaker than in the experimental spectrum. This deviation is likely due to the non-conservative nature of the spectrum, that is, ∫∞0CD(𝜔) 𝑑𝜔 ≠0. Similar deviations were found in CD spectra of the CP29 light-harvesting complex of PSII and has been recently explained by excitonic coupling between higher Chl transitions as well as carotenoid transitions to the Qy Chl transitions.35
The exciton model readily reproduces the characteristic qualitative shape of the measured ACD spectrum (Figure 4b)—in particular, the apparent sign inversion of the low-energy band around 680 nm between the experimental isotropic CD and ACD spectra. Because the ACD spectrum is extremely sensitive to the pigment geometry, this agreement between theory and experiment provides evidence that the pigments contributing to the low-energy exciton states are correctly assigned in the model. Removing the four lowest-energy Chls from the calculation results in qualitatively similar CD, absorption and LD spectra, but the ACD spectrum, particularly in the 680 nm region, is severely misrepresented (the gray curves in Figure 4), highlighting the importance of ACD in the assignment of the lowest-energy states.
The energy sinks were identified earlier by Müh and Renger10 as Chl a603 and a610 in the stromal layer and Chl a604 and a613 in the luminal layer. Each of those four sites contributes to the sign inversion of the ACD spectrum, with the largest effects by Chls a604 and a610, as observed by removing these two pigments in the calculations of the spectra (Supporting Figure S5). There is general consensus in the literature about the energy sink at Chl a610 in the stromal layer5,10,11, whereas our second energy sink at Chl a603 in the luminal layer was not found in the other studies5,11 (Supporting Table S1). Concerning the luminal layer there is also partial
3 4 5 6 7 8 9 10 11 12 13 14 15 16 17 18 19 20 21 22 23 24 25 26 27 28 29 30 31 32 33 34 35 36 37 38 39 40 41 42 43 44 45 46 47 48 49 50 51 52 53 54 55 56
agreement. The present assignment of Chl a604 agrees with the model of Zucchelli et al.5 and that of Chl a613 agrees with Novoderezhkin et al.11 Calculations with all three site energy sets5,10,11 result in qualitatively similar optical spectra, but the strong positive 680 nm ACD band is best reproduced with the site energies of ref. 10 (Supporting Figure S6). In our comparison we only replaced the site energies of ref. 10 by those of ref. 5 and 11 and did not take into account other differences, as, e.g., in the excitonic couplings and the optical lineshape theories, because the present couplings go beyond the point-dipole approximation and the present lineshape theory avoids artefacts from dynamic localization effects. These improvements could be part of the reason why some of the low energy sites were assigned differently before, in particular in the work of Novoderezhkin et al. 11, where this assignment was solely based on a fit of optical spectra. The importance of Chl a604 for reproducing the specific CD and ACD spectral shape around 680 nm points to the correct assignment of this pigment as belonging to the group of low-energy Chls, as opposed to having an intermediate energy as in Novoderezhkin’s model. A more quantitative investigation of the ACD spectrum seems to be suitable to remove the remaining ambiguity in the assignment of low-energy sites.
From experiments on LHCII aggregates16, single molecule experiments40 and molecular dynamics simulations41 it is known that the LHCII complex can adopt different conformations affecting the low-energy excited states, thought to be related to photoprotection42,43. Indeed, the site energies had to be adjusted10 in order to describe the spectra of small lamellar aggregates of LHCII35. This adjustment—model B by Müh and Renger10—leads to qualitatively similar ACD spectra as for the site energies inferred for solubilized LHCII trimers—model A (Supporting Figure S6). This is in line with the observed very similar ACD spectra of oriented lamellar aggregates of LHCII (data not shown).
3 4 5 6 7 8 9 10 11 12 13 14 15 16 17 18 19 20 21 22 23 24 25 26 27 28 29 30 31 32 33 34 35 36 37 38 39 40 41 42 43 44 45 46 47 48 49 50 51 52 53 54 55 56
The calculated ACD spectrum (Figure 4b) deviates stronger below 670 nm from the experimental data. These deviations could be due to the excitonic couplings involving higher Chl transitions, which appear to affect the CD in the same spectral range as the ACD spectrum. A further refinement of the present exciton theory by including these higher excited states of the Chls and also of the carotenoids will help to improve the agreement between calculated and measured spectra over the whole Qy spectral range.
The OD and LD spectra are in good qualitative agreement with the present experiments above 665 nm (Figure 4c and d). Please note that the deviations in the OD and LD spectra between the present calculations and the experimental data occurring at short wavelengths below 665 nm are due to the contributions of intramolecular vibronic Chl transitions, which do not affect the CD and ACD spectra and were not taken into account in the present work to simplify the calculations. A comparison of OD and LD spectra calculated including these intramolecular vibrations with experimental data is given in ref. 10.
Another subtlety in the modeling of optical spectra of LHCII, also related to conformational transitions, concerns the evidence10 that the transition dipole moments of some of the low-energy pigments must have a different orientation in solubilized trimers than in the crystal structure. In a first attempt, to explain the reduced LD spectrum of ideally oriented complexes, Chl a604 has been rotated by 45° such that its transition dipole moment is in the membrane plane.10 Such a rotation would still be possible, since the low-energy part of the ACD spectrum is not significantly affected by it (Supporting Figure S7). A systematic investigation of this question, including possible changes of other low-energy pigments, has to await a refinement of the theory, as discussed above.
3 4 5 6 7 8 9 10 11 12 13 14 15 16 17 18 19 20 21 22 23 24 25 26 27 28 29 30 31 32 33 34 35 36 37 38 39 40 41 42 43 44 45 46 47 48 49 50 51 52 53 54 55 56
In summary, the ACD data presented herein and the calculations ratified the exciton Hamiltonian of LHCII proposed earlier10, and a refined theory of ACD, including higher excited electronic states, will allow us to further refine this Hamiltonian.
UV ACD
The UV CD of peptides and proteins is widely used to study their structure, folding and conformational dynamics, membrane insertion, and effects of ligand binding. CD spectra characteristic to the polypeptide secondary structure content—e.g. α-helix, β-strand, left handed extended helix of polyproline II (PPII), β-turn, and unordered structure—occur in the far-UV region and arise mainly by n–π* and π–π* transitions of the peptide bond.44,45 The n–π* transition gives rise to a negative peak in the CD spectrum at about 224 nm. According to Moffitt’s theory46, excitonic interactions in α-helices result in three π–π* transitions with split energies: one gives rise to the negative peak at around 210 nm and the other two are degenerate, at around 190 nm, with amplitudes strongly depending on the probing direction. The CD spectrum of LHCII membranes represented the expected signatures of an α-helix (Figure 3). Horn and Paulsen34 found a value of 42% α-helices and 8% β-strands in detergent-solubilized native LHCII, the former is reasonably close to the 41% seen in the LHCII crystal structure.
Additional information regarding the angle of orientation of the secondary structures with respect to the axis normal to the membrane plane can be extracted from the ACD spectra.47-50 Oriented helical peptides bound to a lipid bilayer exhibit a specific ACD spectrum, from which the orientation of the helix can be extrapolated. A distinguishing feature of the ACD of α-helices is the presence or absence of the negative band at around 210 nm, being indicative of surface or transmembrane helix alignment, respectively.51
3 4 5 6 7 8 9 10 11 12 13 14 15 16 17 18 19 20 21 22 23 24 25 26 27 28 29 30 31 32 33 34 35 36 37 38 39 40 41 42 43 44 45 46 47 48 49 50 51 52 53 54 55 56
Wu et al.47 employed Moffitt’s theory to successfully reproduce the expected CD and ACD features of oriented transmembrane peptides. Following this approach, we calculated CD and ACD spectra in the far-UV region for each of the five α-helices in LHCII taking into account their respective inclination angles and lengths from the crystal structure3 (see Supporting Information).
While the calculated CD spectrum (Supporting Figure S8) is very similar to the experimental one, not all features of the ACD spectrum described above could be reproduced. In the calculated ACD spectrum, the intensity of the 208 nm band was smaller than that of the calculated CD spectrum, whereas the experimental ACD (Figure 3) did not show such a change. Also, in the near-UV range, the enhanced peak around 240 nm in the LHCII ACD spectrum was not observed in the UV CD of oriented helical peptides. This result leads us to conclude that the UV CD spectrum of LHCII includes sizeable contributions not only from the backbone but also from the aromatic side chain residues as well as from interactions of the protein and the pigment cofactors (Chls and carotenoids). Since the ACD spectrum appears to be sensitive to these details it will represent a critical check for future semi-empirical calculations of UV spectra of pigment–protein complexes.
Conclusions
A new spectroscopic technique for the characterization of photosynthetic pigment–protein complexes, ACD, was presented and applied to LHCII. The ACD spectra revealed a great deal of information otherwise lost in the rotational averaging of the isotropic CD spectra. The CD and ACD spectra in the UV region reflect the large content of α-helical secondary structure but also reveal that pigments and possibly pigment–protein couplings also contribute to the UV CD. The ACD spectra in the visible spectral region are determined by the optical properties of the protein- bound pigments and their excitonic interactions. We demonstrated that ACD spectroscopy,
3 4 5 6 7 8 9 10 11 12 13 14 15 16 17 18 19 20 21 22 23 24 25 26 27 28 29 30 31 32 33 34 35 36 37 38 39 40 41 42 43 44 45 46 47 48 49 50 51 52 53 54 55 56
combined with structure-based model calculations, is a valuable approach to identify the pigments contributing to the observable excitonic transitions with higher degree of confidence. Further evidence for the energy sinks in LHCII formed by Chls a603 and a610 in the stromal layer and Chls a604 and a613 in the luminal layer is obtained from the present ACD calculations that reproduce the experimental sign switch of the low-energy band of LHCII with respect to the CD spectrum.
The non-conservative nature of the experimental isotropic CD spectrum suggests that there is an influence of higher excited Chl and carotenoid states that could explain the remaining deviations between calculated and measured ACD spectra, in particularly on the high-energy side of the visible spectrum. Inclusion of carotenoid states will help to further understand the higher-energy spectral regions, including the blue and the near-UV, where the ACD spectra possess the most characteristic and striking features. ACD will serve as an important complement to CD for the characterization of carotenoid-Chl interactions and for the verification and refinement of exciton Hamiltonians of light-harvesting complexes in general.
ASSOCIATED CONTENT
The following files are available free of charge.
Supporting Information. Supporting figures, theory for calculating optical spectra. (PDF)
AUTHOR INFORMATION Corresponding Author
* Petar H. Lambrev
Hungarian Academy of Sciences, Biological Research Centre
3 4 5 6 7 8 9 10 11 12 13 14 15 16 17 18 19 20 21 22 23 24 25 26 27 28 29 30 31 32 33 34 35 36 37 38 39 40 41 42 43 44 45 46 47 48 49 50 51 52 53 54 55 56