Contents lists available atScienceDirect
Journal of Insect Physiology
journal homepage:www.elsevier.com/locate/jinsphys
Spectral sensitivity of L2 biotype in the Thrips tabaci cryptic species complex
Ádám Egri
a,b,⁎, Péter Farkas
c, Balázs Bernáth
d, Patrick M. Guerin
d, József Fail
caEvolutionary Systems Research Group, MTA Centre for Ecological Research, H-8237 Tihany, Hungary
bDanube Research Institute, MTA Centre for Ecological Research, H-1113 Budapest, Karolina út 29-31, Hungary
cDepartment of Entomology, Faculty of Horticultural Science, Szent István University, H-1118 Budapest, Villányi út 29-43, Hungary
dInstitute of Biology, University of Neuchâtel, Rue Emile-Argand 11, 2000, Neuchâtel, Switzerland
A R T I C L E I N F O
Keywords:
Thrips tabaci Thrips
Spectral sensitivity Electroretinogram ERG
Phototaxis Biotype
A B S T R A C T
The onion thrips,Thrips tabaci(Lindeman, 1889), is a cosmopolitan pest of economic importance on a wide range of crops. Despite being one of the most studied thrips species, there is very limited knowledge available about its ability to perceive light. TheT. tabacicryptic species complex consists of a tobacco-associated (T) and two leek- associated (L1, L2) biotypes. We made electroretinogram recordings on the most widespread thelytokous (where unfertilized eggs produce females)T. tabaciL2 biotype and measured attraction to light sources in this biotype as a function of wavelength in behavioural experiments. The spectral sensitivity of theT. tabaciL2 biotype shows a unimodal curve peaking atλmax= 521 nm. Contrary to this spectral sensitivity curve, L2 biotype attraction in an arena is bimodal with local maxima at 368 nm (UV) and 506–520 nm (green) being practically of the same magnitude. Although being similar to the arrhenotokous (where unfertilized eggs produce males) L1 biotype in phototaxis, significant differences regarding photoreceptor cell responses emerged. This study contributes to our understanding of light perception in Thysanoptera as well as to the development of more effective monitoring tools for this economically important pest species.
1. Introduction
Onion thrips, Thrips tabaci (Lindeman, 1889) (Thysanoptera:
Thripidae) is a widely distributed pest of economic importance (Fail, 2016). Having almost 300 host plant species, their direct feeding da- mage is estimated to cause more than U.S. $1 billion in crop losses annually worldwide (Balan et al., 2018).T. tabaciis also a vector of two economically significant viral pathogens, Iris yellow spot virus and Tomato spotted wilt virus. The former pathogen is estimated to cause annual losses of U.S. $90 million to onion production in the USA alone (Gent et al., 2006) while the latter can cause over U.S. $1 billion in crop losses annually worldwide (Goldbach and Peters, 1994).
T. tabaciwas considered as a single cosmopolitan thrips species until Zawirska (1976)suggested that onion thrips had two distinct biotypes.
Early molecular-genetic studies revealed considerable difference be- tween populations ofThrips tabaci(Klein and Gafni, 1996; Kraus et al., 1999; Jenser et al., 2001). Later, based on DNA sequences of the mi- tochondrial COI gene,T. tabacihas been divided into three lineages: a tobacco-associated (T) and two leek-associated (L1, L2) biotypes (Brunner et al., 2004). Onion thrips is now considered as a cryptic species complex containing these 3 distinct biotypes (Toda and Murai, 2007; Kobayashi and Hasegawa, 2012; Kobayashi et al., 2013;
Westmore et al., 2013; Fekrat et al., 2014; Sojnóczki et al., 2015;
Jacobson et al., 2016). While all biotypes are parthenogenous, T and L1 reproduce with arrhenotoky, and L2 reproduce with thelytoky. In ar- rhenotokous biotypes, unfertilized eggs develop to males, while in thelytokous L2 biotype unfertilized eggs develop into female offspring (Toda and Murai, 2007).
It has been concluded that herbivorous thrips rely on colour and colour contrast to distinguish host plants from the surrounding en- vironment since background colours of the same hue as a trap reduced trap catch whereas contrasting backgrounds enhanced trap catch (Czencz, 1987; Vernon and Gillespie, 1995). To identify the colour preference of thrips species several studies had been carried out mainly using trap surfaces painted in different colours and evaluating the numbers of trapped individuals (Terry, 1997). Studies on the colour preference of T. tabaci have resulted in various, sometimes contra- dicting, results regarding the most attractive colour, but generally agree that more thrips are attracted by low-UV-reflective white, blue and yellow surfaces than by green, red, black and highly-UV-reflective white ones (Kirk, 1984; Czencz, 1987; Lu, 1990; Teulon and Penman, 1992; Trdan, 1999; Szénási et al., 2001; Natwick et al., 2007; Ben-Yakir et al., 2008; Rőth et al., 2016).
Phototactic behaviour and spectral sensitivity has already been
https://doi.org/10.1016/j.jinsphys.2019.103999
Received 20 August 2019; Received in revised form 14 December 2019; Accepted 16 December 2019
⁎Corresponding author.
E-mail address:egri.adam@okologia.mta.hu(Á. Egri).
Journal of Insect Physiology 121 (2020) 103999
Available online 18 December 2019
0022-1910/ © 2019 The Authors. Published by Elsevier Ltd. This is an open access article under the CC BY license (http://creativecommons.org/licenses/BY/4.0/).
T
studied for a few thrips species including the arrhenotokous L1 biotype ofT. tabaci(Makabe et al., 2014) that is common in Japan (Toda and Murai, 2007). In general, these thrips species are most sensitive to UV-A and green light and the wavelength dependence of their attraction to monochromatic light is qualitatively the same as their bimodal spectral sensitivity (Matteson et al., 1992; Otani et al., 2014; Kishi et al., 2014;
Makabe et al., 2014). Although the geographical distribution ofT. ta- bacibiotypes cannot be accurately established, according to the current state of knowledge, males are rare or absent in most parts of the world and reproduction is dominated by thelytokous parthenogenesis (Tedeschi et al., 2001). Since biotype L2 is the only thelytokous one, acquiring knowledge about this lineage is crucial to take full advantage of the optical tuning ofT. tabacifor monitoring or mass-trapping tools.
To broaden our knowledge about vision in theT. tabacispecies complex we measured the spectral sensitivity ofT. tabacibiotype L2 compound eyes, as well as the phototactic behaviour of this biotype as a function of light wavelength.
2. Materials and methods
2.1. Insect collection, identification and maintenance
The thelytokous L2 biotype ofT. tabacibreed used in this study was established using specimens of a confirmed reproductive mode.
Specimens were descendants of wild-caught individuals collected in 2013 and 2014 in Budapest (47° 28′48″N, 19° 2′24″E) and Tordas (47° 20′43″N, 18° 44′49″E) in Hungary.
To establish a pure colony of the L2 biotype, the reproductive mode of collected larvae and adults was confirmed by observing the sex ratio in virgin progeny. Thrips specimens were isolated individually in 2 ml microcentrifuge tubes on leaf sections and allowed to oviposit for one
and two subsequent generations. Female offspring of virgin female thrips was used exclusively to set up a thelytokous colony of the L2 biotype following morphological and molecular confirmation. All thrips samples were kept in a climate chamber (SANYO, MLR-352H, Panasonic Corporation, Osaka, Japan) during the identification process in 16:8 L:D cycle at 23 °C and 70% relative humidity. Field-collected thrips individuals were preserved in 96% ethanol for taxonomic and molecular identification after producing sufficient offspring. All adult females were slide mounted using Hoyer’s solution and morphologically identified using a compound light microscope (LEICA DMLB, Leica Microsystem GmbH, Wetzlar, Germany) following the identification guide ofMound and Kibby (1998)and the key ofMoritz et al. (2001).
The progeny of thefield-collected females was verified using mo- lecular analysis. Genomic DNA extraction was carried out using the method ofDe Barro and Driver (1997). Lysate was used directly for PCR amplification of the mitochondrial COI fragment (mtCOI) using specific primers (Farkas et al., 2019), the PCR products were purified using High Pure PCR Product Purification Kit (Merck KGaA, Darmstadt, Germany) and the amplicons were directly sequenced. A homology search was carried out to confirm that specimens used in this study wereT. tabaciby using the BLASTn search tool (Altschul et al., 1990) (https://blast.ncbi.nlm.nih.gov/Blast.cgi). All the progeny produced by thelytokousT. tabaci females (L2 biotype) were identified based on mtCOI gene fragment sequences. These sequences are deposited in GeneBank under accession numbers MK298038-MK298041.
IdentifiedT. tabaciindividuals were maintained in ventilated glass jars containing cabbage leaves on a double-layered kitchen paper at room temperature (22° ± 3 °C) under illumination by diffuse skylight entering the laboratory window (300–400 lx). Cabbage leaves used for colony maintenance were carefully examined for the presence of thrips or damage symptoms of thrips before they were introduced into the Fig. 1.Experimental setup for the ERG recordings. (A)T. tabacimounted on a piece of Plexiglas®with adhesive tape; (B) Photographs of the glass electrodes used for the recordings; (C) A specimen with the electrodes inserted into the eyes. (D) Photograph of the complete ERG setup.
colony to ensure a pure culture of the L2 lineage ofT. tabaci.
2.2. Electroretinography recordings
Thrips were prepared following the method of Matteson et al.
(1992) and Makabe et al. (2014)with minor modifications as described below. Individual adults were picked from colonies with a small wet paintbrush and gently placed on a double-sided adhesive tape attached to a piece of Plexiglas®(2 cm × 2 cm × 0.6 cm). Antennae and thorax were covered and fixed with thin strips of adhesive tape orientated perpendicularly to the longitudinal body axis (Fig. 1A and C).
Electroretinogram (ERG) measurements were performed in a semi- automatic system composed of a BA-03X bridge amplifier (npi elec- tronic GmbH, Tamm, Germany), an IDAC-2000 multiplexer (Syntech, Hilversum, Netherlands), a Polychrome V monochromator (Till Photonics GmbH, Gräfelfing, Germany) and a laptop computer (Dell Inc, Round Rock, USA). Measurements were performed at room tem- perature (22 ± 2 °C) and relative humidity was maintained over 55%
during recordings. The measuring electrode was a borosilicate glass micropipette with a drawn-out tip of 0.5–1μm diameter,filled with 100 mM KCl and connected to the preamplifier by a chloridized silver wire. The reference electrode was also a borosilicate micropipette with a tip diameter of 0.5–1μm and was inserted into the left eye to reach the centre of the head, while the measuring electrode was inserted into the right eye with its tip reaching to 30–100μm beneath the cornea (Fig. 1B and C).
The ERG setup is shown inFig. 1D. Light stimuli were produced using the monochromator and a custom-built, Arduino UNO controlled (http://arduino.cc/en/Main/ArduinoBoardUno) motorizedfilter-wheel with 10 windows. The first window was empty, while the other 9 contained different neutral-density (ND) filters (combinations of Lee 209, 210, 211, 299filters; Andover, UK). The monochromator and the filter wheel were controlled by analogue outputs of the IDAC-2000.
Transmission spectra of the 9 ND filters were determined using the monochromator and its alignment photodiode by measuring the shortcut-current of the diode (that is proportional to light intensity) at various wavelengths with and without the NDfilters in the light path.
Taking into account the typical emission spectrum of the 150 W Xenon lamp used by the monochromator and the measured transmission spectra of the NDfilters, light intensity proportional to photon number was controllable for any wavelength in 9 steps with the filter wheel.
Light leaving thefilter wheel was reflected onto the eye preparation by a piece of polished aluminium foil to ensure equal reflectance over the applied wavelength range. Without the reflector the light guide tip should have been positioned significantly farther from the specimen due to the geometry of the setup. The half bandwidth of the mono- chromatic light stimuli was 15 nm and the light intensity of stimuli varied between 4.60·1010photons/cm2/s and 1.03·1015photons/cm2/s.
Preprogrammed stimulus sequences covered wavelength ranges from 660 nm to 320 nm or 650 nm to 330 nm in steps of 20 nm and the intensity of stimuli was varied with thefilter wheel. Amplitudes of re- ceptor cell responses (Fig. 2A) were compared to that of responses to a reference light stimulus of 520 nm that was included in all recording sequences. Stimulus length of 1 s and inter-stimulus intervals of 15 s were used. In the inter-stimulus intervals, depending on the type of the measurement, 550 nm (green adaptation) or 360 nm (UV adaptation) light, or no light (dark adaptation) was delivered to the eye through the window of thefilter wheel that contained no NDfilters. For a given specimen, pre-programmed stimuli with each combination of wave- length and light intensity were repeated 3 times and responses were averaged. Typical stimulus sequences consisted of about 300 individual light stimuli that lasted 80 min. Before and after the stimulus sequence, three 1-s-long control flashes were produced using a common white LED (L5-W601-STD, SLOAN Precision Optoelectronics, Basel, Switzer- land). When the ratio of the responses to such control stimuli applied at the end and beginning of the recording sequence was less than 9/10,
that is the ERG response obviously weakened during the experiment, the responses of the preparation were omitted.
Sigmoid dose-response curves werefitted to the photoreceptor cell responses as a function of log light intensity for all wavelengths.
Spectral sensitivity was calculated by taking the reciprocals of light intensity required for eliciting a standard response criterion at all wa- velengths as described in detail byDeVoe et al. (1997). To determine the time needed for dark-adaptation of the eye, preliminary measure- ments were performed in darkness with the white LED delivering 1-s- long light stimuli to eye preparations at 60 s intervals.Fig. 2B shows the responses of an eye as a function of time where it is clear that after 15–20 min the response amplitude reached saturation and did not in- crease. Thus after inserting electrodes for ERG measurements a 20-min- long adaptation period was provided for each eye preparation before starting the recording sequence. Recordings were made during daytime between 10:00 and 18:00.
We performed three series of ERG measurements onT. tabacibio- type L2 with three adaptation regimes. The spectral sensitivity of (i) dark-adapted, (ii) green-light adapted and (iii) UV-light adapted eyes of, respectively, 16, 9 and 5 specimens was recorded. The green and UV adaptation wavelengths were λadap,G = 550 nm and λadap,UV= 360 nm. The purpose of these chromatic adaptations was to attempt to reveal presence of distinct photoreceptor cell classes, espe- cially a UV-sensitive one as there was no characteristic UV peak in the spectral sensitivity curve of dark-adapted preparations.
The photopigment absorption spectrum and peak photopigment sensitivityλmaxof T. tabaci were estimated by fitting an absorption model function (Maximov, 1988) to the relative spectral sensitivity values measured at wavelengths above 405 nm.
2.3. Behavioural tests
We measured the rate of attraction ofT. tabacibiotype L2 to light as a function of wavelength (action spectrum of phototaxis) in the 368 nm–637 nm range. A custom-built light source consisting of 11 power LEDs was used to create light stimuli (Fig. 3A–C;Supplementary Fig. S1). Peak wavelength and half bandwidth of these LEDs were 368 nm ( ± 8.2 nm), 402 nm ( ± 6.1 nm), 423 nm ( ± 5.8 nm), 446 nm ( ± 8.5 nm), 462 nm ( ± 10.8 nm), 506 nm ( ± 12.5 nm), 520 nm ( ± 13.5 nm), 557 nm ( ± 16.0 nm), 596 nm ( ± 7.2 nm), 621 nm Fig. 2.ERG responses ofT. tabaci. (A) Typical receptor potential recorded from T. tabaci; the gray interval represents the light stimulus. (B) Response amplitude of an initially light-adaptedT. tabacias a function of time where identical 1-s- long white light stimuli were repeated every minute.
Á. Egri, et al. Journal of Insect Physiology 121 (2020) 103999
( ± 6.9 nm) and 637 nm ( ± 8.1 nm). The LEDs were mounted on a horizontal surface facing upward. A PVC pipe elbow 6 cm in diameter wasfixed above them and used as a wide-diameter light-guide acting as a diffuser (Fig. 3C). The inner surface of the elbow was covered with crumpled aluminium foil to ensure the diffusion of light inside the pipe element. A 3 mm thick vertically-standing sandblasted glass plate was placed onto the upper opening of the elbow. In this manner the sand- blasted glass surface was able to emit light homogeneously at 11 dif- ferent wavelengths (Fig. 3B and C;Supplementary Fig. S1). Light in- tensity was controlled electrically through a pulse width modulation (PWM) signal with a frequency offPWM= 973 Hz. The PWM signal was generated by an Arduino UNO development board. Additionally, a ND filter combination (Lee 211 plus 299filters) was attached to a servo- motor driven arm to allow the range of available light intensities to be extended by interposing the NDfilter in front of the glass illumination source (Fig. 3A and B; Supplementary Fig. S1L). The transmission spectrum of the NDfilter and the emission spectrum of the light source in the case of all 11 wavelengths was measured with a radiometrically calibrated Ocean Optics STS-VIS spectrometer (Ocean Optics, Largo, USA). With this calibrated light source the intensity at each wavelength could be set between 3.24·109photons/cm2/s and 1.46·1014photons/
cm2/s for the test insects. Exact intensity ranges were wavelength de- pendent, but were at least 3.9 log intensity units wide.Supplementary Fig. S2shows the transmission spectrum of the NDfilter types used in this study. Thefilters of thefilter wheel in the ERG measurements and the single NDfilter for the behavioural tests were combinations of these filters. The producers and exact specifications of the 11 power LEDs were unknown but radiometric calibration verified their appropriate- ness for experiments.
Driving LEDs with pulse width modulation impliesflickering of the light source, but the chosenfPWM= 973 Hz frequency was far higher
than the maximal 300 Hz of insect flicker fusion frequency (Shields, 1989) such that during our behavioural tests the thrips sensed no flickering of the light source.
Behavioural tests were performed in a darkened container. In each test run 50–70 adult thrips were enclosed in an arena formed by a 0.5 mm thick cardboard frame placed between two 30 mm × 30 mm × 1 mm quartz sheets pressed together with a black rubber band running through the middle of the quartz sheet (Fig. 3A and D-E). The arena was placed vertically onto a black surface. A NIKON D3200 DSLR camera (Nikon Corporation, Tokyo, Japan) equipped with a Tamron AF18-20 mm F/3.5–6.3 XR LD Aspherical (IF) Macro objective (Tamron Co., Ltd., Saitama, Japan) was aimed at the arena illuminated by the light source. A vertical black, opaque card- board was placed between the test light source and the arena to cast a blurred shadow onto the arena centre (Fig. 3A and B;Supplementary Figs. S1, S3A). The cardboard and the light source were at 1 cm and 8 cm from the arena, respectively. In this arrangement, when no light was present, thrips constantly performed random movements, but when a light stimulus was applied, a homogeneous horizontal light intensity gradient was formed across the arena (Fig. 3F,Supplementary Figs. S1, S3A). Thrips started to move towards the bright side of the arena or continued their random movement depending on wavelength and light intensity of stimuli. Tests were performed with a given group of insects as follows. In view of the dark adaptation period established in ERG recordings, insects werefirst left in darkness for 20 min. Then a pre- defined stimulus sequence of light stimuli was delivered containing all 11 wavelengths and 4–6 light intensities. The order in which wave- lengths were delivered was randomized and light intensities were ap- plied in increasing order. In the stimulus sequence, every stimulus was preceded by a 180-s-long dark period. The length of each light stimulus was 25 s, and each stimulus ended with a photograph of the arena using Fig. 3.Experimental setup for behavioural experiments (A-C) and the process of evaluation (D-F). (A, B) Photographs of the setup. (C) Schematic of the LED light source. (D) Typical image of the arena taken by the camera at the end of a light stimulus. The dashed line represents the region to be stretched into a square to eliminate perspective distortion. (E) Cropped and stretched image. (F) Centroid bias (sloping blue arrow) of the identified thrips (yellow circles). Dashed horizontal and vertical blue arrows indicate the horizontal and vertical component of the centroid bias. The purpose of the black region was to symmetrically mask out the rubber band. (For interpretation of the references to colour in thisfigure legend, the reader is referred to the web version of this article.)
aflash (Fig. 3A and D). Since the image of the arena was asymmetric in the photographs, the perspective view of the camera was corrected to orthographic by stretching the cropped image of the arena to a square (Fig. 3D and E;Supplementary Figs. S3B and C). The central zone of the image where the rubber band was located was excluded from the evaluation (Fig. 3F). Each photograph was evaluated by manually de- ploying marks on all thrips in the image (yellow points inFig. 3F) to identify the position of individual thrips with custom-developed soft- ware. Then the geometric centre (centre of mass) of these thrips posi- tions was calculated and termed the centroid point. The bias of the centroid point from the arena centre, termed the centroid bias, was obtained using a Cartesian coordinate system with its origin defined at the arena centre (see evaluation image 3F). Thus, the collective centre of mass (with equal weighting) of all thrips positions (yellow dots on Fig. 3F) provided the centroid point and the vector pointing from the arena centre to the centroid point provided the centroid bias (Fig. 3F).
For a given light stimulus the length of this centroid bias vector pro- vided the magnitude of the collective movement of thrips in milli- meters, and the angle of the centroid bias vector provided the direction of collective movement of thrips. As the light gradient was horizontal with our light stimuli, we used the horizontal component of the cen- troid bias (horizontal centroid bias) towards the bright side of the arena as a quantitative measure of attraction to light (Fig. 3F). We used the vertical component of centroid bias (vertical centroid bias) to test for any correlation between the collective horizontal (phototactic) and vertical (geotactic) displacements of thrips for different light wave- lengths and intensities.
In a given stimulus sequence the role of the 3-min-long inter-sti- mulus dark periods was twofold: (1) To re-establish dark adaptation of the eye and (2) the insects needed time to distribute randomly in the arena after the previous light stimulus. We intentionally omitted taking a photo before the light stimuli because the intensity of theflash would have interfered with the dark adaptation of thrips. However, it was necessary to verify the assumption that thrips distributed randomly in darkness. For this, in a separate control experiment, 15 photographs were taken at the end of 15 separate inter-stimulus dark intervals of a previously described stimulus sequence and the images were evaluated as described above. In other words, the arena was photographed in 15 cases just prior to the light stimulus presented at the end of a 180-s-long inter-stimulus interval. One-sample t-tests were performed to test whether the horizontal and vertical centroid bias distribution of thrips in darkness differed from zero at the end of these 15 separate inter- stimulus dark intervals.
Preliminary tests showed that thrips survived more than 10 h be- tween the quartz layers so insects did not perish during the measure- ments. The experiments were performed at 50–55% relative humidity and 23–25 °C. All together, 1674 responses were recorded during 30 tests with a total number of 1900 specimens. Components of the setup were not moved during the 6-week-long period of behavioural experi- ments, except for the arena, but it was positioned at the same place in all tests. Behavioural tests were performed during the same period of the day as for ERG recordings (from 10:00 to 18:00).
To calculate the action spectrum of thrips phototaxis we almost completely adopted the method ofMazza et al. (2010). The horizontal centroid biases (phototactic responses) were plotted as a function of the log of the stimulating light intensity for the 11 wavelengths tested, and sigmoid dose-response curves were fitted to these values. The action spectrum of phototaxis can be obtained by calculating for all wave- lengths the reciprocal of light intensity required to elicit a given stan- dard response criterion. For the standard response criterion, the hor- izontal centroid bias value ofb= 2.62 mm was chosen as the mean function value of the 11fitted dose-response curve inflection points. In other words, taking into account all 11 wavelengths,bwas the mean response at the transition between no attraction and maximal attrac- tion. To test the robustness of the obtained action spectrum, these calculations were performed for an additional 20 criterion responses in
theb ± 1 mm range. Finally, these 21 action spectra were averaged and 95% confidence intervals were calculated for each point of the resulting mean action spectrum.
2.4. Statistics
In the behavioural experiments, to overcome the problem of pseu- doreplication originating from comparing the horizontal centroid biases with the control distribution, we used a linear mixed model followed by Dunnett's post hoc test. Light intensity was included as fixed and random factor. Thus, for each light intensity, we tested whether the distribution of responses (horizontal centroid biases of thrips) sig- nificantly differed from the centroid bias distribution obtained from the 15 photographs of the separate control experiment performed in darkness. Shapiro-Wilk normality tests and one-sample t-tests were performed, respectively, to test for normality of the centroid biases in control measurements and to test for zero bias. For each wavelength we also tested the significance of Pearson’s correlation coefficients between horizontal (phototaxis) and vertical movement (geotaxis) ofT. tabaciin the arena. Statistical tests were made with the R statistical package v3.6.0 (R Core Team, 2013).
3. Results 3.1. ERG recordings
ERG recordings performed on dark-adapted L2 biotype T. tabaci resulted in the spectral sensitivity curve shown inFig. 4. The curve is unimodal with a shoulder in the UV range. The dashed line represents thefitted absorption curve peaking at λmax= 521 nm. The spectral sensitivity curves of the UV-adapted and green-adapted eye prepara- tions as measured in the 320 nm–520 nm range are shown onFig. 5. It is clear that in the case of the UV-adapted eyes no preparation showed a peak in the UV range (Fig. 5A and B). However, relative to the green light sensitivity, an increase in responsiveness to UV-wavelengths is apparent following adaptation with green light (Fig. 5C and D). This increase is an indication of presence of UV receptor cells in the eye besides another type, presumably green.
3.2. Behaviour
After evaluating the 15 photos of the control situations (180 s in
Fig. 4.Mean spectral sensitivity of 16 eyes of individual dark-adaptedT. tabaci as established by ERG recordings. Vertical bars denote standard deviations of the mean and the dashed line represents thefitted photopigment absorption spectrum.
Á. Egri, et al. Journal of Insect Physiology 121 (2020) 103999
dark) we established that the horizontal and vertical centroid biases of thrips in darkness were x0 = −0.038022 ± 2.515695 mm and y0 = 2.259629 ± 3.509448 mm (mean ± standard deviation) (Fig. 6L). According to Shapiro-Wilk normality test these distributions were normally distributed (x0: W = 0.98151, p = 0.9788; y0: W = 0.94951, p = 0.5167). The vertical centroid bias distributiony0
differed but the horizontal centroid bias distributionx0did not differ significantly from zero (one-sample t-tests). Accordingly, the distribu- tion ofx0was taken into account for statistical testing of whether a light stimulus elicited a significant response.
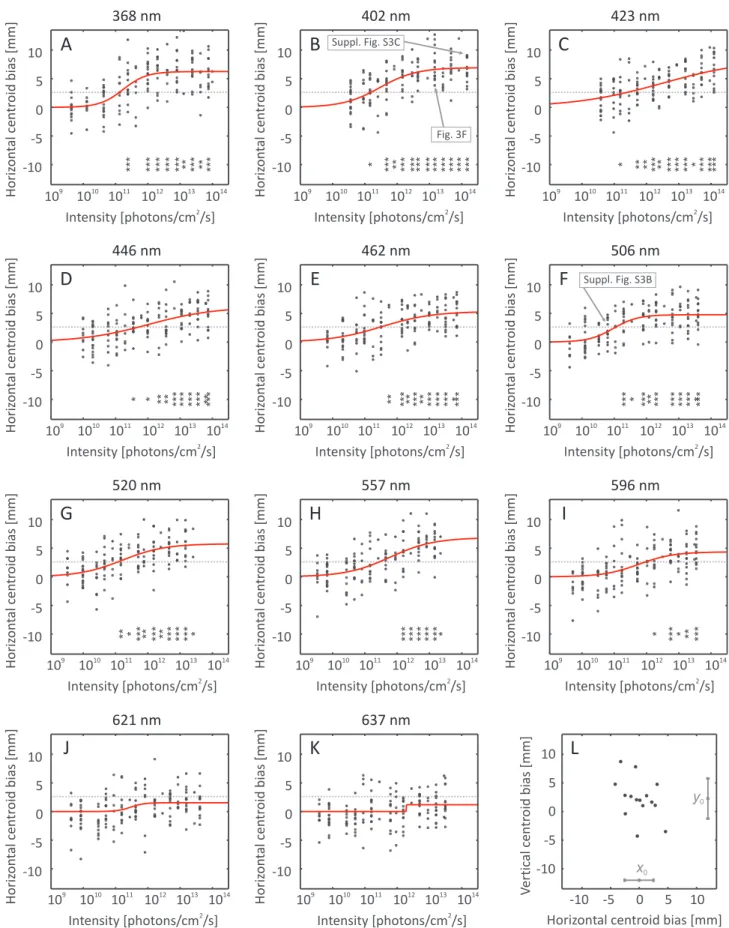
Fig. 6A–K show the phototactic responses (horizontal centroid biases) of T. tabacias a function of log light intensity for the 11 wa- velengths tested. Positive values mean attraction to the bright side of the arena. Fitted intensity-response curves are also displayed and da- shed lines represent theb-standard response criterion. It is clear from the graphs that the responses distribute around zero for low stimulus intensities. With increasing intensity the responses increase and tend to saturate. This is understandable since thrips could not leave the arena and could accordingly only accumulate in its preferred bright side.
Asterisks indicate when responses corresponding to a given light in- tensity differ significantly from the horizontal centroid bias distribution of control measurements (Fig. 6L). Significant phototactic attraction could be elicited with sufficiently high light intensities, except for red wavelengths (621 nm and 637 nm). ObservingFig. 6helps understand whyb= 2.62 mm was chosen for the standard response criterion as the average of all 11 sigmoid inflection points, corresponding to the mean
horizontal centroid bias of thrips between‘no response’and‘maximal response’states.
Fig. 7displays scatter plots of all measured horizontal and vertical centroid biases with regression lines for wavelengths of 368 nm and 520 nm. The same graphs for the other 9 wavelengths are shown in Supplementary Fig. S4. Pearson’s correlation coefficientsrandpvalues are shown in these graphs. Positive correlation (r > 0) indicates that the light simulus elicited not only attraction to light but also upward movement of thrips within the arena, while negative correlation (r < 0) indicates downward movement when light was present. Thrips tended to move collectively downward (positive geotaxis) in case of light stimuli in human-visible wavelengths (Fig. 7B). This permits us to conclude that geotaxis may not be independent of phototaxis inT. ta- baci.
The calculated action spectrum of phototaxis ofT. tabaciis shown in Fig. 8A. Contrary to the dark-adapted spectral sensitivity curve (Fig. 4), the attraction is bimodal with local maxima being practically the same in magnitude. The two most attractive wavelengths wereλ1= 368 nm (UV) andλ2= 506 nm (green), but nearly the same level of attraction was also obtained for 520 nm. The location of the second (green) peak in the action spectrum at 506 nm is very near the peak of the spectral sensitivity curve measured here by ERG from dark-adapted T. tabaci eyes. The peak in spectral sensitivity at 360 nm that appeared in the case of the green-adapted eyes (Fig. 5C and D) is very near to λ1
measured in the behaviour experiments (Fig. 8A).
Fig. 8B displays Pearson’s correlation coefficients (data inFig. 7and Fig. 5.Spectral sensitivities of 5T. tabaciUV-adapted (λadap,UV= 360 nm) eyes (A and B) and of 9T. tabacigreen-adapted (λadap,G= 550 nm) eyes (C and D). ERG recordings were made in the 320 nm–520 nm spectral range. Vertical bars (A and C) denote standard deviations and the different colours (B and D) represent the different eye preparations. (For interpretation of the references to colour in thisfigure legend, the reader is referred to the web version of this article.)
Fig. 6.Phototactic responses ofT. tabaciin behavioural experiment. (A-K) Responses at 11 wavelengths of light withfitted intensity-response curves. Each point corresponds to a photo and denotes evaluated horizontal centroid bias towards the brighter side of the arena (cf.Fig. 3F). Dotted lines show the standard response criterion (b= 2.62 mm), and asterisks indicate responses significantly different from the horizontal centroid bias distribution measured in darkness according to Dunnett’s post hoc test (*p < 0.05, **p < 0.01, ***p < 0.001). (L) Horizontal and vertical centroid coordinatesx0andy0(centroid biases) of thrips in the 15 photographs of the separate control experiment performed in darkness; means and standard deviations ofx0andy0are shown at the bottom and on the right of the plot.
Á. Egri, et al. Journal of Insect Physiology 121 (2020) 103999
Supplementary Fig. S4) as a function of wavelength. A negative corre- lation (positive geotaxis) occurred for almost all wavelengths. Sig- nificant correlations were obtained at wavelengths between 423 nm and 557 nm and the highest, but non-significant positive correlation (negative geotaxis), was obtained at 368 nm.
4. Discussion
Thefirst thrips electroretinogram was measured byMatteson et al.
(1992) on Frankliniella occidentalis (Pergande, 1895). However, the spectral sensitivity curve was determined within the visible spectrum and while only a single wavelength (365 nm) was measured in the UV-A range it became clear that the compound eye of F. occidentalis is maximally sensitive to green and UV light. Recently,Otani et al. (2014) revealed that the peak UV sensitivity is in the UV-A range forF. occi- dentalis. Later, two other thrips species have been reported to perceive UV-A light including the L1 biotype of T. tabaci(Kishi et al., 2014;
Makabe et al., 2014). These studies included behavioural experiments to show that these species are generally positively phototactic and are attracted both to UV-A and green light.
According toMakabe et al. (2014),T. tabacibiotype L1 compound eyes were maximally sensitive at 362 nm and 532 nm. In behavioural tests they found that thrips were strongly attracted to wavelengths around 350 nm, more strongly than to light of 525 nm wavelength. Our behavioural experiments provided qualitatively the same results but with nearly equal attraction to UV-A and green light. The strongest attraction ofT. tabacibiotype L2 to light was elicited by UV-A (368 nm) and green (506 nm–520 nm) spectral regions (Fig. 8A). We have also established that the spectral sensitivity of biotype L2 compound eye has only one striking green peak at 521 nm with only a small shoulder in the UV-A range (Fig. 4). This prompted us to measure the spectral sensitivity with eye preparations adapted to monochromatic UV and green light to verify whether UV receptor cells are present or not. In UV-adapted eyes, UV receptor cells (if there are any) become light adapted and their responses are suppressed, and in the case of green- adaptated eyes the green receptor cells become less sensitive such that the response magnitudes of UV receptor cells should increase relative to the response of green ones. According to the spectral sensitivities measured with UV- and green-adapted eyes (Fig. 5), we suggest that UV receptor cells are present inT. tabacibiotype L2 but their number must be significantly lower than green receptor cells as ERG recordings on dark-adapted specimens showed no peak in the UV range. In each ERG recording the electrodes were inserted into different regions of the eye but we could not identify regions possessing a higher density of UV receptor cells. We accordingly suggest that UV-sensitive receptor cells are distributed more or less evenly across the compound eye. The question may arise as to whether the geometry of our ERG setup con- tributed to the measured low UV sensitivity. Since thrips were prepared on a platform with their dorsal side up, the ventral eye region was less stimulated than the lateral and dorsal regions. Nevertheless, our pre- paration method was the same as the method ofMatteson et al. (1992) and Makabe et al. (2014)whose respective studies revealed a UV sen- sitivity comparable to the green sensitivity inF. occidentalisand theT.
tabaciL1 biotype. Accordingly, we suggest that the low UV sensitivity recorded here in theT. tabaciL2 biotype was not a consequence of the methodology.
Having sparsely distributed ommatidia characterised by features significantly different from that of the majority of ommatidia in the eye is not uncommon among thrips. In American bean thrips, Caliothrips phaseoli(Hood, 1912)Mazza et al. (2010)found thatfluorescent pig- ments, except for a defined set of six ommatidia, shift the spectral sensitivity to the UV-B region of the spectrum. In our case, we suggest that the UV receptor cells of the L2T. tabacibiotype could only play a role in determining the spectral composition of global illumination, since forming an image may be difficult with a low number of receptor cells. It is also possible that UV-perception inT. tabaciis directionally sensitive with UV receptors located in the ventral eye region. It has been reported that various thrips species includingT. tabaciavoid en- tering plastic tunnels clad with UV-light blocking material (Ben-Yakir et al., 2008). On the other hand, highly UV-reflective white traps catch T. tabaciin numbers one order of magnitude less than low UV-reflective white traps (Kirk, 1984). Damage to the visual system caused by high Fig. 7.Scatter plot of horizontal and vertical components of all measuredT.
tabacicentroid biases for 368 and 520 nm light wavelengths. Regression lines are in red, rdenotes Pearson’s correlation coefficient andp indicates the p- value. (For interpretation of the references to colour in thisfigure legend, the reader is referred to the web version of this article.)
Fig. 8.Phototaxis and geotaxis ofT. tabacias a function of light wavelength.
(A) Normalized action spectrum ofT. tabaciphototaxis. Points and vertical bars denote means ± 95% confidence intervals calculated from the 21 action spectra. Dashed line shows linear interpolation. (B) Pearson’s correlation coefficients obtained from correlation analyses between horizontal and vertical centroid biases as a function of wavelength; asterisks indicate significant cor- relation (p < 0.05).
UV levels has already been reported for a stored product pest, Psy- llipsocus ramburi (Selys-Longchamps, 1872) (Meyer-Rochow and Mishra, 2007). These examples highlight the significance of UV-light perception ofT. tabaci. As all ERG recordings were performed during the same period of the day, changes in the relative spectral sensitivity of green receptor cells compared to UV ones are most likely not due to diurnal changes in spectral sensitivity as observed in the isopodLigia exotica(Roux, 1828) (Hariyama et al., 1986).
Four pest thrips species have been reported by ERG recordings to perceive UV-A light:F. occidentalis(Matteson et al., 1992; Otani et al., 2014),Scirtothrips dorsalis(Hood, 1919) (Kishi et al., 2014), L1 biotype ofT. tabaci(Makabe et al., 2014) and L2 biotype ofT. tabaci(present study). The spectral sensitivity of the compound eyes are strikingly si- milar in thefirst three species that reproduce by arrhenotoky: a definite peak sensitivity in the UV-A range at around 365 nm and another peak in the green range at around 520–540 nm. In contrast, the spectral sensitivity of the thelytokous L2 biotype ofT. tabacihas a single peak at around 521 nm (green), although presence of UV-A receptor cells has been confirmed (Fig. 5). It should be noted that the exact methodology for these studies were not the same. For example,Makabe et al. (2014) used broad bean as food for the colony, while we used cabbage. Until the different biotypes are tested under the same experimental condi- tions it is difficult to make a valid comparison between them.
The behavioural experimental setup allowed us to test the connec- tion between phototaxis and geotaxis of T. tabaci. Generally thrips tended to move collectively downward (positive geotaxis) in case of light stimuli in the human-visible wavelengths (Fig. 8B;Supplementary Fig. S4A-H). However, upward movement (negative geotaxis) was eli- cited by UV-A light, but this was not significant (Fig. 7A). Our results suggest that phototaxis of T. tabaci is connected with geotaxis, and lights of different spectral composition may trigger different geotactic behaviours. Light-induced geotaxis was observed, for example, bySwift and Forward (1988)in larvae of the phantom midgeChaoborus punc- tipennis(Say, 1823). In the case of thrips, it has already been demon- strated thatF. occidentalisadults escape from nematode attack by ne- gative geotaxis (Ebssa et al., 2004), a strategy that may also be present in T. tabaci. On the other hand, green-light-induced positive geotaxis could serve to bring thrips to older more nutritious leaves than to tender shoots whereas negative geotaxis connected with UV-light could facilitate dispersal.
Although we found a significant difference in the spectral sensitivity of T. tabaciL2 biotype compared to the L1 biotype, it turns out that attraction to light in both biotypes as a function of wavelength does not differ notably. Thus, UV-A light also represents an important spectral component which must be taken into consideration for the L2T. tabaci biotype when designing visually attractive traps, especially when sus- tainable agriculture is the goal.
CRediT authorship contribution statement
Ádám Egri: Conceptualization, Methodology, Software, Investigation, Formal analysis, Validation, Resources, Writing - original draft, Writing - review & editing, Visualization, Project administration, Funding acquisition. Péter Farkas: Investigation, Formal analysis, Validation, Data curation, Writing - review & editing.Balázs Bernáth:
Conceptualization, Methodology, Software, Writing - original draft.
Patrick M. Guerin:Resources, Writing - review & editing, Supervision, Project administration, Funding acquisition. József Fail: Resources, Writing - original draft, Writing - review & editing, Supervision, Project administration, Funding acquisition.
Declaration of Competing Interest
The authors declare that they have no known competingfinancial interests or personal relationships that could have appeared to influ- ence the work reported in this paper.
Acknowledgements
This research was supported by the Hungarian Ministry for Innovation and Technology within the framework of the Higher Education Institutional Excellence Program (NKFIH-1159-6/2019) in the scope of plant breeding and plant protection research at Szent István University. J. Fail and Á. Egri were supported by the János Bolyai Research Scholarship of the Hungarian Academy of Sciences. J. Fail was supported by the ÚNKP-18-4-SZIE-26 New National Excellence Program of the Hungarian Ministry of Human Capacities. The work was supported by the Hungarian Economic Development and Innovation Operational Programme (GINOP-2.3.2-15-2016-00057). We gratefully acknowledge grant no. 943 from the Velux Foundation (Kirchgasse 42, 8001 Zürich, Switzerland) to fund research on vision in insect vectors of disease at the University of Neuchâtel, Switzerland.
Appendix A. Supplementary data
Supplementary data to this article can be found online athttps://
doi.org/10.1016/j.jinsphys.2019.103999.
References
Altschul, S.F., Gish, W., Miller, W., Myers, E.W., Lipman, D.J., 1990. Basic local alignment search tool. J. Mol. Biol. 215, 403–410.
Balan, R.K., Ramasamy, A., Hande, R.H., Gawande, S.J., Krishna Kumar, N.K., 2018.
Genome-wide identification, expression profiling, and target gene analysis of microRNAs in the onion thrips,Thrips tabaciLindeman (Thysanoptera: Thripidae), vectors of tospoviruses (Bunyaviridae). Ecol. Evol. 8, 6399–6419.
Ben-Yakir, D., Hadar, M.D., Offir, Y., Chen, M., Tregerman, M., 2008. Protecting crops from pests using OptiNet®screens and ChromatiNet®shading nets. Acta Hortic. 770, 205–212.
Brunner, P.C., Chatzivassiliou, E.K., Katis, N.I., Frey, J.E., 2004. Host-associated genetic differentiation inThrips tabaci(Insecta; Thysanoptera), as determined from mtDNA sequence data. Heredity 93, 364–370.
Czencz, K., 1987. The role of coloured traps in collecting thrips fauna. pp. 426–435. In:
Holman, J., Pelikan, J., Dixon, A.F.G., Weisman, L. (Eds.), Population structure, ge- netics and taxonomy of aphids and Thysanoptera. Proceedings of International Symposia, held at Smolenice, Czechoslovakia, September 9-14, 1985. SPB Academic Publishing, The Hauge, pp. 542.
De Barro, P.J., Driver, F., 1997. Use of RAPD PCR to distinguish the B biotype from other biotypes ofBemisia tabaci(Gennadius) (Hemiptera: Aleyrodidae). Aust. J. Entomol.
36 (2), 149–152.
DeVoe, R.D., de-Souza, J.M., Ventura, D.F., 1997. Electrophysiological measurements of spectral sensitivities: a review. Braz. J. Med. Biol. Res. 30, 169–177.
Ebssa, L., Borgemeister, C., Poehling, H.M., 2004. Effectiveness of different species/
strains of entomopathogenic nematodes for control of westernflower thrips (Frankliniella occidentalis) at various concentrations, host densities, and temperatures.
Biol. Control 29, 145–154.
Fail, J., 2016. Speciation inThrips tabaciLINDEMAN, 1889 (Thysanoptera): the current state of knowledge and its consequences. Polish J. Entomol. 85, 93–104.
Farkas, P., György, Z., Tóth, A., Sojnóczki, A., Fail, J., 2019. A simple molecular identi- fication method of theThrips tabaci(Thysanoptera: Thripidae) cryptic species com- plex. Bull. Entomol. Res. 1–9.https://doi.org/10.1017/S0007485319000762.
Fekrat, L., Manzari, S., Shishehbor, P., 2014. Morphometric and molecular variation in Thrips tabaciLINDEMAN(Thysanoptera: Thripidae) populations on onion and tobacco in Iran. J. Agric. Sci. Technol. 16, 1505–1516.
Gent, D.H., du Toit, L.J., Fichtner, S.F., Mohan, S.K., Pappu, H.R., Schwartz, H.F., 2006.
Iris yellow spot virus: an emerging threat to onion bulb and seed production. Plant Dis. 90, 1468–1480.
Goldbach, R., Peters, D., 1994. Possible causes of the emergence of tospovirus diseases.
Seminars Virol. 5, 113–120.
Hariyama, T., Meyer-Rochow, V.B., Eguchi, E., 1986. Diurnal changes in structure and function of the compound eye ofLigia Exotica(Crustacea, Isopoda). J. Exp. Biol. 123, 1–26.
Jacobson, A.L., Nault, B.A., Vargo, E.L., Kennedy, G.G., 2016. Restricted geneflow among lineages ofThrips tabacisupports genetic divergence among cryptic species groups.
PLoS One 11, e0163882.
Jenser, G., Szénási, Á., Törjék, O., Gyulai, G., Kiss, E., Heszky, L., Fail, J., 2001. Molecular polymorphism between population ofThrips tabaciLINDEMAN(Thysanoptera:
Thripidae) propagating on tobacco and onion. Acta Phytopathol. Entomol. Hungarica 36, 365–368.
Kirk, W.D., 1984. Ecologically selective coloured traps. Ecol. Entomol. 9, 35–41.
Kishi, M., Wakakuwa, M., Kansako, M., Inuma, T., Arikawa, K., 2014. Action spectrum of phototactic behavior and compound eye spectral sensitivity in the yellow tea thrips, Scirtothrips dorsalis Hood (Thysanoptera: Thripidae). Japanese J. Appl. Entomol.
Zool. 58, 13–16.
Klein, M., Gafni, R., 1996. Morphological and molecular variations in thrips populations collected on onion plants in Israel. Folia Entomol. Hungarica 57, 57–59.
Á. Egri, et al. Journal of Insect Physiology 121 (2020) 103999
Kobayashi, K., Hasegawa, E., 2012. Discrimination of reproductive forms ofThrips tabaci (Thysanoptera: Thripidae) by PCR with sequence specific primers. J. Econ. Entomol.
105, 555–559.
Kobayashi, K., Yoshimura, J., Hasegawa, E., 2013. Coexistence of sexual individuals and genetically isolated asexual counterparts in a thrips. Sci. Rep. 3, 3286.
Kraus, M., Schreiter, G., Moritz, G., 1999. Molecular genetic studies of thrips species. In:
Vierbergen, G., Tunç, I. (Eds.), Proceedings of the Sixth International Symposium on Thysanoptera. Akdeniz University, Antalya, pp. 77–80.
Lu, F.M., 1990. Color preference and using silver mulches to control the onion thrips, Thrips tabaciLindeman. Chin. J. Entomol. 10, 337–342.
Makabe, T., Futamura, T., Noudomi, T., Wakakuwa, M., Arikawa, K., 2014. Phototaxis of Western Flower Thrips,Frankliniella occidentalisand Onion Thrips,Thrips tabaciand the Possibility of Controlling Thrips Using Ultraviolet-emitting Trap in the Greenhouse of Satsuma Mandarin (Citrus unshiu). Japanese J. Appl. Entomol. Zool.
58, 187–195.
Matteson, N., Terry, I., Ascoli-Christensen, A., Gilbert, C., 1992. Spectral efficiency of the westernflower thrips,Frankliniella occidentalis. J. Insect Physiol. 38, 453–459.
Maximov, V., 1988. Approximation of visual pigment absorption spectra. Sensornye Sistemy, 2, 5-9. (In Russian, English translation is available.).
Mazza, C.A., Izaguirre, M.M., Curiale, J., Ballare, C.L., 2010. A look into the invisible:
ultraviolet-B sensitivity in an insect (Caliothrips phaseoli) revealed through a beha- vioural action spectrum. Proc. R. Soc. B: Biol. Sci. 277, 367–373.
Meyer-Rochow, V.B., Mishra, M., 2007. Structure and function of dark- and light-adapted as well as UV-exposed eyes of the food store pestPsyllipsocus ramburiSelys- Longchamps (Insecta; Psocoptera; Psyllipsocidae). J. Insect Physiol. 53, 157–169.
Moritz, G., Morris, D., Mound, L.A., 2001. ThripsID–Pest thrips of the world. An inter- active identification and information system. CD-ROM. ACIAR, CSIRO Publishing Collingwood, Victoria, Australia.
Mound, L.A., Kibby, G., 1998. Thysanoptera. An Identification Guide, second ed. CAB International, Wallingford, UK.
Natwick, E.T., Byers, J.A., Chu, C.C., Lopez, M., Henneberry, T.J., 2007. Early detection and mass trapping ofFrankliniella occidentalisandThrips tabaciin vegetable crops.
Southwestern Entomol. 32, 229–238.
Otani, Y., Wakakuwa, M., Arikawa, K., 2014. Relationship between action spectrum and spectral sensitivity of compound eyes relating phototactic behavior of the western flower thrips,Frankliniella occidentalis. Japanese J. Appl. Entomol. Zool. 58, 177–185.
R Core Team, 2013. R: a language and environment for statistical computing. R Foundation for Statistical Computing, Viennahttp://www.R-project.org/.
Rőth, F., Galli, Zs, Tóth, M., Fail, J., Jenser, G., 2016. The hypothesized visual system of Thrips tabaciLINDEMANandFrankliniella occidentalis(PERGANDe) based on different co- loured traps’catches. North-Western J. Zool. 12, 40–49.
Shields, E.J., 1989. Artificial light: experimental problems with insects. Bull. ESA 35, 40–45.
Sojnóczki, A., Pájtli, É., Reiter, D., Farkas, P., Fail, J., 2015. Comparative study ofThrips tabaciLINDEMANcytochrome-c oxidase gene subunit I (COI) sequences data. Die Bodenkultur 66, 41–45.
Swift, M.C., Forward Jr., R.B., 1988. Absolute light intensity vs. rate of relative change in light intensity: the role of light in the vertical migration ofChaoborus Punctipennis Larvae. Bull. Marine Sci. 43, 604–619.
Szénási, A., Jenser, G., Zana, J., 2001. Investigation on the colour preference ofThrips tabaciLINDEMAN (Thysanoptera: Thripidae). Acta Phytopathol. Entomol. Hungarica 36, 207–211.
Tedeschi, R., Ciuffo, M., Mason, G., Roggero, P., Tavella, L., 2001. Transmissibility of four tospoviruses by a thelytokous population ofThrips tabaci from Liguria, Northwestern Italy. Phytoparasitica 29, 37–45.
Terry, L.I., 1997. Host selection, communication and reproductive behaviour, pp. 65–118.
In: Lewis, T. (Ed.), Thrips as Crop Pests. CAB International, Oxon, UK, pp. 740.
Teulon, D.A.J., Penman, D.R., 1992. Colour preferences of New Zealand thrips (Terebrantia: Thysanoptera). New Zealand Entomol. 15, 8–13.
Toda, S., Murai, T., 2007. Phylogenetic analysis based on mitochondrial COI gene se- quences in Thrips tabaci Lindeman (Thysanoptera: Thripidae) in relation to re- productive forms and geographic distribution. Appl. Entomol. Zool. 42, 309–316.
Trdan, S., 1999. Colour preference of some economically important Thysanoptera species, pp. 493–498. In: Proceedings, Symposium: 4th Slovenian Conference on Plant Protection, 3-4 March 1999, Portorož, Slovenia. Plant Protection Society of Slovenia, Ljubljana, Sl.
Vernon, R.S., Gillespie, D.R., 1995. Influence of trap shape, size and background color on captures ofFrankliniella occidentalis(Thysanoptera: Thripidae) in a cucumber greenhouse. J. Econ. Entomol. 88, 288–293.
Westmore, G.C., Poke, F.S., Allen, G.R., Wilson, C.R., 2013. Genetic and host-associated differentiation withinThrips tabaciLINDEMAN(Thysanoptera: Thripidae) and its links to Tomato spotted wilt virus-vector competence. Heredity 111, 210–215.
Zawirska, I., 1976. Untersuchungen über zwei biologische Typen vonThrips tabaciLind.
(Thysanoptera, Thripidae) in der VR Polen. Archiv für Phytopathologie und Pflanzenschutz 12, 411–422.