Size-dependent aggregation of graphene oxide
Tamas Szabo
a,*, Plinio Maroni
b, Istvan Szilagyi
a,c,**aInterdisciplinary Excellence Center, Department of Physical Chemistry and Materials Science, University of Szeged, H-6720, Szeged, Hungary
bDepartment of Inorganic and Analytical Chemistry, University of Geneva, CH-1205, Geneva, Switzerland
cMTA-SZTE Lendület Biocolloids Research Group, University of Szeged, H-6720, Szeged, Hungary
a r t i c l e i n f o
Article history:
Received 25 October 2019 Received in revised form 2 January 2020 Accepted 6 January 2020 Available online 7 January 2020
a b s t r a c t
Graphene oxides (GO) of highly polydisperse size distribution were prepared by the Brodie method and their dispersion stability was characterized. Exfoliation and fractionation led to well-defined particle populations in the Nano, classical Colloidal (submicron) and Micrometer size ranges, as revealed by atomic force microscopy and light scattering measurements. Time-resolved dynamic light scattering experiments revealed that aggregation processes are fully impeded in the intermediate pH regime of 3 e13 in the absence of electrolytes. While the resistance against salt-induced aggregation increases with the pH due to the progressive ionization of the surface functional groups of GO sheets, their dispersions are inherently unstable at supramillimolar concentrations of strong acids and submolar concentrations of bases, in line with the DLVO theory. However, the aggregation behavior quantified by the critical coagulation concentrations (CCCs) shows surprisingly substantial platelet size dependence. The CCC of Nano Brodie-GO reaches 360 mMat pH¼12, which is one of the highest values ever reported for GO aqueous dispersions. These results provide useful quantitative information to design processable GO dispersions of pH- and size-tunable stability for future applications.
©2020 The Author(s). Published by Elsevier Ltd. This is an open access article under the CC BY license (http://creativecommons.org/licenses/by/4.0/).
1. Introduction
Much effort has been recently applied to design and fabricate multifunctional graphene-based materials both as bulk solids and as ultrathinfilms [1e5]. The most sensible and popular strategies for obtaining tailored graphene or graphene-like nanostructures by large scale production rely on liquid-phase exfoliation (individual separation of elementary graphene layers) of graphite to graphene oxide. This process involves the oxidation of bulk graphite to graphite oxide (the multilayered assembly containing coherent domains of equally spaced graphene oxide layers) and the exfoli- ation of graphite oxide to graphene oxide (denoted henceforth as GO) in a proper solvent or solution [6e9]. Exfoliated GO sheets form stable aqueous dispersions largely owing to the electrostatic repulsion among the deprotonated functional groups, such as car- boxylates [10].
Aggregation of these two-dimensional sheets may then be
either a desired or an unwanted process depending on the specific application considered [11,12]. Restacking of the layeredfiller is particularly attractive for interstratified [13] and intercalated composites [14,15] or for porous/pillared carbons [16e19], while it should be avoided for exfoliated nanocomposites, where homoge- neous dispersion and high contact surface area with the host ma- trix is demanded [20e23]. The prevention of aggregation is also of especial importance for the deposition of mono and multilayered graphene films, because their nanoscale architecture must be tailored on the size level of individual sheets in order to exploit their unique properties [24e27].
Accordingly, the key step towards the production of processable aqueous dispersions of GO is the understanding and delicate con- trol of their colloidal stability. It has been a common knowledge for long time that both (multilayered) graphite oxide and (single layered) graphene oxide dispersions coagulate under highly acidic conditions due to the loss of surface charge [28,29]. However, the classical theory of dispersion stability developed by Derjaguin, Landau, Verwey and Overbeek (DLVO) [30,31] predicts that even highly charged colloidal GO particles should aggregate at high ionic concentrations provided by bases and simple salts due to extensive charge screening, which reduces the thickness of the diffuse elec- tric double layer at the particle surfaces so much that the attractive
*Corresponding author.
**Corresponding author. MTA-SZTE Lendület Biocolloids Research Group, Uni- versity of Szeged, H-6720, Szeged, Hungary.
E-mail addresses: sztamas@chem.u-szeged.hu (T. Szabo), szistvan@chem.u- szeged.hu(I. Szilagyi).
Contents lists available atScienceDirect
Carbon
j o u rn a l h o m e p a g e :w w w . e ls e v i e r . c o m / l o c a t e / c a r b o n
https://doi.org/10.1016/j.carbon.2020.01.022
0008-6223/©2020 The Author(s). Published by Elsevier Ltd. This is an open access article under the CC BY license (http://creativecommons.org/licenses/by/4.0/).
van der Waals force will be the dominating interparticle interac- tion. This behavior was qualitatively confirmedfirst for NaCl solu- tion on the basis of visual observation [32]. Follow-up studies based on centrifugation or gravitational settling tests enabled for more precise characterization of the kinetic stability by estimation of the critical coagulation concentration (CCC) of GO dispersions in the presence of other monovalent salts [33e37].
Although visual observation on the sedimentation may give a practically useful semi-quantitative picture on the storage stability of particle dispersions, this can be very misleading concerning the true colloidal stability. This is because (1) the aggregation state strongly depends on the time window investigated, (2) larger pri- mary particles may settle even in the absence of aggregation and (3) both single and aggregated particles forming a coherent struc- ture may exhibit hindered settling due to multiparticle hydrody- namic interactions and thus, remain dispersed for extended time periods [38].
In their inspiring papers, Chowdhury et al. [39,40] gave a better approximation of the CCC of GO dispersions by time-resolved dynamic light scattering (DLS). In these studies, the resistance against NaCl-induced aggregation was systematically investi- gated, however, the CCC values changed for GO particles of different sizes (Table 1). Subsequently, Wu et al. [41] published another set of CCC, which were substantially larger. Yang et al. [42]
reported very similar CCC data for GO platelets dispersed in NaCl and KCl electrolyte solutions. However, significantly different CCC values have been recently published by Wang et al. [43] for GO particles in the above salt solutions. These strongly inconsistent data reflect that a wide range of experimental parameters such as pH [44], the degree of oxidation [45] and exfoliation along with the size of particles [46] may affect the aggregation behavior of GO in electrolyte solutions.
Herein, we contribute to the recent efforts to quantify the colloidal stability of aqueous GO dispersions. In particular, we aim at (1) exploring the size dependence ranging from the nanoscale to the micron scale and (2) clarification of the effect of pH and (3) the ionic strength on the aggregation kinetics in light of the previously published contradictory results. Additionally, the oxidation method is also expected to influence the stability via the demonstrated difference in the surface chemistry and physicochemical properties such as exfoliation behavior or osmotic versus crystalline swelling [47,48]. Since the existing knowledge was accumulated solely for GO prepared by the Hummers’ method, a special aspect of the present research lies in the choice of a unique GO sample obtained by Brodie’s protocol [49].
2. Experimental 2.1. Chemicals
All the chemicals were purchased from Sigma Aldrich and applied without further purification. Ultrapure water (Millipore) was used throughout the experiments and it wasfiltered with a syringefilter of 100 nm pore size (Millex) to avoid the presence of dust contaminants.
2.2. Preparation of size fractionated GO dispersions
The raw GO sample used in this study is identical with the one obtained after double oxidation by the Brodie method described in an earlier publication [49]. The chemical composition of this sam- ple is described by the C2O0.9H0.35empirical chemical formula, not including water of hydration of ca. 10 wt% at 50% relative humidity.
The C/O ratio of 2.22 indicates that this sample is well oxidized, in line with the XPS-basedfindings (e.g. the lack of aromaticity rep- resented by the absence of the 284 eV peak of the C1s envelope).
For the exfoliation, GO (1 g) was mixed with water (10 mL) and the obtained slurry was wet-ground in an agate ball mill for 7 h and then quantitatively transferred to a 1L volumetricflask, which was thenfilled with water leading to a dispersion of 1 g L1solid con- tent. Thereafter, 40 mL of this sample was exfoliated by setting the pH to 9, while maintaining a background salt level of 10 mM by adding appropriate amounts of 1MKOH and KCl solutions followed by sonication for 5 min and overnight stirring. The GO particles were then partitioned into three different size fractions by centri- fugation of their dispersions in 15 mL polycarbonate tubes by an Avanti J-30I high performance centrifuge equipped with JS-13.1 swinging-bucket rotor (Beckman Coulter). Thefirst fraction con- taining the smallest particles (denoted as Nano GO) was obtained by centrifugation at 6800 rpm for 10 min followed by passing the supernatant through a syringefilter containing a cellulose acetate membrane of 800 nm nominal pore size to remove traces of large platelets and other particulate contaminants. The second fraction (denoted as Colloid GO) was collected after centrifugation at 8000 rpm for 20 min withoutfiltration. Finally, the third dispersion (denoted as Micron graphite oxide) was obtained by differential centrifugation. This involved the following steps: (1) centrifugation of the exfoliated stock at 2720 rpm for 10 min to remove the largest particles; (2) centrifugation of the separated supernatant at 6800 rpm and (3) redispersion of the wet sediment in 10 mMKCl.
The steps (2) and (3) were then repeated twice more in order to ensure that the smallest particles trapped in the sediment after step (2) were removed.
Table 1
Preparation method, size and CCC values (determined in monovalent salt solutions) of GO particles.
Authors (year) Synthesis method Initial equivalent diameter [nm]a CCC [mM] (conditions specified)b
Chowdhury et al. (2013) [39] Hummers-Offeman 300 44 (NaCl, pH 5.5)
Wu et al. (2013) [41] Hummers-Offeman 520 24-482 (NaCl), pH-dependent
Chowdhury et al. (2015) [40] Hummers-Offeman 500 200 (NaCl, pH 5.2)
Yang et al. (2016) [42] Hummers-Offeman 300 36 (NaCl, pH 7.0)
28 (KCl, pH 7.0)
Jiang et al. (2016) [45] Hummers-Offeman 320 69 (NaCl, pH 6.0±0.3)
Tang et al. (2017) [46] Hummers-Offeman 150 110 (NaCl, pH 6.5)
Wang et al. (2018) [43] Hummers-Offeman 330 188 (NaCl, pH 6.0)
68 (KCl, pH 6.0)
Present work Brodie 150e1500 50-360 (KCl), pH and size-dependent
aDLS hydrodynamic diameter equivalent with a sphere drawn around the GO platelets.
bDetermined in time-resolved DLS experiments.
2.3. AFM measurements
Images were recorded directly in GO dispersions with a Cypher AFM (Asylum Research) in the amplitude modulation mode. Bio- lever mini cantilevers with silicon nitride tips (BL-AC40TS, Olympus) were used. These tips had a nominal tip radius below 9 nm and resonance frequencies around 30 kHz in water. The spring constants were in the range of 0.12e0.15 N m1as measured upon thermalfluctuations in air. Images were acquired at a scan rate of 0.2e0.5 Hz, free oscillation amplitude of about 23 nm and a set point corresponding to about 70% of the free oscillation amplitude.
Two different types of positively charged surfaces were used as substrates to provide adequate attachment of the negatively charged GO platelets from the liquid phase to the substrate. The Colloid and the Micron graphite oxide fractions were cast on a freshly cleaved mica surface coated with poly(- diallyldimethylammonium chloride) (Mw¼100e200 kDa). Since the sizes of the smallest features found for the Nano GO fraction were comparable to that of the polyelectrolyte patches, in this case, an aminofunctionalized mica surface was used as described else- where [50].
2.4. Zeta potential measurements and assessment of size distribution by DLS
Both zeta potential and hydrodynamic diameter measurements were performed with a ZetaNano ZS (Malvern Instruments) device equipped with a He/Ne laser operating at 633 nm as a light source and an avalanche photodiode as a detector. The instrument applies an electricfield strength of 4 kV m1in the electrophoretic mode.
Size measurements were carried out at a scattering angle of 173. Hydrodynamic diameters were calculated by using a second-order cumulantfit over the correlation function [51], which was accu- mulated in 10 runs, each collected for 25 s. The intensity and number weighted size distribution data were obtained from the instrumental algorithm and they were consistent from run to run.
For the electrophoretic measurements, portions of GO dispersions (0.12 mL) were mixed with water and KCl stock solution to obtain the desired ionic strength. The pH of these dispersions was then adjusted to 9.0±0.3 with KOH solution. The total sample volume was 2 mL. The measurements were performed in plastic capillary cells (Malvern Instruments) that werefirst rinsed extensively with water. The samples were equilibrated for 1 min at 25C in the in- strument before the measurements were taken. The zeta potentials were calculated from the electrophoretic mobilities with the Helmholtz-Smoluchowski equation [52].
2.5. Aggregation kinetics by time-resolved DLS
The time-resolved coagulation kinetic measurements were carried out with a CGS-8F multi-angle goniometer (ALV) equipped with a 532 nm solid-state Verdi V2 laser (at 60scattering angle).
The measurements were carried out in borosilicate glass cuvettes (Kimble Chase) cleaned with a hot piranha solution and rinsed extensively with water followed by drying in dust-free environ- ment. The aggregation experiment was initiated by injecting 0.1 mL of the GO dispersion into the cuvette containing appropriate vol- umes of water, KCl and KOH or HCl stock solutions (to set the desired ionic strength and pH) and rapid mixing with a vortex stirrer. The total volume was 2 mL and the particle concentration of GO was constant within one experimental series and adequately low to keep the aggregation in its early stages. The latter is demonstrated by the slight increase in the hydrodynamic di- ameters within the time window of measurements, while the average size did not increase for stable samples (Supporting
Fig. S1). For the Micron graphite oxide suspension, the apparent hydrodynamic diameters were only very slowly increasing in 20 mM KCl solution (ca. 10% increase in 200 min; Supporting Fig. S2), which reflects that sedimentation effects were negligible even for the largest particles. pH values were measured with an
“Unitrode”combined glass electrode (Metrohm) by calibration of two buffers in the pH¼2e12 pH range. The pH of solutions outside this range were also calculated using the concentration of the added acid or base, and the discrepancies between these two values were always below 0.1 pH unit.
2.6. SLS measurements
Angle-dependent light scattering experiments were performed for stable dispersions of Nano and Colloid GO and Micron graphite oxide with the CGS-8F multi-angle goniometer. The average scat- tering intensities of the dispersions of particle concentrations in the same range as for the time-resolved DLS study were measured in quartz cells in the scattering angle range of 30-160with 2step sizes for 30 s in each step. Relative scattering intensities were calculated as the ratio of the intensity of scattered radiation observed at a certain scattering angle and the intensity of the incident radiation corrected with the scattering volume and the background scattering. The latter was measured in the same cells filled with the dispersion medium under identical conditions.
2.7. X-ray diffraction
X-ray diffraction measurements were performed on a Philips PW 1830 diffractometer operating with Cu anode (40 kV voltage, 30 mA cathodic current). CuKbradiation was absorbed by a Nifilter.
Samples were prepared by mixing Micron graphite oxide suspen- sions with KCl solutions, allowing the particles to settle, trans- ferring the wet sediment onto the Cu sample holder and covering them by an X-ray transparent plastic foil.
3. Results
3.1. Size and shape features of the fractionated GO particles
The stock dispersions of GO used for the aggregation studies were prepared from a dry solid powder composed of coarse grains assembled from micron-sized graphite oxide platelet aggregates. To reduce the size of these aggregates, the powder was wet-ground with water in a ball mill. Upon addition of NaOH solution to the wet-ground stock, the particles were expected to undergo base- induced exfoliation. The as-obtained aqueous dispersion was found to be inadequate for further light scattering studies due to its very high polydispersity. Thus, three size fractions were isolated as detailed in the Experimental Section. Accordingly, (1) the “Nano GO”fraction was obtained by a combined application of centrifu- gation and filtration, (2) the“Colloid GO” fraction was collected upon a single centrifugation run and (3) the“Micron graphite ox- ide”fraction was isolated by differential centrifugation. We must note here that, despite the fact that they are both dispersed in a submicrosopic level, wefind the distinction between the‘Nano” fraction (diameter up to 100 nm) from the “Colloid” fraction (diameter up to 1mm) useful to highlight significant differences in the average size of the particles, according to the IUPAC terminol- ogy for colloidal particles [53].
Atomic force microscopy (AFM) images were recorded for the fractionated GO platelets deposited on functionalized mica sheets from their aqueous dispersions. Top panels ofFig. 1clearly indicate that the platelets are irregularly shaped and the degree of exfolia- tion is the highest for Nano GO and the lowest for Micron graphite
oxide. In the former case, single GO sheets of about 1 nm thickness were obtained, as indicated by the height profiles of Supporting Fig. S3. Only a few particles (scarcely observable white features in the image) were found to be multilayered, but their thickness never exceeded several nanometers. A high degree of delamination was also maintained for the Colloid GO fraction. Although their particles exhibited more pronounced angularity, their thickness was still 1 nm and brighter areas only indicated partial overlap of these single sheets deposited randomly on top of each other (Supporting Fig. S3). Finally, for the Micron graphite oxide fraction, the topo- graphic image indicated incomplete exfoliation by visualizing larger (100e150 nm thick), multilayered particles named as tac- toids, which are similar to the clusters of Ca-montmorillonite in water, in which the clay sheets are arranged parallel to each other [54]. Despite the fact that the shape of the AFM tip can change the topography of the deposited particles, it is somewhat surprising that particles in this sample are not completely exfoliated, while pristine GO samples are generally expected to disaggregate readily to single-layer level in water or in dilute aqueous solutions [55].
It would be plausible to assign this anomalous exfoliation behavior to the peculiar synthesis method. To our observation, Brodie samples are typically less readily dispersible than graphite oxides synthesized by the Hummers-Offeman method [47]. Park et al. have also found, besides well-dispersed laminates, an abun- dance of incompletely exfoliated Brodie-graphite oxide particles even at pH¼8.8 by confocal microscopy [56]. While for smaller flakes of Brodie-GO, enough driving force seems to arise to cause complete delamination, the tactoids of the larger particle fractions may be held together more strongly. Another likely hypothesis is that the presence of multilayer assemblies in the Micron graphite oxide suspension originates from differential fractionation. In this method, which was used only for this sample, the exfoliated par- ticles were subjected to centrifugation at high rates and subsequent
redispersion. Within the latter process the initial degree of delamination may not have been recovered because, under the compression of the centrifugal force, the particles got a more par- allel and compacted arrangement in the sediment cake.
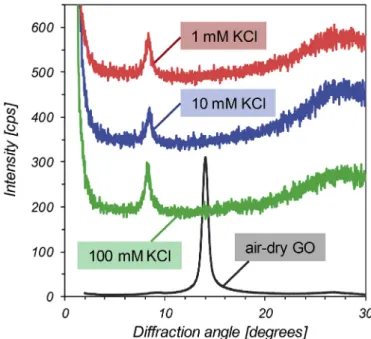
To gain more information on the distance between layers in tactoid aggregates, we have undertaken X-ray diffraction mea- surements on the wet sediments of Micron graphite oxide samples equilibrated with a series of saline solutions (1, 10 and 100 mM KCl).
Their diffractograms are compared to that of an air-dry GO sample inFig. 2. The tactoids clearly showed a great increase of the c-axis repeat distance (basal spacings are between 1.04 and 1.06 nm) in electrolyte solution as compared to dry GO powder (d001¼0.60 nm), but there is no electrolyte concentration depen- dence of the d-spacing. This indicates that, in the range of salt concentrations used for aggregation measurements, the swollen structure of the tactoid aggregates virtually remains unchanged.
The lateral extensions are spanning from several tens to several hundreds of nanometers in the different fractions. Since clear in- formation regarding the average size and polydispersity based on the analysis of a statistically significant number of platelets cannot be obtained by AFM, DLS measurements were performed to char- acterize the size distribution in the individual fractions.
The hydrodynamic diameters based on the intensity or number weighted distributions are shown in Fig. 1 (bottom). These di- mensions refer to the equivalent spherical diameter, which equals to the diameter of a sphere drawn around the GO platelet, exhib- iting the same diffusion behavior. For the Nano GO sample, the data show monomodal size distribution with relatively low poly- dispersity (0.18) and Z-average diameter,Dz¼150 nm. 80 nm and 160 nm average diameters were determined from the number and intensity weighting, respectively. The difference is due to the polydispersity of the sample and to the presence of small amount of aggregates or traces of larger sized contaminants (dust), the Fig. 1.AFM images (top) as well as number and intensity weighted size distribution histograms (bottom) of Nano GO (left), Colloid GO (middle) and Micron graphite oxide (right, with a separate image of another, folded platelet stack in the inset) fractions at pH¼5. (A colour version of thisfigure can be viewed online.)
contribution of which is overestimated owing to the dependence of the scattered intensity on the size of the scattering objects [57]. This difference was more pronounced for the Colloid GO samples due to the mixture of nanometer and colloid-sized GO platelets in the dispersion, as supported by the respective AFM image. The exper- imental results indicate two particle populations of mean di- ameters of 80 nm and 680 nm (Dz¼450 nm). The Micron graphite oxide particles were of monomodal size distribution of dimensions above 1mm (Dz¼1460 nm).
To probe the angular dependence of the hydrodynamic diam- eter, simultaneous static and dynamic light scattering (SSDLS) were carried out (Fig. 3a). While no significant angular dependence was found for the Micron graphite oxide particles, the Nano and Colloid GO fractions have higher apparent diameters at low scattering angles. This suggests that trace amount of aggregates may be
present in the latter samples and they contribute more, along with larger particles, to the forward scattering, i.e., to the scattered in- tensity at low angles [57]. These aggregates may also be present in the Micron graphite oxide dispersions, but their contribution is negligible due to the larger size of the GO platelets in this fraction.
Static light scattering (SLS) measurements presented inFig. 3b revealed that the dependence of the scattered intensity of the different fractions on the scattering vector (which is proportional to the scattering angle [51]) correlates well with the above dis- cussed results. Accordingly, the relative intensities at the same scattering vector increase in the Nano GO<Colloid GO<Micron graphite oxide order due to their increasing size. The double logarithmic plot of the scattering intensity (I(q)) versus the scat- tering vector (q) yields the fractal dimensions (Df) of the sus- pended GO particles byfittingI(q)to a power-law decay in the 8103e3102nm1scattering vector range. An excellentfit was obtained for the Colloid GO fraction (r2¼0.9996) yielding aDf
of 1.89±0.005. This fractal dimension indicates the presence of highly exfoliated single plate-like structures [58], which appear smooth in the size scale of several tens to ca. one hundred nanometers. The dispersed particles in the Micron-sized graphite oxide fraction exhibitDfof 2.35±0.02. This fractal dimension can be interpreted as a surface fractal that is informative of a crumpled conformation of the elementary sheets in this fraction [59].
However, as suggested by Titelman et al. [60] for graphite oxide particles in water, the larger slope of the scattering curve may also reflect a size distribution along the z-axis (perpendicular to the layer planes) instead of full delamination. This interpretation is most likely, because it agrees well with the previous AFM-based observation of platelet assemblies the thickness of which ap- pears to scale with their lateral size. Finally, an apparentDf(1.39) with a relatively poor quality offit (r2¼0.9899) was obtained for the Nano GO fraction. This value is hardly interpreted due to the small hydrodynamic size of the largest population of Nano GO particles (D¼80 nm) by number, because the power-law rela- tionship betweenI(q)andqholds well and should be checked only at length scales shorter than the size of the smallest particles,i.e.
in the range of qD>1 [59].
3.2. pH-controlled dispersion stability window of the GO platelets (in the absence of salt)
Electrokinetic measurements revealed that all GO fractions are negatively charged in a wide pH range (2e13) in aqueous disper- sions. In a previous publication, we have assigned this charge to dissociated phenolic and carboxylic surface groups and showed that the net layer charge successively increases with the pH at constant ionic strength [28]. To assess the influence of interfacial protolytic processes on the dispersion stability, the rate of aggre- gation was measured at different pH values in time-resolved DLS experiments (SupportingFig. S1). The most advanced concept for the characterization of kinetic stability in aqueous electrolyte so- lutions is to provide the dependence of the absolute aggregation rate [61] on a variable solution condition, e.g.the pH, the ionic strength or the concentration of a solute. However, owing to the high polydispersity and shape irregularities of the platelets, the exact number of particles in a unit volume of suspension is not known. Nevertheless, a straightforward choice is the use of relative aggregation rates expressed as the stability ratio (W). This is the ratio of the rate constant of diffusion-controlled aggregation to the actual rate coefficient and it can be calculated from the initial in- crease in the hydrodynamic diameter (Dh) in an aggregating sample as [62].
Fig. 2.X-ray diffractograms of wet sediments of Micron graphite oxide particles (offset by 150 cps, respectively) equilibrated with saline media of different ionic strength. The pattern of air-dry GO (intensities scaled down tofit to the magnitude of the other patterns) is also shown. (A colour version of thisfigure can be viewed online.)
Fig. 3.Angle dependent apparent hydrodynamic diameters (a) measured by SSDLS and double logarithm plots of the relative scattered light intensities as a function of the scattering vector (b) of the size fractionated GO dispersions at pH¼5. (A colour version of thisfigure can be viewed online.)
W¼ dDh=dt
fast
t/0
dDh=dt
t/0
(1)
where fast refers to the diffusion controlled aggregation. This condition was achieved at high salt concentrations (1MKCl in this study).
The pH-dependent aggregation processes were found to be fairly similar in a wide range of pH for all the fractions (Fig. 4). The stability ratios were close to unity at low pHs (below pH 1) indi- cating rapid aggregation at high concentrations (above 100 mM) of HCl but they increased exponentially in the millimolar range. A remarkably broad pH window (3e13) was the revealed in which the dispersions were highly stable and stability ratios approach infinity. Interestingly, while both the Colloid and Micron fractions reached the completely stabilized state at almost the same pH (2.85 and 2.95, respectively), the nanosized graphene oxide flakes exhibited enhanced stability, for which the transition from slow
aggregation to stable state occurred already at pH¼2.35. At the basic side of the stability window, the rate of aggregation started to increase again (onset of slow aggregation is ca. pH¼13 for all fractions) and became diffusion controlled around pH¼14. The aggregation behavior of Brodie GO particles at these extreme pH conditions agree very well at pH¼1 and reasonably well at pH¼14 with the semi quantitative DLS results of Shih et al. [63] found for Hummers GO.
These results are in line with the DLVO theory, which states that the overall interparticle forces are the sum of repulsive electrical double layer and attractive van der Waals forces [30,37,64]. The strength of the double layer repulsion decreases with lowering the pH due to the protonation of the surface functional groups of GO lamellae and to the subsequent loss of surface charge [28]. There- fore, van der Waals attractions predominate in highly acidic dis- persions leading to rapid aggregation of the GO platelets. These functional groups progressively deprotonate upon base addition giving rise to stronger double layer forces and hence, to more stable dispersions. The strength of the repulsive forces is especially strong in the intermediate pH regime, where particle aggregation was not detected. Similar observations were reported earlier with other GO samples [37,40,42,65].
The electrical double layer forces are also strong at high pHs, therefore, the decrease in the stability ratios cannot be explained by the degree of ionization of the functional groups, since they are completely deprotonated in the pH 13e14 regime. However, the ionic strength is between 0.1 and 1Min this range due to the high concentration of the Naþand OHions. Such a high level of the ionic species leads to the screening of the surface charge and to subsequent weakening of the double layer forces, as predicted by the DLVO theory [31]. While several studies have already reported on the chemical destabilization of GO in strong bases [66e68], its colloidal destabilization has not been yet confirmed by DLS at very high pHs. The onset of this base-induced aggregation agrees reasonably well with early X-ray diffraction studies on GO samples (prepared by Staudenmaier method) immersed into dilute base solutions, which found undetectable interlayer distances in 10 mM
NaOH solution (complete delamination at pH ¼ 12), while restacking of particles was found in 50 mMsolution (1.24 nm basal spacing at pH¼12.7) [6]. The practical relevance of this fact is that in alkaline media of submolar concentrations, the colloidal desta- bilization may proceed separately to or, at higher temperatures, simultaneously with base-catalyzed GO deoxygenation.
3.3. pH-dependent resistance against salt-induced aggregation
To estimate the surface charge density, the zeta potentials of Nano GO particles were measured at different ionic strengths in alkaline solutions (Fig. 5). Highly negative mobilities were deter- mined at low ionic strengths indicating the ionization of the surface carboxyl and phenolic groups of the platelets. Similar zeta poten- tials were reported for Hummers-GO samples under alkaline con- ditions [29,37,65]. The electrophoretic mobilities increased with the KCl concentration due to charge screening and concomitant shrinkage of the double layer.
The experimental data were compared with the calculated ionic strength dependence of zeta potential using the Gouy-Chapman model, which was developed on the basis of the Poisson- Boltzmann description of the charge distribution in the electrical double layer as follows [31].
z
¼2keBTasinhe
s
2kBTε0ε
k
(2) wherezis the zeta potential,kBis the Boltzmann constant,Tis the Fig. 4. Stability ratios of the Nano GO (a), Colloid GO (b) and Micron graphite oxide (c)
particles as a function of the pH in the absence of added salts. The insets schematically illustrate the size and aggregation states of the graphene oxide sheets in the disper- sions. (A colour version of thisfigure can be viewed online.)
absolute temperature,eis the elementary charge,sis the charge density at the slip plane,ε0is the permittivity of vacuum,εis the dielectric constant of water and k is the inverse of the Debye screening length, which can be calculated from the ionic strength (I) as follows [64].
k
1¼ffiffiffiffiffiffiffiffiffiffiffiffiffiffiffi εε0kBT 2NAe2I s
(3)
whereNAis Avogadro’s number. Thefitting of charge density at the electrokinetic slip plane yielded13 mC m2and the data showed good agreement with the measured values above 0.01MKCl con- centration. The large deviation between the calculated and exper- imental zeta potentials at low salt level is due to the electrokinetic effect described for charged particles of large Debye screening length (i.e., at low ionic strength) moving in an electricfield [69].
To assess the resistance of the Nano GO particles against salt- induced aggregation, stability ratios were determined by DLS at different ionic strengths in the pH range of 2.5e12 (Fig. 6).
In general, the platelets follow the same aggregation mecha- nism upon KCl addition irrespectively of the pH. Accordingly, stable dispersions were observed at low ionic strengths (as demonstrated for pH¼9 in SupportingFig. S1), while the aggregation became rapid at salt levels above the CCC, which separates the slow and fast aggregation regimes as predicted by the DLVO theory. Although the generic trend in the salt concentration dependence of the stability ratios is very similar, changing the pH reveals two interesting phenomena, which deserve further discussion.
First, virtually all samples exhibit anomalous behavior in the fast aggregation regimes. Normally, all stability ratio values are ex- pected to be equal to 1 above the CCCs reflecting identical rates for diffusion-limited aggregation. In contrast, a gradual decrease of the aggregation rates beyond the break points of the stability plots is found upon increasing the pH. We have no clear explanation why the apparent diffusion-controlled aggregation rates increase
consistently with the ionic strength and decrease with the pH. The hypothesis of changing particle conformation is most likely, because the dimensional features of GO particles were reported to be significantly affected by pH [29,65].
Second, strikingly different slopes are also found below the CCCs of the stability plot for the acidic and alkaline dispersions. The variation of two distinct properties may both contribute to this phenomenon: (i) hydration and (ii) surface roughness of particles.
Regarding hydration, hydrophobic forces arising from the poly- cyclic aromatic regions may become more pronounced between the platelets at low pHs due to their limited ionization [65]. These interactions are attractive, giving rise to destabilization of Nano GO and to smaller slopes in the slow aggregation regimes.
Another contribution to the decrease in the slope can be attributed to the surface roughness of GO particles. According to Snoswell et al. [70], a shift in the gradient of the stability plot is indicative of surface protrusions of a few nanometers, which effectively reduce the effective interaction radii between colliding particles. The presence of such asperities is not directly evidenced because SLS was incapable to provide fractal dimensions for the Nano GO particles. However, it is quite obvious that either pH- induced conformational changes [29] or oxidative debris (oxygen- ated amorphous carbon deposits) [66] is accountable for their presence.
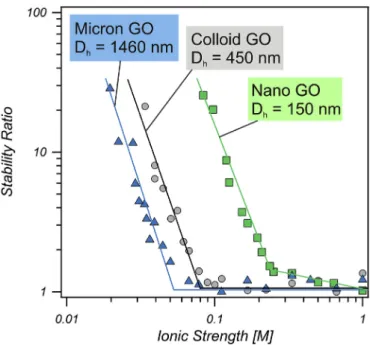
Finally, the size dependence of the colloidal stability of Nano, Colloid and Micron-sized particles were characterized at different ionic strengths while keeping the pH constant (Fig. 7). For all fractions, the stability ratios follow the regular salt concentration dependence as suggested by the DLVO theory that is, slow and fast aggregation regimes are separated by the CCC. In contrast to Nano GO, the larger platelets did not exhibit variable aggregation rates at high ionic strengths; the respective stability ratio values were close to unity indicating their diffusion controlled aggregation. However, the most significant deviation in the aggregation behavior of the different fractions is the size-dependent variation of the CCC, which is discussed in the next section.
Fig. 5.Zeta potential of nanosized GO platelets as a function of the ionic strength adjusted by KCl at pH 9. The solid line represents the expected dependence based on the Gouy-Chapman model of the electrical double layer. (A colour version of thisfigure can be viewed online.)
Fig. 6.Stability ratios of Nano GO particles versus the ionic strength measured at different pH values. (A colour version of thisfigure can be viewed online.)
4. Discussion
CCCs were determined from the stability ratio versus ionic strength data shown inFigs. 6 and 7. In addition to these vales,Fig. 8 represents the stability map of GO involving all of the CCCs re- ported earlier on the basis of DLS experiments for GO platelets of different sizes.
4.1. pH dependence
For the Nano GO, the CCC increases from 60 mMto more than 300 mMupon increasing the pH from 2.5 to 12. The reason of this
dramatic stability enhancement is quite obvious: the progressive deprotonation of the surface functional groups gives rise to higher surface potential and to stronger electrical double layer repulsion, which can be screened at higher ionic strengths. This effect is dominant over other possible ones that influence the interparticle potential energy such as the orientation of the interacting platelet- shaped particles. Additional attractive forces discussed in the pre- vious section are also absent in alkaline dispersions, therefore, the CCC is determined mainly by the overall DLVO-type interparticle forces.
The CCC values published by Wu et al. [41] for Hummers-GO also show strong pH dependence, and fall close to those found in this study especially in acidic dispersion media. However, while these authors found a linear relationship between the CCCs and the pH, our data are more consistent with the predictions by Gudarzi, indicating CCCs that rise less steeply under basic conditions [37].
Other GO samples were studied in the relatively narrow pH range of 5e7, and were found to be destabilized by monovalent salts in the 20e200 mM concentration regimes [39,40,42,43]. Although the achievable accuracy levels of the determination of critical coagu- lation concentrations are far beyond the precision expectede.g.in analytical chemistry, this is a surprisingly large variation of data, spanning a full magnitude of coagulant (salt) concentration. Size variations are hardly accountable for such large discrepancies be- tween the dispersion stabilities because in most cases, the initial particles diameters were around 300 nm. Clearly, other factors such as the degree of oxidation, or details of sample purification, must be taken into account for a reliable prediction of CCCs. In addition, the study of Wang et al. suggests ion specific effects since significant differences were reported in the CCC values determined for the same GO in NaCl and KCl solutions [43]. However, the collection of currently published CCC data does not indicate a clear-cut differ- ence between the destabilization efficiencies of these salts.
4.2. Size dependence
Comparison of the CCCs of the Brodie-GO platelets of different sizes reveals a striking difference between their colloidal stability, Fig. 7.Stability plots of GO of different average diameters in KCl solutions at pH¼5. (A
colour version of thisfigure can be viewed online.)
Fig. 8.Stability map of aqueous GO dispersions in the presence of simple monovalent salts. The CCC determined from the breakpoints of the stability plots inFig.. 6 and 7for Brodie- GO in KCl solutions are shown as a function of pH and they are compared to the literature values reported by Chowdhury et al. 1 [39], Wu et al. [41], Chowdhury et al. 2 [71], Yang et al. [42], Wang et al. [43], Tang et al. [46] and Jiang et al. [45] for Hummers-GO samples. Solid and dashed lines are guide to the eyes. (A colour version of thisfigure can be viewed online.)
which follows the Micron Graphite Oxide < Colloid Graphene Oxide≪Nano Graphene Oxide sequence and ranges from 50 mMto 230 mMin KCl solutions at pH¼5 (Fig. 8). This trend is just the opposite of the theoretical (molecular dynamics simulation based) prediction for the easier aggregation of small GO’s [46]. Although a conclusive evidence for the size-tunability of the aggregation behavior of GO is provided for the first time, several other size dependencies have already been reported in the literature. Per- reault et al. demonstrated an increase in the antimicrobial effi- ciency for nanosized GOflakes [72], Liaros et al. showed differences in the near-infrared optical power limiting between few-layer and single-layer GO’s [73], while Gonçalves et al. highlighted that the breakdown of GO into nanoscale particles results in the modifica- tion of the edge structure which changes the optoelectronic prop- erties [74]. Finally, asfirst described by Kim et al., GO can exhibit liquid crystalline (LC) behavior in aqueous media with typical nematic ordering, and the shape anisotropy of platelets influences the composition dependence of various phase transitions of their LC state [75,76].
Regarding the greater salt tolerance of nanographene oxide, we suggest that it is related to the combined effects of the weakening of interplatelet van der Waals attraction and strengthening of double layer repulsion. The strength of the attractive van der Waals forces is known to increase with the lateral dimension of sheet-like particles of any kind [77], but it was also demonstrated specifically for GO platelets by Gudarzi [37]. Likewise, the CCC shifts towards higher salt concentrations upon size decrease. In addition, the Nano GO possesses higher edge-to-area ratios [78]. Since the density of the ionized functional groups is expected to be higher at the edges [49,79], the electrical double layer repulsion should be stronger for the GO fraction of lower size and higher amount of salt is needed to destabilize the dispersions.
It is noteworthy that such charge-induced enhancement of dispersion stability for nanoscale GO has already been suggested by Luo et al. [78] However, the centrifugation tests presented in their study may simply reflect the fact that the nanosized particles are kept dispersed more efficiently than larger ones because of their more pronounced Brownian motion, and not necessarily because there are any differences between their overall interparticle forces that would lead to dissimilarity in their aggregation states.
5. Conclusions
In the present contribution, a systematic investigation of the effect of the acidity and ionic environment on the colloidal stability of GO platelets of different sizes was performed in aqueous dis- persions. Nano and Colloid GO, along with Micron-sized graphite oxide particles representing three different size ranges obtained by Brodie method form stable colloids in a wide pH window at low ionic strengths, while they are destabilized at low and high pHs and high salt levels due to the lack of sufficient surface charge and insufficient charge screening. In strongly alkaline environment (pH > 13), chemical and colloidal destabilization may proceed simultaneously. Light scattering measurements revealed that the aggregation behavior of GO platelets in KCl solutions is in accor- dance with the predictions of the DLVO theory. It is also demon- strated herein that the size dramatically influences the aggregation behavior, and a substantial stability enhancement can be achieved for graphene oxide particle populations with diameters around 100 nm. The use of such graphene oxide nanoflakes has definite biomedical implications, such as the ease of cell penetration [80], antimicrobial activity [72] or stabilization of other nanoparticles [81]. Another noteworthy conclusion of this study is that not only the widely employed Hummers-Offeman method, but the over- looked Brodie method is also capable to provide graphene oxides
with good dispersion stability in water. This information is of especial importance regarding the formulation of processable aqueous dispersions of GO lamellae of different types and sizes, where a posteriori knowledge about the transition between stable states and coagulated orflocculated systems is of basic significance for a proper end-product design (e.g.ultrathinfilms and 3D printed structures).
CRediT author statement
Tamas Szabo: Conceptualization, Investigation, Visualization, Writing - Original Draft, Funding acquisition.
Plinio Maroni: Methodology, Formal analysis.
Istvan Szilagyi: Methodology, Visualization, Writing - Original Draft, Funding acquisition.
Declaration of competing interest
The authors declare that they have no known competing financial interests or personal relationships that could have appeared to influence the work reported in this paper.
Acknowledgements
The financial support by the Ministry of Human Capacities, Hungary through grant 20391-3/2018/FEKUSTRAT is gratefully acknowledged. We are greatly indebted to Professor Michal Bor- kovec for his scientific guidance and for the opportunity to use the facilities in the Laboratory of Colloid and Surface Chemistry at the University of Geneva. T. S. acknowledges support from the Swiss Scientific Exchange Program (Sciex-NMS-CH, 12.029).
Projects no. 124851 and 126498 have been implemented with the support provided from the National Research, Development and Innovation Fund of Hungary,financed under the FK and KH funding schemes, respectively. The support from the Open Access Fund of the University of Szeged (No. 4529) is gratefully acknowledged.
Appendix A. Supplementary data
Supplementary data to this article can be found online at https://doi.org/10.1016/j.carbon.2020.01.022.
References
[1] V. Georgakilas, M. Otyepka, A.B. Bourlinos, V. Chandra, N. Kim, K.C. Kemp, P. Hobza, R. Zboril, K.S. Kim, Functionalization of graphene: covalent and non- covalent approaches, derivatives and applications, Chem. Rev. 112 (11) (2012) 6156e6214.
[2] A. Enotiadis, K. Angjeli, N. Baldino, I. Nicotera, D. Gournis, Graphene-based nafion nanocomposite membranes: enhanced proton transport and water retention by novel organo-functionalized graphene oxide nanosheets, Small 8 (21) (2012) 3338e3349.
[3] D.R. Dreyer, S. Park, C.W. Bielawski, R.S. Ruoff, The chemistry of graphene oxide, Chem. Soc. Rev. 39 (1) (2010) 228e240.
[4] E.W. Peng, E.S.G. Choo, P. Chandrasekharan, C.T. Yang, J. Ding, K.H. Chuang, J.M. Xue, Synthesis of manganese ferrite/graphene oxide nanocomposites for biomedical applications, Small 8 (23) (2012) 3620e3630.
[5] M. Yang, Y. Hou, N.A. Kotov, Graphene-based multilayers: critical evaluation of materials assembly techniques, Nano Today 7 (5) (2012) 430e447.
[6] A. Clauss, R. Plass, H.P. Boehm, U. Hofmann, Untersuchungen zur struktur des graphitoxyds, Z. Anorg. Allg. Chem. 291 (5e6) (1957) 205e220.
[7] J.I. Paredes, S. Villar-Rodil, A. Martinez-Alonso, J.M.D. Tascon, Graphene oxide dispersions in organic solvents, Langmuir 24 (19) (2008) 10560e10564.
[8] P. Feicht, D.A. Kunz, A. Lerf, J. Breu, Facile and scalable one-step production of organically modified graphene oxide by a two-phase extraction, Carbon 80 (2014) 229e234.
[9] A.V. Talyzin, A. Klechikov, M. Korobov, A.T. Rebrikova, N.V. Avramenko, M.F. Gholami, N. Severin, J.P. Rabe, Delamination of graphite oxide in a liquid upon cooling, Nanoscale 7 (29) (2015) 12625e12630.
[10] R. Narayan, J.E. Kim, J.Y. Kim, K.E. Lee, S.O. Kim, Graphene oxide liquid crystals:
discovery, evolution and applications, Adv. Mater. 28 (16) (2016) 3045e3068.
[11] S.C. Lin, C.J. Shih, V. Sresht, A.G. Rajan, M.S. Strano, D. Blankschtein, Under- standing the colloidal dispersion stability of 1D and 2D materials: perspec- tives from molecular simulations and theoretical modeling, Adv. Colloid Interface Sci. 244 (2017) 36e53.
[12] J. Texter, Graphene dispersions, Curr. Opin. Colloid Interface Sci. 19 (2) (2014) 163e174.
[13] C. Nethravathi, B. Viswanath, C. Shivakumara, N. Mahadevaiah, M. Rajamathi, The production of smectite clay/graphene composites through delamination and co-stacking, Carbon 46 (13) (2008) 1773e1781.
[14] Y. Matsuo, K. Tahara, Y. Sugie, Synthesis of poly(ethylene oxide)-intercalated graphite oxide, Carbon 34 (5) (1996) 672e674.
[15] T. Tsoufis, G. Tuci, S. Caporali, D. Gournis, G. Giambastiani, p-Xylylenediamine intercalation of graphene oxide for the production of stitched nanostructures with a tailored interlayer spacing, Carbon 59 (2013) 100e108.
[16] M. Seredych, T.J. Bandosz, Carbon phase-graphite oxide composites based on solid state interactions between the components: importance of surface chemistry and microstructure, Carbon 95 (2015) 580e588.
[17] Y. Matsuo, T. Fukutsuka, Y. Sugie, Preparation andfluorescent properties of rhodamine B-hexadecylamine-intercalated graphite oxide thinfilm, Chem.
Lett. 32 (11) (2003) 1004e1005.
[18] S. Bashkova, T.J. Bandosz, Insight into the role of the oxidized graphite pre- cursor on the properties of copper-based MOF/graphite oxide composites, Microporous Mesoporous Mater. 179 (2013) 205e211.
[19] J. Maruyama, S. Akita, Y. Matsuo, Y. Muramatsu, Silica-pillared graphene sheets with iron-nitrogen units as an oxygen reduction catalyst, Carbon 66 (2014) 327e333.
[20] M.M. Gudarzi, F. Sharif, Self assembly of graphene oxide at the liquid-liquid interface: a new route to the fabrication of graphene based composites, Soft Matter 7 (7) (2011) 3432e3440.
[21] S. Ansari, A. Kelarakis, L. Estevez, E.P. Giannelis, Oriented arrays of graphene in a polymer matrix by in situ reduction of graphite oxide nanosheets, Small 6 (2) (2010) 205e209.
[22] T. Szabo, A. Veres, E. Cho, J. Khim, N. Varga, I. Dekany, Photocatalyst separation from aqueous dispersion using graphene oxide/TiO2nanocomposites, Colloids Surf., A 433 (2013) 230e239.
[23] J.H. Fendler, Colloid chemical approach to the construction of high energy density rechargeable lithium-ion batteries, J. Dispersion Sci. Technol. 20 (1e2) (1999) 13e25.
[24] C.S. Xiang, P.J. Cox, A. Kukovecz, B. Genorio, D.P. Hashim, Z. Yan, Z.W. Peng, C.C. Hwang, G.D. Ruan, E.L.G. Samuel, P.M. Sudeep, Z. Konya, R. Vajtai, P.M. Ajayan, J.M. Tour, Functionalized low defect graphene nanoribbons and polyurethane compositefilm for improved gas barrier and mechanical per- formances, ACS Nano 7 (11) (2013) 10380e10386.
[25] T. Szabo, V. Hornok, R.A. Schoonheydt, I. Dekany, Hybrid Langmuir-Blodgett monolayers of graphite oxide nanosheets, Carbon 48 (5) (2010) 1676e1680.
[26] T. Szabo, Z. Peter, E. Illes, L. Janovak, A. Talyzin, Stability and dye inclusion of graphene oxide/polyelectrolyte layer-by-layer self-assembledfilms in saline, acidic and basic aqueous solutions, Carbon 111 (2017) 350e357.
[27] N.A. Kotov, I. Dekany, J.H. Fendler, Ultrathin graphite oxide-polyelectrolyte composites prepared by self-assembly: transition between conductive and non-conductive states, Adv. Mater. 8 (8) (1996) 637e&.
[28] T. Szabo, E. Tombacz, E. Illes, I. Dekany, Enhanced acidity and pH-dependent surface charge characterization of successively oxidized graphite oxides, Carbon 44 (3) (2006) 537e545.
[29] R.L.D. Whitby, A. Korobeinyk, V.M. Gun’ko, R. Busquets, A.B. Cundy, K. Laszlo, J. Skubiszewska-Zieba, R. Leboda, E. Tombacz, I.Y. Toth, K. Kovacs, S.V. Mikhalovsky, pH-driven physicochemical conformational changes of single-layer graphene oxide, Chem. Commun. 47 (34) (2011) 9645e9647.
[30] B. Derjaguin, On the repulsive forces between charged colloid particles and on the theory of slow coagulation and stability of lyophobe sols, Trans. Faraday Soc. 35 (3) (1940) 203e214.
[31] W.B. Russel, D.A. Saville, W.R. Schowalter, Colloidal Dispersions, Cambridge University Press, Cambridge, 1989.
[32] D. Li, M.B. Muller, S. Gilje, R.B. Kaner, G.G. Wallace, Processable aqueous dis- persions of graphene nanosheets, Nat. Nanotechnol. 3 (2) (2008) 101e105.
[33] B.J. Hong, O.C. Compton, Z. An, I. Eryazici, S.T. Nguyen, Successful stabilization of graphene oxide in electrolyte solutions: enhancement of bio- functionalization and cellular uptake, ACS Nano 6 (1) (2012) 63e73.
[34] H. Wang, Y.H. Hu, Electrolyte-induced precipitation of graphene oxide in its aqueous solution, J. Colloid Interface Sci. 391 (2013) 21e27.
[35] K.Y. Yoon, S.J. An, Y.S. Chen, J.H. Lee, S.L. Bryant, R.S. Ruoff, C. Huh, K.P. Johnston, Graphene oxide nanoplatelet dispersions in concentrated NaCl and stabilization of oil/water emulsions, J. Colloid Interface Sci. 403 (2013) 1e6.
[36] G.H. Ding, N.N. Zhang, C.C. Wang, X.Y. Li, J. Zhang, W.R. Li, R.J. Li, Z.N. Yang, Effect of the size on the aggregation and sedimentation of graphene oxide in seawaters with different salinities, J. Nanoparticle Res. 20 (11) (2018) 313.
[37] M.M. Gudarzi, Colloidal stability of graphene oxide: aggregation in two di- mensions, Langmuir 32 (20) (2016) 5058e5068.
[38] S. Koo, Estimation of hindered settling velocity of suspensions, J. Ind. Eng.
Chem. 15 (1) (2009) 45e49.
[39] I. Chowdhury, M.C. Duch, N.D. Mansukhani, M.C. Hersam, D. Bouchard, Colloidal properties and stability of graphene oxide nanomaterials in the aquatic environment, Environ. Sci. Technol. 47 (12) (2013) 6288e6296.
[40] I. Chowdhury, N.D. Mansukhani, L.M. Guiney, M.C. Hersam, D. Bouchard, Ag- gregation and stability of reduced graphene oxide: complex roles of divalent cations, pH, and natural organic matter, Environ. Sci. Technol. 49 (18) (2015) 10886e10893.
[41] L. Wu, L. Liu, B. Gao, R. Munoz-Carpena, M. Zhang, H. Chen, Z.H. Zhou, H. Wang, Aggregation kinetics of graphene oxides in aqueous solutions: ex- periments, mechanisms and modeling, Langmuir 29 (49) (2013) 15174e15181.
[42] K.J. Yang, B.L. Chen, X.Y. Zhu, B.S. Xing, Aggregation, adsorption, and morphological transformation of graphene oxide in aqueous solutions con- taining different metal cations, Environ. Sci. Technol. 50 (20) (2016) 11066e11075.
[43] M. Wang, B. Gao, D.S. Tang, H.M. Sun, X.Q. Yin, C.R. Yu, Effects of temperature on aggregation kinetics of graphene oxide in aqueous solutions, Colloids Surf., A 538 (2018) 63e72.
[44] X.L. Wang, H. Bai, G.Q. Shi, Size fractionation of graphene oxide sheets by pH- assisted selective sedimentation, J. Am. Chem. Soc. 133 (16) (2011) 6338e6342.
[45] Y. Jiang, R. Raliya, J.D. Fortner, P. Biswas, Graphene oxides in water: corre- lating morphology and surface chemistry with aggregation behavior, Environ.
Sci. Technol. 50 (13) (2016) 6964e6973.
[46] H. Tang, Y. Zhao, X.N. Yang, D.M. Liu, P.H. Shao, Z.G. Zhu, S.J. Shan, F.Y. Cui, B.S. Xing, New insight into the aggregation of graphene oxide using molecular dynamics simulations and extended Derjaguin-Landau-Verwey-Overbeek theory, Environ. Sci. Technol. 51 (17) (2017) 9674e9682.
[47] S.J. You, S.M. Luzan, T. Szabo, A.V. Talyzin, Effect of synthesis method on solvation and exfoliation of graphite oxide, Carbon 52 (2013) 171e180.
[48] C. Botas, P. Alvarez, P. Blanco, M. Granda, C. Blanco, R. Santamaria, L.J. Romasanta, R. Verdejo, M.A. Lopez-Manchado, R. Menendez, Graphene materials with different structures prepared from the same graphite by the Hummers and Brodie methods, Carbon 65 (2013) 156e164.
[49] T. Szabo, O. Berkesi, P. Forgo, K. Josepovits, Y. Sanakis, D. Petridis, I. Dekany, Evolution of surface functional groups in a series of progressively oxidized graphite oxides, Chem. Mater. 18 (11) (2006) 2740e2749.
[50] E. Horvath, L. Grebikova, P. Maroni, T. Szabo, A. Magrez, L. Forro, I. Szilagyi, Dispersion characteristics and aggregation in titanate nanowire colloids, ChemPlusChem 79 (4) (2014) 592e600.
[51] P.A. Hassan, S. Rana, G. Verma, Making sense of Brownian motion: colloid characterization by dynamic light scattering, Langmuir 31 (1) (2015) 3e12.
[52] A.V. Delgado, F. Gonzalez-Caballero, R.J. Hunter, L.K. Koopal, J. Lyklema, Measurement and interpretation of electrokinetic phenomena, J. Colloid Interface Sci. 309 (2) (2007) 194e224.
[53] J. Aleman, A.V. Chadwick, J. He, M. Hess, K. Horie, R.G. Jones, P. Kratochvil, I. Meisel, I. Mita, G. Moad, S. Penczek, R.F.T. Stepto, Definitions of terms relating to the structure and processing of sols, gels, networks, and inorganic- organic hybrid materials (IUPAC Recommendations 2007), Pure Appl. Chem.
79 (10) (2007) 1801e1827.
[54] M. Segad, B. Jonsson, B. Cabane, Tactoid formation in montmorillonite, J. Phys.
Chem. C 116 (48) (2012) 25425e25433.
[55] A.M. Dimiev, A.M. Dimiev, in: S. Eigler (Ed.), Graphene Oxide: Fundamentals and Applications, John Wiley, Chichester, 2017, pp. 36e84.
[56] M. Park, H.S. Lee, Rotational motions of repulsive graphene oxide domains in aqueous dispersion during slow shearflow, J. Rheol. 64 (1) (2020) 29e41.
[57] M.I. Mishchenko, L.D. Travis, A.A. Lacis, Scattering, Absorption, and Emission of Light by Small Particles, University Press, Cambridge, 2002.
[58] W.J. Ganley, J.S. van Duijneveldt, Controlling clusters of colloidal platelets:
effects of edge and face surface chemistries on the behavior of montmoril- lonite suspensions, Langmuir 31 (15) (2015) 4377e4385.
[59] X. Wen, C.W. Garland, T. Hwa, M. Kardar, E. Kokufuta, Y. Li, M. Orkisz, T. Tanaka, Crumpled and collapsed conformations in graphite oxide mem- branes, Nature 355 (6359) (1992) 426e428.
[60] G.I. Titelman, V. Gelman, S. Bron, R.L. Khalfin, Y. Cohen, H. Bianco-Peled, Characteristics and microstructure of aqueous colloidal dispersions of graphite oxide, Carbon 43 (3) (2005) 641e649.
[61] H. Holthoff, S.U. Egelhaaf, M. Borkovec, P. Schurtenberger, H. Sticher, Coagu- lation rate measurements of colloidal particles by simultaneous static and dynamic light scattering, Langmuir 12 (23) (1996) 5541e5549.
[62] G. Trefalt, I. Szilagyi, T. Oncsik, A. Sadeghpour, M. Borkovec, Probing colloidal particle aggregation by light scattering, Chimia 67 (11) (2013) 772e776.
[63] C.J. Shih, S.C. Lin, R. Sharma, M.S. Strano, D. Blankschtein, Understanding the pH-dependent behavior of graphene oxide aqueous solutions: a comparative experimental and molecular dynamics simulation study, Langmuir 28 (1) (2012) 235e241.
[64] G. Trefalt, I. Szilagyi, M. Borkovec, Poisson-Boltzmann description of interac- tion forces and aggregation rates involving charged colloidal particles in asymmetric electrolytes, J. Colloid Interface Sci. 406 (2013) 111e120.
[65] R.L.D. Whitby, V.M. Gun’ko, A. Korobeinyk, R. Busquets, A.B. Cundy, K. Laszlo, J. Skubiszewska-Zieba, R. Leboda, E. Tombacz, I.Y. Toth, K. Kovacs, S.V. Mikhalovsky, Driving forces of conformational changes in single-Layer graphene oxide, ACS Nano 6 (5) (2012) 3967e3973.
[66] A.M. Dimiev, L.B. Alemany, J.M. Tour, Graphene oxide. Origin of acidity, its instability in water, and a new dynamic structural model, ACS Nano 7 (1) (2013) 576e588.
[67] X.B. Fan, W.C. Peng, Y. Li, X.Y. Li, S.L. Wang, G.L. Zhang, F.B. Zhang, Deoxy- genation of exfoliated graphite oxide under alkaline conditions: a green route
to graphene preparation, Adv. Mater. 20 (23) (2008) 4490e4493.
[68] A. Lerf, A.M. Dimiev, in: S. Eigler (Ed.), Graphene Oxide: Fundamentals and Applications, John Wiley&Sons, Chichester, 2017, pp. 3e35.
[69] M. Borkovec, S.H. Behrens, M. Semmler, Observation of the mobility maximum predicted by the standard electrokinetic model for highly charged amidine latex particles, Langmuir 16 (11) (2000) 5209e5212.
[70] D.R.E. Snoswell, J.M. Duan, D. Fornasiero, J. Ralston, Colloid stability of syn- thetic titania and the influence of surface roughness, J. Colloid Interface Sci.
286 (2) (2005) 526e535.
[71] I. Chowdhury, W.C. Hou, D. Goodwin, M. Henderson, R.G. Zepp, D. Bouchard, Sunlight affects aggregation and deposition of graphene oxide in the aquatic environment, Water Res. 78 (2015) 37e46.
[72] F. Perreault, A.F. de Faria, S. Nejati, M. Elimelech, Antimicrobial properties of graphene oxide nanosheets: why size matters, ACS Nano 9 (7) (2015) 7226e7236.
[73] N. Liaros, E. Koudoumas, S. Couris, Broadband near infrared optical power limiting of few layered graphene oxides, Appl. Phys. Lett. 104 (19) (2014) 191112.
[74] G. Goncalves, M. Vila, I. Bdikin, A. de Andres, N. Emami, R.A.S. Ferreira, L.D. Carlos, J. Gracio, P. Marques, Breakdown into nanoscale of graphene ox- ide: confined hot spot atomic reduction and fragmentation, Sci. Rep. 4 (2014) 6735.
[75] J.E. Kim, T.H. Han, S.H. Lee, J.Y. Kim, C.W. Ahn, J.M. Yun, S.O. Kim, Graphene
oxide liquid crystals, Angew. Chem. Int. Ed. 50 (13) (2011) 3043e3047.
[76] S.P. Sasikala, J. Lim, I.H. Kim, H.J. Jung, T. Yun, T.H. Han, S.O. Kim, Graphene oxide liquid crystals: a frontier 2D soft material for graphene-based functional materials, Chem. Soc. Rev. 47 (16) (2018) 6013e6045.
[77] R.J. Hunter, Van der Waals attraction between colloidal particles - retadation correction forflat plates of arbitary thickness, Aust. J. Chem. 16 (5) (1963) 774e778.
[78] J.Y. Luo, L.J. Cote, V.C. Tung, A.T.L. Tan, P.E. Goins, J.S. Wu, J.X. Huang, Graphene oxide nanocolloids, J. Am. Chem. Soc. 132 (50) (2010) 17667e17669.
[79] A. Lerf, H.Y. He, M. Forster, J. Klinowski, Structure of graphite oxide revisited, J. Phys. Chem. B 102 (23) (1998) 4477e4482.
[80] J. Seemork, T. Sansureerungsikul, K. Sathomsantikun, T. Sinthusake, K. Shigyou, T. Tree-Udom, B. Jiangchareon, K. Chiablaem, K. Lirdprapamongkol, J. Svasti, T. Hamada, T. Palaga, S. Wanichwecharungruang, Penetration of oxidized carbon nanospheres through lipid bilayer membrane: comparison to graphene oxide and oxidized carbon nanotubes, and effects of pH and membrane composition, ACS Appl.
Mater. Interfaces 8 (36) (2016) 23549e23557.
[81] G. Orfanakis, M. Patila, A.V. Catzikonstantinou, K.M. Lyra, A. Kouloumpis, K. Spyrou, P. Katapodis, A. Paipetis, P. Rudolf, D. Gournis, H. Stamatis, Hybrid nanomaterials of magnetic iron nanoparticles and graphene oxide as matrices for the immobilization of beta-glucosidase: synthesis, characterization, and biocatalytic properties, Front. Mater. 5 (2018) 25.