Aim To evaluate the effects of maturation and sex on glu- cose metabolism during glucose tolerance (GTT) and in- sulin tolerance tests (ITT) in young and adult male and female rats by using two different approaches – the con- ventional, which uses area under the curve and glucose curve, and mathematical modeling that identifies param- eters necessary for determining the function that models glucose metabolism.
Methods Male and female rats at 3.5 and 12 months of age underwent standard GTT and ITT after overnight fast- ing. The parameters were identified by using Mathemat- ica-module NonlinearModelFit [ ] for experimentally ob- tained data.
Results When data were statistically analyzed, both sexes and age groups had similar glucose and insulin tolerance.
In the mathematical model of GTT, parameters describing the rate of glucose concentration increase G’(0) and de- crease G’I multiplied with maturation, with a concomitant decrease in the time point (tmax, tI) of reaching maximum and minimum glucose concentration (Gmax, G0). The math- ematical model of ITT for males was independent of age, unlike of that for females, which had increased G’(0) and G’I, and more quickly recovered from hypoglycemia after maturation.
Conclusion The mathematical model revealed female susceptibility to large glucose excursions, which are better
reflected by ITT in young animals and by GTT in adults. Received: February 11, 2020 Accepted: March 13, 2020 Correspondence to:
Marija Heffer
J. J. Strossmayer University of Osijek Faculty of Medicine Osijek Department of Medical Biology and Genetics
Josipa Huttlera 4 HR-31000 Osijek, Croatia mheffer@mefos.hr
Marta Balog1, Vedrana Ivić1, Rudolf Scitovski2, Irena Labak3, Kálmán Ferenc Szűcs4, Robert Gaspar4, Sándor G. Vári5, Marija Heffer1
1Department of Medical Biology and Genetics, Faculty of Medicine Osijek, J. J. Strossmayer University of Osijek, Osijek, Croatia
2Department of Mathematics, J. J.
Strossmayer University of Osijek, Osijek, Croatia
3Department of Biology, J. J.
Strossmayer University of Osijek, Osijek, Croatia
4Department of Pharmacology and Pharmacotherapy, Faculty of Medicine, University of Szeged, Szeged, Hungary
5Cedars-Sinai Medical Center, International Research and Innovation in Medicine Program, Los Angeles, CA, United States The first two authors contributed equally.
A mathematical model reveals
sex-specific changes in glucose
and insulin tolerance during rat
puberty and maturation
Glucose tolerance test (GTT) and insulin tolerance test (ITT) are common experimental and clinical biochemical tests based on (plasma/serum/whole blood) glucose monitor- ing during two up to four hours from the base point (1,2).
GTT assesses the body’s ability to maintain normoglycemia after glucose load. The obtained glucose profile is the result of the action of multiple hormones that have similar (insu- lin/leptin), opposite (insulin/glucagon), or mutually modu- lating (insulin/incretins) effects (3,4). ITT assesses the stress response to insulin bolus. A steep drop in insulin-induced hypoglycemia excites the hypothalamic-pituitary-adrenal axis, finally leading to the secretion of two hormones – adrenaline and cortisol (corticosterone in rodents) – which oppose insulin action and re-establish normoglycemia (5,6). Glucose homeostasis depends on insulin release from β-cells of Langerhans islets of the pancreas and the sen- sitivity of the target tissues to insulin (ie, glucose storage and expenditure by the target tissues). The relationship be- tween these two factors determines the total physiologi- cal tolerance of an individual to glucose and the individual’s ability to maintain glucose homeostasis. GTT reflects glu- cose sensitivity and can be performed by various methods – quantifying the insulin release from β-cells as a response to plasma glucose concentration, determining the target tissues’ sensitivity to insulin, and determining glucose tol- erance, which is informative of both – insulin release from β-cells and target tissues sensitivity to insulin (1,7,8). On the other hand, ITT reflects insulin sensitivity, primarily in the liv- er and skeletal muscles (3,9). In clinical setting, fasting blood glucose (FPG) and 2-h plasma glucose (2-h PG) during 75 g oral glucose tolerance test (OGTT) are used to diagnose prediabetes (FPG 5.6-6.9 mmol/L, 2-h PG 7.8-11.0 mmol/L) and diabetes (FPG≥7 mmol/L, 2-h PG≥11.1 mmol/L) (10).
However, FPG and final point of OGTT often miss patients with impaired glucose tolerance (IGT) and impaired fast- ing glucose (IFG), two intermediate states leading toward adult-onset diabetes or type 2 diabetes mellitus (T2DM).
Since there are more than eight identified molecular mech- anisms contributing to postprandial hyperglycemia and more than 143 common genetic variants associated with T2DM, IGT and IFG only crudely represent the heteroge- neous glycemic response and its impairment (11,12). More prediabetic subphenotypes are expected to be classified by a closer analysis of glucose peaks (connected with car- diovascular risk) and overall glycemic variability. ITT is less frequently performed for clinical purposes because there is a risk of adverse effects (sweating, palpitations, epilepsy, cardiac ischemic event, etc) and the outcome cannot be interpreted unless hypoglycemia below 2.2 mmol/L is achieved (13). Nevertheless, the test is considered the
gold standard for diagnosing hypopituitarism and Cushing’s syndrome (14). ITT is more often performed on experimen- tal animals to test their ability to maintain metabolic bal- ance under stressful conditions (15,16). Together, GTT and ITT reflect a number of molecular mechanisms responsible for normoglycemia – the prerequisite for the function of all organs, especially the brain.
While maturation is the sharpening of biological response, aging is a decay characteristic for biological entities, de- scribed as gradual degeneration rather than sudden col- lapse (17). Progressive degeneration of molecular mecha- nisms maintaining normoglycemia is reflected in glucose profile and easily accessible by GTT and ITT (18). The identi- fication of the currently missing mathematical parameters describing the dynamics of glycemic profile in both tests can indicate subtle changes, point out impaired molecular mechanisms, and lead toward personalized therapy.
The hypothesis of this study is that the interpretation of GTT and ITT test by classical calculation and statistics at the level of area under the curve (AUC) cannot detect metabolic differences between young and adult or male and female rats, whereas newly identified parameters de- scribing the mathematical equation that had been fitted to experimental data pinpoint and quantify the differ- ences between studied groups. The first aim of this study was to analyze the acquired data from GTT and ITT us- ing mathematical modeling in order to reveal the details of glucose dynamics. The second aim of the study was to evaluate the influence of maturation and sex on glucose metabolism.
MATERIAL AND METHODS
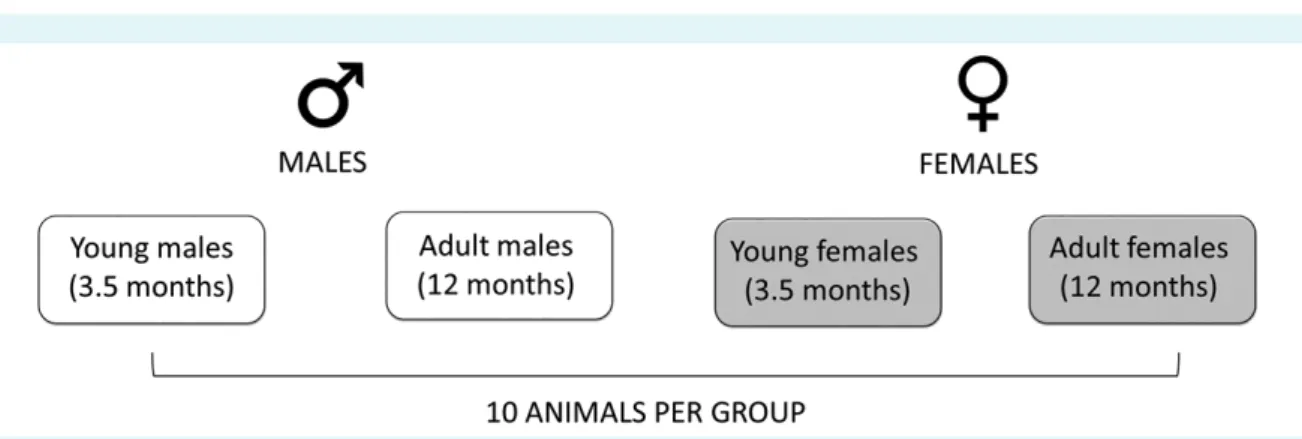
The study, conducted from May to December 2016, used Sprague Dawley-CR rats (Charles River, Sulzfeld, Germa- ny). In total, 40 animals were used: 10 young males and females, 3.5 months old, and 10 adult males and females, 12 months old (Figure 1). The experiment on young animals was performed at the Faculty of Medicine, J. J.
Strossmayer University of Osijek, Croatia and the experi- ment on adult animals was performed at the University of Szeged, Hungary. Both parts of the study were execut- ed with the same equipment and chemicals. The study was approved by the Croatian Ministry of Agriculture (2158-61-07-14-118) and National Scientific Ethics Com- mittee on Animal Experimentation of Hungary (IV/3796- 7/2015). The rats were kept in self-ventilating cages with housing temperature between 21°C and 24°C, five air
changes per minute, and constant humidity of 40%-60%
(THF3364, Ehret, Freiburg, Germany). There were maxi- mum three young animals per cage and at least two adult rats per cage. Standardized food for experimental rats (4RF21, Mucedola, Milan, Italy) and tap water were available ad libitum except 12-14 hours before GTT and 3 hours before insulin ITT. Day cycle was set to 7.00 am- 7.00 pm
Glucose and insulin tolerance tests
Peritoneal GTT was performed in all animals after 12-14 hours of fasting by injecting 2 g of glucose/kg of body mass in the peritoneum. Glucose (Merck, Branchburg, NJ, USA) was dissolved in distilled water as a 25% working solution. Animals were heated with infrared lamp (R95E, Philips, Amsterdam, the Netherlands) for easier blood sam- pling from the lateral tail vein. Glucose was measured at 8 time points for GTT and ITT.
GTT was carried out as follows:
1. Rats fasted for 12-14 hours.
2. Basal glucose concentration was measured by tail punc- ture.
3. Glucose was injected intraperitoneally.
4. Fifteen minutes after glucose injection the second mea- surement of glucose concentration was performed.
5. The measurement of glucose concentration was contin- ued after 30, 45, 60, 90, 120, and 240 minutes from glucose application.
6. At the end of the test, the animals were given food.
Peritoneal ITT was performed after 3 hours of fasting by in- jecting 0.75 U/kg of insulin Humalog (Lilly, Indianapolis, IN, USA) in the peritoneum. Animals were heated with infra- red light for easier blood sampling from the tail vein. Glu- cose was measured at 8 time points: 0, 15, 30, 45, 60, 90, 120, and 180 minutes.
ITT was carried out as follows:
1. Rats fasted for 3 hours.
2. Basal glucose concentration was measured by tail puncture.
3. Insulin was injected intraperitoneally.
4. Fifteen minutes after glucose injection the second mea- surement of glucose concentration was performed.
5. The measurement of glucose concentration was contin- ued after 30, 45, 60, 90, 120, and 180 minutes from insulin application.
6. At the end of the test, the animals were given food.
In both tests, the glucose concentration from a drop of blood (approximately 50 μL of blood per animal) was mea- sured by the OneTouch Ultra Mini glucometer (Life Scan, Milpitas, CA, USA) as follows:
1. The animal was put in an appropriate plastic cylin- der holder, and the tail was heated with an infrared lamp.
FIGuRE 1. Study design – classification of the animal groups.
2. The tail was wiped with ethanol.
3. An appropriate needle was injected under the skin and into the lateral tail vein to obtain a drop of blood for measurement;
aspiration was not performed due to possible vein collapse.
4. A drop of blood was applied to the glucose strip, insert- ed into the glucometer, and glucose concentration was read as mmol/L.
Statistical analysis
AUCs were calculated and compared by using Statistica 12 software (Tibco, Palo Alto, CA, SAD). Normality of distribu- tion was tested by Shapiro-Wilk test. Mann-Whitney test with Bonferroni correction was applied to determine the significance of differences between AUCs of different ani- mal groups. The level of significance was set to <0.05.
Development of mathematical model for glucose and insulin tolerance tests
The mathematical model was developed based on the following logic: let us consider the concentration of glu- cose G in blood and the net normal hormonal concentra- tion H as a cumulative effect of all relevant hormones (for example, insulin and leptin decrease G, while cortisol and growth hormone increase G). A basic model can be written according to (19,20):
The function J is the external rate at which the blood glu- cose concentration is increased due to adsorption rate.
We assume that the quantities G and H attain optimal val- ues G0 and H0 at the point when the patient arrives to hospital on an empty stomach. By using the substitution g = G − G0 and h = H − H0 and Taylor’s theorem, we obtain a system of linear differential equations for the functions g and h:
where m1, m2, m3, m4 are positive constants. It can be shown that the functions g and h satisfy linear differential equa- tion of the second order with constant coefficients:
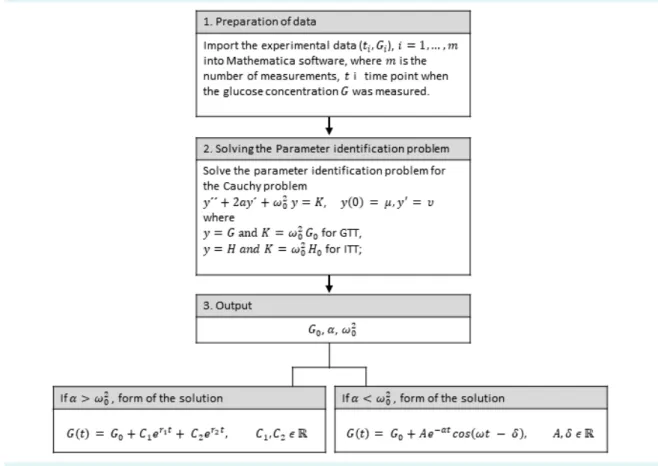
where for the function g and for the func- tion h. If experimental data (ti, yi), i = 1, …, m are known, where ti is the time point of measuring glucose Gi con- centration, we can estimate the parameters in the above stated model by solving the corresponding parameter identification problem (21-24). For solving this problem we used Mathematica-module NonlinearModelFit [ ] (25).
In this way we obtained a good approximation of param- eters α, and G0 in the differential equation and optimal initial condition μ = y (0) and ν = y´ (0) in the corresponding Cauchy´s problem. In the case of glucose concentration, by knowing the parameters α, and G0 in the differential equation and optimal initial condition G(0) and G´(0), we can write the required function G as the solution to the corresponding Cauchy´s problem, whereby the crucial role belongs to the corresponding characteristic equation:
If , then the roots r1, r2 of the characteristic equa- tion are negative and mutually different real num- bers, and the solution of the Cauchy´s problem for the differential equation is obtained in the form . If , the roots r1, r2 of the characteristic equation are conjugate complex numbers:
and the solution of the Cauchy´s problem for the differen- tial equation is obtained in the form:
or in the form:
The workflow of determining the function G is depicted in Figure 2. The characteristics of this function are initial glucose concentration G(0), initial rate of glucose absorp- tion G´(0), maximum glucose concentration Gmax, which is achieved at the moment tmax, maximum speed of glucose concentration decrease G´I (a negative number because it represents the decrease of concentration), the moment tI (inflexion) in which the maximum speed of glucose con- centration decrease is obtained, stabilized glucose con- centration AUC, and estimated variance (Es-
tVar). The same applies both to changes in blood glucose concentration under the influence of glucose load (GTT) or insulin bolus (ITT).
To evaluate the overall difference between real data and the values predicted by the mathematical model we cal- culated residual sum of squares and R2 (determination co- efficient).
RESuLTS
Classical analysis: young and adult rats of both sexes are similarly exposed to hyperglycemia during GTT or hypoglycemia during ITT test
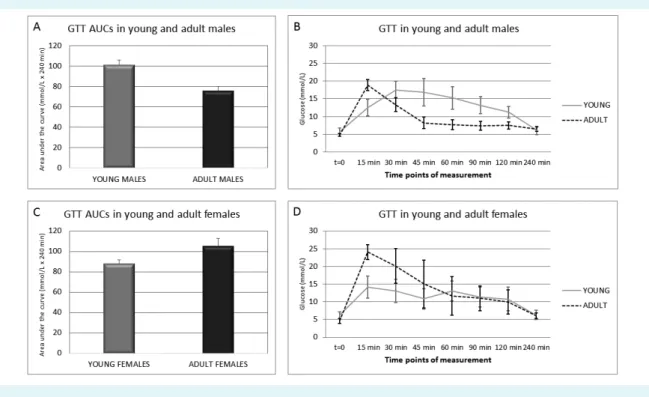
GTT data were analyzed by classical comparison of AUCs (Figure 3A and B). In males, AUC decreased after matura- tion (Figure 3A). Unlike young males, adult males reached maximum glucose concentration very fast and returned to normal glucose concentration range after 45 minutes (Fig- ure 3B). In females, AUC increased after maturation (Figure
3C). However, in young females the glucose curve was bi- phasic (Figure 3D) – it reached the first glucose concentra- tion peak after 15 minutes and the second peak after 60 minutes of the test. In adult females the glucose curve was not biphasic, and it reached maximum glucose concen- tration after 15 minutes. Because the differences between young and adult animals of both sexes were not signifi- cant, we concluded that glucose tolerance during matura- tion remained similar.
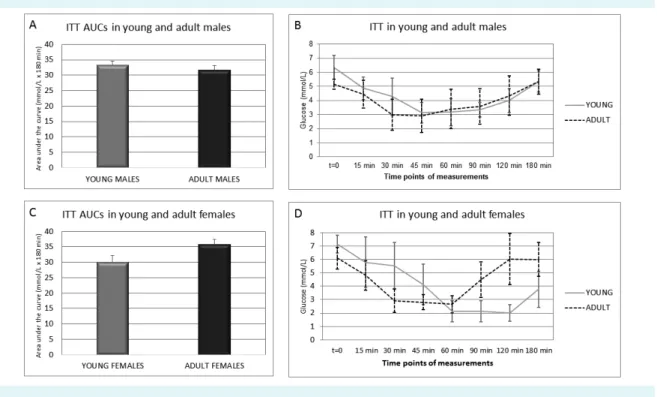
AUCs for ITT were the same in young and adult males (Figure 4A). Young males reached the minimum glucose concentration later (after 45 minutes) than adult males, who reached the minimum glucose concentration af- ter 30 minutes of the test (Figure 4B). Both male animal groups returned to glucose concentration slightly above 5 mmol/L after 180 minutes of the test, which is a sign of normoglycemia (defined as glucose concentration between 4.2 and 5.5 mmol/L). Adult females had high- er AUC than young females (Figure 4C). Young females became hypoglycemic after 60 minutes and maintained
FIGuRE 2. Workflow diagram for determining the function modeling blood glucose.
such low glucose concentration until 120 minutes of the test (Figure 4D) and did not become normoglycemic even after 180 minutes of the test. Conversely, adult fe- males reached hypoglycemic glucose concentration af- ter 60 minutes and returned to normoglycemia between 90 and 120 minutes of the test. The statistical analysis of AUCs for both GTT and ITT revealed no significant differ- ences inside same sex groups or between the two age groups. Because observed differences between young and adult animals of both sexes were not significant, we concluded that insulin sensitivity during maturation also remained similar.
Mathematical model: glucose dynamics is age and sex specific
When mathematical modeling was applied to the same GTT data, the rate of glucose increase, G´(0), was almost four times lower in young males than in adult males (Fig- ure 5A and C). Gmax was 13% higher in adult males than in young males, while the rate of glucose decrease, G´I was six times lower in young than in adult males. The maxi-
mum rate of glucose decrease to normoglycemia, tI, was reached sooner in adult (after 23.1 minutes) than in young males (after 82.0 minutes). Stabilized glucose concentra- tion, G0, in males increased upon maturation.
The same findings were observed in just 3 out of 10 fe- males that fit in the mathematical model: G´(0) was six times, while G´I was ten times lower in young compared with adult females (Figure 5B and C). Surprisingly, adult fe- males had almost twice as high Gmax than young females.
In adults, tI was reached sooner (after 19.6 minutes) than in young females (after 44.3 minutes). G0 in females was also increased upon maturation.
Between sexes, G´(0) was 1.5 times higher in young fe- males than in young males and 2.5 times higher in adult females than in adult males. G´I was 2.4 times higher in young males than in young females and 1.5 times higher in adult males than in adult females. The maximum rate of glucose decrease to normoglycemia, tI, was almost double in young males (after 82 minutes) than in young females (after 44.3 minutes) and 1.2 times higher in adult males (af-
FIGuRE 3. Glucose tolerance test (GTT) in young and adult male and female Sprague Dawley rats. (A) Areas under the glucose curve (AuCs) of young and adult males. (B) Glucose curve of young and adult males. (C) AuCs of young and adult females. (D) Glucose curve of young and adult females. Glucose curves and AuCs were constructed using trapezoidal rule based on experimental data.
Mann-Whitney test with Bonferroni correction was applied for determination of significant differences between AuCs of different animal groups, p value was set to <0.05. No significant differences were determined.
ter 23.1 minutes) than in adult females (after 19.6 minutes).
Generally, the rate of glucose increase was lower in males than in females, contrary to the rate of glucose decrease.
Stabilized glucose concentration, G0, was seven times higher in young males than in young females, while the same trend was not observed in adult animals. AUCs pre- dicted by modeling were very similar in both young and adult males and females. The described peculiarities of GTT mathematical modeling were missed by classical AUC and glucose curve. Residual sum of squares in the case of GTT was lowest in males (Figure 5), while R2 was over 90% for all the groups (data not shown).
In the case of ITT modeling, the function of young males was very similar to that of adult males (Figure 6A and C).
In males, differences were observed only in tI , which was 16.5% lower in adult than in young males, while the rest of the parameters were almost the same. G´(0) was seven times higher in adult females than in young females (Figure 6B and C). The rate of increase to normoglycemia, G´I, was 1.7 times higher in adult females, therefore tI was reached sooner in adult (after 91.5 minutes) than in young females
(after 135.7 minutes). Stabilized glucose concentration, G0, decreased 1.7 times in young females.
Between sexes, G´(0) was almost five times higher in young males compared with young females, while in adult animals no dramatical differences were observed. Young females developed life-threatening hypoglycemia (Gmin), while both age groups of males stayed above the level of hypoglycemia. G´I was 1.4 times higher in young females compared with young males and 1.7 higher in adult fe- males compared with adult males. The tI was reached faster in young males (after 122.6 minutes) than in young females (after 135.7 minutes), while the opposite was ob- served for adult females (after 91.5 minutes) and males (after 102.4 minutes). G0 was decreased in young females compared with young males, while adult males and fe- males had a similar value of G0. AUCs predicted by model- ing were very similar in all animal groups except in young females, which had the lowest AUC value. As in GTT mod- eling, the described peculiarities of mathematical model- ing were not observed when ITT results were subjected to classical analysis. Residual sum of squares in the case of ITT
FIGuRE 4. Insulin tolerance test (ITT) in young and adult male and female Sprague Dawley rats. (A) Areas under the glucose curve (AuCs) of young and adult males. (B) Glucose curve of young and adult males. (C) AuCs of young and adult females. (D) Glucose curve of young and adult females. Glucose curves and AuCs were constructed using trapezoidal rule based on experimental data.
Mann-Whitney test with Bonferroni correction was applied for determination of significant differences between AuCs of different animal groups, p value was set to <0.05. No significant differences were determined.
FIGuRE 5. Mathematical model of glucose tolerance test (GTT) in young and adult male (A) and female (B) Sprague Dawley rats. (C) The properties identified by the mathematical model: AuC = area under the curve, EstVar = estimated variance, G(0) = fasting glucose, G´(0) = initial rate of glucose concentration increase, G0 = stabilized glucose concentration, G´I = maximum rate of glucose concentra- tion decrease, Gmax = maximum concentration of glucose, TG(h) = basic period of function G, tI = time point in which G´I was reached, tmax = time point in which Gmax was reached. Residual sum of squares (RSS) was calculated to evaluate the quality of mathematical mod- eling, and data are shown in the table. The most discriminatory mathematical parameters between animal groups are shaded in gray.
FIGuRE 6. Mathematical model of insulin tolerance test (ITT) in young and adult male (A) and female (B) Sprague Dawley rats. (C) Properties identified by the mathematical model: AuC = area under the curve, EstVar = estimated variance, G(0) = fasting glucose, G´(0) = initial rate of glucose concentration decrease, G0 = stabilized glucose concentration, G´I = maximum rate of glucose concentra- tion increase, Gmin = minimum concentration of glucose, TG(h) = basic period of function G, tI = time point in which G´I was reached, tmin = time point in which Gmin was reached. Residual sum of squares (RSS) was calculated to evaluate the quality of mathematical mod- eling and data are shown in the table. The most discriminatory mathematical parameters between animal groups are shaded in gray.
was lowest in males (Figure 6), while R2 ranged from 86%- 99% for all animal groups (data not shown).
DISCuSSION
Using mathematical modeling, we generated new param- eters that described GTT and ITT results in greater detail than the AUC approach. The following mathematical pa- rameters were more discriminatory: G´(0) – the initial rate of glucose concentration increase (for GTT) or decrease (for ITT), Gmax – maximum glucose concentration for GTT, Gmin – minimum glucose concentration for ITT, tI – the time point when G´I was reached, tmax – the time point when Gmax was reached in GTT, and tmin – the time point when Gmin was reached in ITT. Residual sum of squares and R2 re- vealed whether modeled curve fitted real data – residual sum of squares was not ideal and overall it was lower in males than females. R2 revealed perfect fit (86%-99%), but this finding should be interpreted with caution since our data did not satisfy all theoretical properties for its usage due to small sample size and nonlinearity of the model.
When the AUCs were compared between classical data (Fig- ure 3 and 4) and modeled data (Figure 5 and 6), the differ- ences in glucose and insulin tolerance between the groups were not obvious, meaning that in both cases AUC is not the ideal parameter describing the glucose dynamics.
GTT modeling revealed that adult females reached tmax fast- er and had higher maximum glucose concentration (Gmax) as well as slower return to normoglycemia, which implies a possible metabolic disbalance upon such glucose fluctua- tion. The modeled AUC for GTT was lowest in adult males, revealing their good tolerance to glucose. ITT modeling revealed more prominent differences in young females – G´(0) and Gmin were lowest and hypoglycemia lasted longer than in other groups. The predicted AUC for ITT was evi- dently lower in young females, which indicates their sus- ceptibility to hypoglycemia and implies slower gluconeo- genesis response. Both young and adult male and female animals had overall good tolerance to glucose and insulin, however their glucose dynamics was different during GTT and ITT, which became more obvious only after modeling.
Animal models investigating type-2 diabetes and insulin resistance use a wide range of species, mostly rodents, and subject them to genetic, chemical, or nutritional in- terventions (26-29). It was shown that 16 and 20-month- old C57BL/6J male mice had significantly lower AUC for GTT than 4-month-old mice. The same study revealed that
adult males’ AUC was slightly reduced in response to insu- lin compared with that of young males (30). These findings agree with our data; however, the previous study did not quantify glucose dynamics.
Also, age should be taken into account when studying glu- cose metabolism, since glucose metabolism is influenced by the fine tuning of many hormones at prepubertal and pubertal age. Young rats used in this study match 9-10 year-old humans, while adult rats match 25-30 year-old humans (31).
A study in boys and girls without diabetes showed that physiologic insulin resistance started in prepuberty or pu- berty (32). Physiologically normal individuals of this age more slowly reach Gmax and more slowly return to nor- moglycemia. Two possible mechanisms underlie such glucose dynamics. During an early stage in sexual matu- ration, termed adrenarche, adrenal gland hormones are in- tensively synthesized, especially dehydroepiandrosterone sulfate (DHEA-S) (33). DHEA-S levels are inversely related to insulin sensitivity. The same clinical study also showed that preadrenarchal children were more insulin sensitive than children who already reached adrenarche. Adrenar- che occurs earlier in girls than in boys, a factor that may be responsible for the sex-specific insulin sensitivity (34), also observed in our study. Another factor influencing in- sulin resistance during puberty is an increased secretion of growth hormone (GH), which opposes insulin (35). GH release is stimulated by hypoglycemia and suppressed by oral glucose administration, which presents the standard test for inhibitory control of GH release (36). Young female Sprague Dawley rats had higher GH than males (37), which could explain hypoglycemia in young females observed in our study during ITT. During maturation females un- dergo different metabolic changes than males due to dif- ferent reproductive function, so it is reasonable to study the sexes separately. Our results clearly imply that glucose and insulin tolerance changes dramatically with extensive growth, particularly in females. Sexual dimorphism in ener- gy expenditure is an evolutional adaptation that preserves the reproductive function in females during fasting, while males mobilize energy stores during physical activity (38).
Young females do not switch to gluconeogenesis as quick- ly as males, probably due to differences in gluconeogenesis regulation and lipolysis activation. Male metabolism favors gluconeogenesis and the use of glycogen stores, while fe- male metabolism relies on fats during increased physical activity (39). In females free fatty acids are stored in sub- cutaneous adipose tissue, while in males free fatty
acids are oxidized rather than stored (40,41), a finding that is supported by the lower basal fat oxidation in women than in men (42). Insulin is known to suppress lipolysis, ie, the release of free fatty acids after a meal (43). After lipolysis of adipose tissue, women have higher delivery of free fatty acids to the liver, which puts them at a greater risk for he- patic insulin resistance (44,45).
Glucose metabolism has a different dynamics during ado- lescence than in the adulthood. Upon glucose peritoneal challenge, glucose is absorbed to the blood via peritone- al mesothelial cells. In our study, young females had de- layed glucose increase. Similar differences in glucose dy- namics between the sexes have been observed when it came to the expression and function of molecular water channels, aquaporins. When 8-10 week-old C57BL/6 mice were exposed to glucose dialysate, males and females had a matching peritoneal delivery rate of low weight mole- cules, but females had lower aquaporin 1 mRNA in peri- toneal mesothelial cells (46). Another in vitro study found that the expression of aquaporin 1 in human peritoneal mesothelial cells was significantly increased by glucose ex- posure (47).
The observed and existing data indicate that adolescents have different glucose metabolism than adults. Young animals are more prone to hypoglycemia, which was ob- served in females in ITT. Different glucose metabolism in young males and females is caused by different lipid me- tabolism and different expression of peritoneal water chan- nels and increased GH. Even though the classical glucose curves and AUCs imply reduced glucose and insulin toler- ance, this state is caused by normal maturation and does not represent a pathology. Therefore, young animals are not a good model for translational diabetes studies. Also, sex seems to be of a great importance and we strongly be- lieve the sexes should be analyzed separately.
Our study was limited by the fact that the same animals were not longitudinally studied at several time points of aging. Furthermore, the use of euglycemic-hyperinsuline- mic glucose clamp test could have provided a better as- sessment of insulin sensitivity (48). The used mathematical model was not able to predict the biphasic GTT in several young female rats.
However, the developed mathematical model has two important advantages: the possibility to identify the pa-
rameters that relevantly describe the blood glucose dynamics and the ability to quantify subtle changes
not visible in classical statistical analysis of AUC and glu- cose curve. This is why we recommend its use in future studies. We also believe the new model is applicable in the diagnostics of prediabetes.
Acknowledgment The authors thank the reviewers for the constructive comments and motivation to improve this manuscript, as well as Nenad Šuvak, PhD, from the Department of Mathematics, J. J. Strossmayer Univer- sity of Osijek for the help with data analysis.
Funding The study was funded by Regional Cooperation for Health, Science and Technology (RECOOP HST) Association formed by Cedars-Sinai Medical Center (CSMC), Los Angeles, CA, USA, RECOOP Grant #001; Croatian Science Foundation through research grants IP-2014-09-2324 and IP-2016-06-6545;
European Union through the European Regional Development Fund, Op- erational Programme Competitiveness, and Cohesion, grant agreement No.
KK.01.1.1.01.0007, CoRE – Neuro.
Ethical approval given by the Croatian Ministry of Agriculture (2158-61-07- 14-118) and National Scientific Ethics Committee on Animal Experimenta- tion of Hungary (IV/3796-7/2015).
Author contributions MB, RS, RG, SGV, and MH conceived or designed the study; MB and KS acquired the data; MB, VI, RS, IL, RG, SGV, and MH analyzed or interpreted the data; MB drafted the manuscript; all authors critically re- vised the manuscript for important intellectual content; all authors gave fi- nal approval of the version to be submitted; all authors agree to be account- able for all aspects of the work.
Competing interests All authors have completed the Unified Competing Interest form at www.icmje.org/coi_disclosure.pdf (available on request from the corresponding author) and declare: no support from any organi- zation for the submitted work; no financial relationships with any organiza- tions that might have an interest in the submitted work in the previous 3 years; no other relationships or activities that could appear to have influ- enced the submitted work.
References
1 Ernsberger P, Koletsky RJ. The Glucose Tolerance Test as a Laboratory Tool with Clinical Implications. InTech; 2012. 3-14.
2 Ayala JE, Samuel VT, Morton GJ, Obici S, Croniger CM, Shulman GI, et al. Standard operating procedures for describing and performing metabolic tests of glucose homeostasis in mice. Dis Model Mech. 2010;3:525-34. Medline:20713647 doi:10.1242/
dmm.006239
3 Ghezzi AC, Cambri LT, Botezelli JD, Ribeiro C, Dalia RA, de Mello MAR. Metabolic syndrome markers in wistar rats of different ages. Diabetol Metab Syndr. 2012;4:16. Medline:22541367 doi:10.1186/1758-5996-4-16
4 Kim W, Egan JM. The role of incretins in glucose homeostasis and diabetes treatment. Pharmacol Rev. 2008;60:470-512.
Medline:19074620 doi:10.1124/pr.108.000604 5 Chan O, Chan S, Inouye K, Shum K, Matthews SG, Vranic
M. Diabetes impairs hypothalamo-pituitary-adrenal (HPA) responses to hypoglycemia, and insulin treatment normalizes HPA but not epinephrine responses. Diabetes. 2002;51:1681-9.
Medline:12031953 doi:10.2337/diabetes.51.6.1681 6 Chan O, Inouye K, Akirav E, Park E, Riddell MC, Vranic M, et al.
Insulin alone increases hypothalamo-pituitary-adrenal activity, and diabetes lowers peak stress responses. Endocrinology.
2005;146:1382-90. Medline:15564337 doi:10.1210/en.2004-0607
7 Röder PV, Wu B, Liu Y, Han W. Pancreatic regulation of glucose homeostasis. Exp Mol Med. 2016;48(3):e219-e. Medline:26964835 doi:10.1038/emm.2016.6
8 Schuit FC, Huypens P, Heimberg H, Pipeleers DG. Glucose sensing in pancreatic β-cells. a model for the study of other glucose- regulated cells in gut, pancreas, and hypothalamus. Diabetes.
2001;50:1-11. Medline:11147773 doi:10.2337/diabetes.50.1.1 9 Wilcox G. Insulin and insulin resistance. Clin Biochem Rev.
2005;26:19-39. Medline:16278749
10 Classification and diagnosis of diabetes: standards of medical care in diabetes—2020. Diabetes Care. 2020;43 Supplement 1:S14-31.
Medline:31862745 doi:10.2337/dc20-S002
11 Müssig K, Staiger H, Machicao F, Stančáková A, Kuusisto J, Laakso M, et al. Association of common genetic variation in the FOXO1 gene with β-Cell dysfunction, impaired glucose tolerance, and type 2 diabetes. J Clin Endocrinol Metab. 2009;94:1353-60.
Medline:19141580 doi:10.1210/jc.2008-1048
12 Xue A, Wu Y, Zhu Z, Zhang F, Kemper KE, Zheng Z, et al. Genome- wide association analyses identify 143 risk variants and putative regulatory mechanisms for type 2 diabetes. Nat Commun.
2018;9:2941. Medline:30054458 doi:10.1038/s41467-018-04951-w 13 Borm K, Slawik M, Beuschlein F, Seiler L, Flohr F, Berg A, et al.
Low-dose glucose infusion after achieving critical hypoglycemia during insulin tolerance testing: effects on time of hypoglycemia, neuroendocrine stress response and patient’s discomfort in a pilot study. Eur J Endocrinol. 2005;153:521-6. Medline:16189173 doi:10.1530/eje.1.01992
14 Raff H, Sharma ST, Nieman LK. Physiological basis for the etiology, diagnosis, and treatment of adrenal disorders: Cushing’s syndrome, adrenal insufficiency, and congenital adrenal hyperplasia. Compr Physiol. 2014;4:739-69. Medline:24715566 doi:10.1002/cphy.
c130035
15 Zheng X, Bi W, Yang G, Zhao J, Wang J, Li X, et al. Hyperglycemia induced by chronic restraint stress in mice is associated with nucleus tractus solitarius injury and not just the direct effect of glucocorticoids. Front Neurosci. 2018;12:983. Medline:30618599 doi:10.3389/fnins.2018.00983
16 Morakinyo AO, Samuel TA, Awobajo FO, Adekunbi DA, Olatunji IO, Binibor Fu, et al. Adverse effects of noise stress on glucose homeostasis and insulin resistance in Sprague-Dawley rats.
Heliyon. 2019;5:e03004. Medline:31890958 doi:10.1016/j.
heliyon.2019.e03004
17 Melis JPM, Jonker MJ, Vijg J, Hoeijmakers JHJ, Breit TM, van Steeg H. Aging on a different scale–chronological versus pathology- related aging. Aging (Albany NY). 2013;5:782-8. Medline:24131799 doi:10.18632/aging.100606
18 Hall H, Perelman D, Breschi A, Limcaoco P, Kellogg R, McLaughlin T, et al. Glucotypes reveal new patterns of glucose dysregulation.
PLoS Biol. 2018;16:e2005143. Medline:30040822 doi:10.1371/
journal.pbio.2005143
19 Braun M. Differential Equations and Their Applications: An Introduction to Applied Mathematics. Fourth edition ed. New York, NY, united States: Springer-Verlag New York Inc.; 1993.
20 Hemker PW, Kok J. A project on parameter identification in reaction kinetics. Technical Report. 1993.
21 Mühlig H. Parameteridentifikation bei Differentialgleichungen mit Hilfe von B-Splines. 41. Germany: Technische universität Dresden, Dresden; 1992. p. 3-6.
22 Nyarko K, Scitovski R. Solving the parameter identification problem of mathematical models using genetic algorithms. Appl Math Comput. 2004;153:651-8.
23 Scitovski R, Jukić D. A method for solving the parameter identification problem for ordinary differential equations of the second order. Appl Math Comput. 1996;74:273-91.
24 Varah JM. A spline least squares method for numerical parameter estimation in differential equations. SIAM J Sci Statist Comput.
1982;3:28-46. doi:10.1137/0903003
25 Wolfram Research I. Mathematica Version 11.3 ed: Wolfram Research, Inc.; 2018.
26 Leiter EH, Lee C-H. Mouse models and the genetics of diabetes.
Diabetes. 2005;54 suppl 2:S151. Medline:16306333 doi:10.2337/
diabetes.54.suppl_2.S151
27 Maiese K. FoxO transcription factors and regenerative pathways in diabetes mellitus. Curr Neurovasc Res. 2015;12:404-13.
Medline:26256004 doi:10.2174/1567202612666150807112524 28 Barbosa-da-Silva S, Sarmento IB, Bargut TCL, Souza-Mello V, Aguila
MB, Mandarim-de-Lacerda CA. Animal models of nutritional induction of type 2 diabetes mellitus. Int J Morphol. 2014;32:279- 93. doi:10.4067/S0717-95022014000100046
29 Bloch O, Broide E, Ben-Yehudah G, Cantrell D, Shirin H, Rapoport MJ. Nutrient induced type 2 and chemical induced type 1 experimental diabetes differently modulate gastric GLP-1 receptor expression. J Diabetes Res. 2015;2015:561353. Medline:25893200 doi:10.1155/2015/561353
30 Oh YS, Seo E-H, Lee Y-S, Cho SC, Jung HS, Park SC, et al.
Increase of calcium sensing receptor expression is related to compensatory insulin secretion during aging in mice. PloS one.
2016;11:e0159689. Medline:27441644 doi:10.1371/journal.
pone.0159689
31 Sengupta P. The laboratory rat: relating its age with human’s. Int J Prev Med. 2013;4:624-30. Medline:23930179
32 Bloch CA, Clemons P, Sperling MA. Puberty decreases insulin sensitivity. J Pediatr. 1987;110:481-7. Medline:2950219 doi:10.1016/S0022-3476(87)80522-X
33 Nakamura Y, Gang HX, Suzuki T, Sasano H, Rainey WE. Adrenal changes associated with adrenarche. Rev Endocr Metab Disord.
2009;10:19-26. Medline:18821019 doi:10.1007/s11154-008-9092-2 34 Temeck JW, Pang S. Premature adrenarche resulting from
symptomatic nonclassical congenital adrenal hyperplasia. Pediatr Res. 1984;18:178. doi:10.1203/00006450-198404001-00511
35 Hage M, Kamenický P, Chanson P. Growth hormone response to oral glucose load: from normal to pathological conditions.
Neuroendocrinology. 2019;108:244-55. Medline:30685760 36 Roth J, Glick SM, Yalow RS. Bersonsa. Hypoglycemia: a potent
stimulus to secretion of growth hormone. Science. 1963;140:987-8.
Medline:13975313 doi:10.1126/science.140.3570.987 37 Schalch DS, Reichlin S. Plasma growth hormone concentration
in the rat determined by radioimmunoassay: influence of sex, pregnancy, lactation, anesthesia, hypophysectomy and extrasellar pituitary transplants. Endocrinology. 1966;79:275-80.
Medline:5921766 doi:10.1210/endo-79-2-275
38 Tramunt B, Smati S, Grandgeorge N, Lenfant F, Arnal J-F, Montagner A, et al. Sex differences in metabolic regulation and diabetes susceptibility. Diabetologia. 2020;63:453-61. Medline:31754750 doi:10.1007/s00125-019-05040-3
39 Hedrington MS, Davis SN. Sexual Dimorphism in glucose and lipid metabolism during fasting, hypoglycemia, and exercise.
Front Endocrinol. 2015;6:61. Medline:25964778 doi:10.3389/
fendo.2015.00061
40 Nielsen S, Guo Z, Albu JB, Klein S, O’Brien PC, Jensen MD. Energy expenditure, sex, and endogenous fuel availability in humans.
J Clin Invest. 2003;111:981-8. Medline:12671047 doi:10.1172/
JCI16253
41 uranga AP, Levine J, Jensen M. Isotope tracer measures of meal fatty acid metabolism: reproducibility and effects of the menstrual cycle. Am J Physiol Endocrinol Metab. 2005;288:E547-55.
Medline:15507534 doi:10.1152/ajpendo.00340.2004
42 Blaak E. Gender differences in fat metabolism. Curr Opin Clin Nutr Metab Care. 2001;4:499-502. Medline:11706283 doi:10.1097/00075197-200111000-00006
43 Jensen MD. Gender differences in regional fatty acid metabolism before and after meal ingestion. J Clin Invest. 1995;96:2297-303.
Medline:7593616 doi:10.1172/JCI118285
44 Miyazaki Y, Glass L, Triplitt C, Wajcberg E, Mandarino LJ, DeFronzo RA. Abdominal fat distribution and peripheral and hepatic insulin resistance in type 2 diabetes mellitus. Am J Physiol Endocrinol Metab. 2002;283:E1135-43. Medline:12424102 doi:10.1152/
ajpendo.0327.2001
45 Nielsen S, Guo Z, Johnson CM, Hensrud DD, Jensen MD. Splanchnic lipolysis in human obesity. J Clin Invest. 2004;113:1582-8.
Medline:15173884 doi:10.1172/JCI21047
46 Ni J, Cnops Y, Debaix H, Boisde I, Verbavatz JM, Devuyst O.
Functional and molecular characterization of a peritoneal dialysis model in the C57BL/6J mouse. Kidney Int. 2005;67:2021-31.
Medline:15840053 doi:10.1111/j.1523-1755.2005.00304.x 47 Lai KN, Li F, Lan Y, Tang S, Tsang AWL, Chan DTM, et al. Expression
of aquaporin-1 in human peritoneal mesothelial cells and its upregulation by glucose In vitro. J Am Soc Nephrol. 2001;12:1036- 45. Medline:11316863
48 Pacini G, Omar B, Ahren B. Methods and models for metabolic assessment in mice. J Diabetes Res. 2013;2013:986906.
Medline:23762879 doi:10.1155/2013/986906