Research article
Evaluating item dif fi culty patterns for assessing student misconceptions in science across physics, chemistry, and biology concepts
Soeharto Soeharto
a,*, Ben o Csap } o
b,caDoctoral School of Education, University of Szeged, 32-34, Pet}ofi S. sgt., Szeged, H-6722, Hungary
bInstitute of Education, University of Szeged, Hungary
cMTA-SZTE Research Group on the Development of Competencies, Hungary
A R T I C L E I N F O
Keywords:
Item difficulty Rasch measurement Misconception Science Diagnostic test
A B S T R A C T
Understanding item difficulty in science concepts is essential for teachers in teaching and learning to avoid student misconceptions. This study aims to evaluate the patterns of item difficulty estimates in science concepts exploring student misconceptions across physics, biology, and chemistry and to explore differential item func- tioning (DIF) items in the developed diagnostic test on the basis of gender and grade. Participants were drawn from 856 students (52.3% females and 47.7% males) comprising senior high school students from 11thto 12th grades and pre-service science teachers in the West Kalimantan province, Indonesia. Out of 16 science concepts categorized, the common science concepts causing misconceptions among students were investigated to under- stand item difficulty patterns using Rasch measurement. Thefindings of this study evaluated that 32 developed items are valid and reliable whereby the item difficulty estimates ranged from5.13 logits to 5.06 logits.
Chemistry is the scientific discipline with the highest mean logits than other disciplines. There is no significant item difficulty estimate across the science disciplines. We also found DIF issues in one item based on gender and four items based on grade. This study contributes a significant role in mapping and informing item difficulty patterns in science concepts to tackle teachers' problems in assessing and teaching science concepts to improve the students’science performance. Future studies and limitations are also discussed.
1. Introduction
Science concepts are critical elements in explaining and understand- ing natural phenomena across all science disciplines. The particular sci- ence concept provides a practical framework for integrating science disciplines and has a significant impact on the learning process and in the thinking and modeling of natural and technological processes. Several studies reported students' difficulties in learning scientific concepts.
Soeharto (2017)reported that students suffered misconceptions about impulses and momentum because of a lack of understanding of various types of collision. Additionally,Tiruneh et al. (2017)found that students experienced difficulty in solving critical thinking problems related to electricity and magnetism. Students' weaknesses in understanding sci- ence concepts across science disciplines are attributed to how some sci- ence concepts are introduced and applied in varied ways that are often incompatible (Cooper and Klymkowsky, 2013; Lancor, 2014). Several concepts in science are complex for students to understand, causing them to experience misconceptions. Wandersee et al. (1994) analyzed 103
studies related to misconceptions in the paradigm of science concepts, Gurel et al. (2015)found 273 articles about misconceptions across sci- ence disciplines and instruments to assess students’understanding, and Soeharto et al. (2019)found 111 articles from 2015 to 2019 that focused on student misconceptions across the disciplines of physics, biology, and chemistry. Understanding the science concepts properly will help stu- dents to work on problems of varying degrees of difficulty. Thus, the investigation of difficulty levels of science concepts across science dis- ciplines has the potential to hamper students through suffering mis- conceptions and thereby failing to achieve their best performance in science.
Indonesian students' science performances were ranked the lowest in the 2018 PISA report involving 41 countries as target participants (OECD, 2020). The issue of difficulties in understanding science concepts across science disciplines should be addressed to improve student learning outcomes. Several studies have been conducted to investigate conceptions in various science concepts across various disciplines (e.g., Butler et al. (2015),Korur (2015),Park and Liu (2019), Peterson et al.
* Corresponding author.
E-mail address:soeharto.soeharto@edu.u-szeged.hu(S. Soeharto).
Contents lists available atScienceDirect
Heliyon
journal homepage:www.cell.com/heliyon
https://doi.org/10.1016/j.heliyon.2021.e08352
Received 29 July 2021; Received in revised form 13 September 2021; Accepted 5 November 2021
2405-8440/©2021 The Author(s). Published by Elsevier Ltd. This is an open access article under the CC BY license (http://creativecommons.org/licenses/by/4.0/).
(1989),Tiruneh et al. (2017);Tümay (2016)). However, comparing the actual difficulty level of science concepts from various disciplines be- comes a problem and is challenging to implement. The results of an in- strument test may reflect differences in the respondents’abilities and the lack of ability to work on questions in various science disciplines. Hence, there is a necessity to create an instrument that allows for a standardized measurement of science concepts in various scientific fields so that teachers can recognize the especially challenging science concepts whenever they teach students in various areas of science.
The goal of objective measurement locates at the core of science, and science education research should also attempt to carry the instrument according to objective measurement criteria. Our study evaluates item difficulty estimates using a standardized instrument to assess the distributed science concepts misconceptions to students across the sci- ence disciplines using Rasch measurement and explores DIF. Although some research concentrates on students' science conceptions of particular concepts, to what extent students have experienced the ease or difficulty in understanding science concepts has not been fully elucidated using a standardized instrument to measure concepts comprehension across science disciplines. This study willfill the gap in empirical research that provides evidence related to students’difficulties in understanding sci- ence concepts across disciplines, especially science concepts that generate misconceptions in students on the basis of key concepts in the findings of previous researchfindings bySoeharto et al. (2019). Previous studies on pre-service science teachers and undergraduate students are limited (Singer, 2013), and some studies focus more on students at the secondary school level (Erman, 2017;Slater et al., 2018;Tiruneh et al., 2017; Tümay, 2016). This study will target both groups, students at secondary school and teachers who have completed pre-service and are undergoing education based on the Indonesian science core curriculum.
2. Literature review
2.1. Student misconceptions of science concepts
Misconceptions are defined as misunderstandings and interpretations that are not scientifically accurate, showing inaccurate prior insight and wrong ideas (Cooper and Klymkowsky, 2013;Ebert-May et al., 2004;Van Den Broek and Kendeou, 2008). Misconceptions come from various sources; students, teachers, textbooks, and the wider environment (Van Den Broek and Kendeou, 2008). In formal education, scientific mis- conceptions have been found through interactions between teachers and students who may experience misconceptions in the learning process.
Student misconceptions are difficult to identify using traditional methods. Teachers must understand students’misconceptions in learning and increase their correct conceptions (Brehm et al., 1986). Many sci- entific concepts are difficult to understand, which causes students to generate misconceptions (Gurel et al., 2015;Soeharto et al., 2019). Ed- ucators who teach science concepts with certain strategies may, without realizing it, actually strengthen and spread misconceptions. Thus, edu- cators must understand the level of difficulty of scientific concepts and which precise concepts cause misconceptions in students (Burgoon et al., 2011).
Numerous studies have been conducted regarding students; the un- derstanding of science concepts in various disciplines (e.g.,Laliyo et al., 2020;Liampa et al., 2019;Mubarokah et al., 2018;Planinic et al., 2019;
Prodjosantoso et al., 2019). Students in secondary school held mis- conceptions in physics and werefinding it challenging to distinguish between the concepts of wave, energy, impulse, and momentum (Caleon and Subramaniam, 2010;Kaltakci-Gurel et al., 2017;Korur, 2015;Soe- harto, 2017; Taslidere, 2016). Undergraduate students also suffered similar difficulties in distinguishing the concepts of astronomy and geometrical optics (Kaltakci-Gurel et al., 2017;Slater et al., 2018).Ding et al. (2013)found that students misunderstood the concept of light in an energy context because they had experienced misconceptions in tradi- tional physics learning in the classroom. In chemistry, undergraduate
students had identified difficulties in understanding the relationship between molecular bonds and energy (Becker and Cooper, 2014).
Additionally, pre-service science teachers mostly conceptualize heat as a material without evaluating its size or grade (Lewis and Linn, 1994). In biology, students fail to explain feeding relationships as a means of en- ergy transfer in food chains (Wernecke et al., 2018).Galvin and Mooney (2015)also found that student misconception was caused by mistakes in the biology class at the secondary school and college student levels.
Chabalengula et al. (2012)also investigatedfirst-year college students concerning their understanding of the concept of science in biology and found that students failed to understand and apply energy concepts to the human body system and feeding relationships to explain life processes using aspects of energy transformation.
Although most research is related to student misconceptions in sci- ence concepts across disciplines, only a few studies focus on under- standing the inherent difficulty level of items in science concepts in various science disciplines (e.g.,Liu et al. (2015);Park and Liu (2019)).
Recently,Lancor (2015)and Chen et al. (2014) found that students' understanding of science concepts is different for each discipline, which implied the importance of understanding the difficulty level of items in science concepts across science disciplines. Students must be able to develop their understanding of scientific concepts across all disciplines to achieve the success of the learning objectives (Krajcik et al., 2014). This finding proves that the level of difficulty in scientific concepts will be able to hinder the development of students' understanding in learning.
Knowing science concepts embedded in various disciplines is necessary to investigate students’strengths and weaknesses against different sci- entific concepts so that teachers can have the empirical evidence required to teach science concepts across the science disciplines better.
2.2. Instruments for assessing student misconceptions
Student misconceptions are difficult to identify with traditional methods. Educators have to revise and identify student misconceptions to help students understand new concepts andfinally provide opportunities for students to apply these concepts to science problems (Butler et al., 2015). To evaluate and identify students' basic knowledge of concepts in science, researchers used a diagnostic test. The diagnostic test assesses students' proportional knowledge on the basis of the science content, the science teacher can develop a clear idea about the nature of the students’ knowledge by using a diagnostic test at the beginning or the end of the learning activity (Peterson et al., 1989;Taslidere, 2016;Treagust, 1986).
Researchers in science majors have used and developed numerous instruments to assess student misconceptions or student conceptual un- derstanding (Soeharto et al., 2019). Two-tier multiple-choice diagnostic tests are the most reliable assessment tool developed to identify student misconceptions in science education majors because the multiple-choice test merely assessed student content knowledge without considering the reasoning behind students' responses (Chabalengula et al., 2012;Gurel et al., 2015;Soeharto et al., 2019). In a two-tier multiple-choice test, the first tier assesses students' insight about science concepts, whereas the second tier investigates student reasoning for their choices in thefirst tier. However, the two-tier multiple-choice test cannot differentiate students' mistakes due to lack of knowledge or simply guessing answers (Caleon and Subramaniam, 2010; Chabalengula et al., 2012). Thus, scholars introduced having the Certainty Response Index (CRI) embedded in the question, which measures the respondent level cer- tainty in thefirst two tiers, and they call this test the three-tier multi- ple-choice diagnostic test (Gurcay and Gulbas, 2015; Pes¸man and Eryılmaz, 2010). However, regardless of the students having right or wrong answers, the answers with a low level of confidence were cate- gorized as a lack of knowledge, and wrong answers with a high level of confidence were categorized as a misconception (Kaltakci-Gurel et al., 2017;Pes¸man and Eryılmaz, 2010). Instead, of using the confidence level choices or CRI on a three-tier or four-tier multiple-choice diagnostic test to differentiate between students’guessed answers or lack of knowledge
answers, this study tries a new approach to analyze items: two-tier multiple diagnostic tests using an objective instrument based on Rasch measurement. The Rasch measurement was chosen because this analysis can provide accurate results of the level of student ability and the diffi- culty of items, even analyzing the likelihood of students just guessing the answers (Sumintono and Widhiarso, 2014).
2.3. Rasch measurement
Rasch measurement is a measurement model developed by the Danish mathematician, George Rasch. Rasch measurement is formed on the basis of item–person interactions and probability estimates. Using equations, the interaction between the item and person can be elucidated and described.
People who have low ability should not de facto be able to answer items that have a high difficulty level (Andrich, 2018). The probability in Rasch measurement is determined based on the item difficulty level and the person's ability simultaneously. Moreover, the probability of answering items is differentiated by item difficulty level and individual ability (Boone et al., 2013;Khine, 2020;Planinic et al., 2019). Item difficulty level and person ability are generated and determined based on a log odds unit scale (logits) as interval data, thereby ensuring that person and item parameters are entirely independent (Bond et al., 2020;Sumintono and Widhiarso, 2014). In other words, a person's ability in a measurement remains the same regardless of the item difficulty level, and the item difficulty level does not change regardless of the person's ability. For dichotomous model, the mathematical derivation of the Rasch analysis is:
logPni1
Pni0¼BnDi
where.
Pni1orPni0 is the probability that person n encountering item i is observed in category 1 or 0,
Bnis the "ability" (theta) measure of person n,
Di is the "difficulty" (delta) measure of item i, the point where the highest and lowest categories of the item are equally probable.
(Linacre, 2021b) This study focused on analyzing item difficulty levels for science concepts across disciplines using two-tier multiple-choice diagnostic tests. The Rasch dichotomous model was used to analyze dichotomy data, where 0 was categorized as the misconception and 1 was categorized as the correct answer. The dichotomy data were used to generate the item difficulty level in logits. Rasch measurement was chosen because this method can overcome some limitations in Classical Test Theory (CTT) such as (a) the measurement or data analysis was constructed using in- terval data not categorical or nominal data; (b) the items' difficulty level and the person's ability are independent; (c) the parameter reliability can measure items and persons and depends on the size of the sample; and (d) the data on the measurement of Rasch explains the response at the in- dividual level, not group-centred statistics (Barbic and Cano, 2016).
3. Research questions
The study investigates item difficulty patterns, item–person map interaction, and DIF based on gender and grade across science disciplines using the two-tier multiple-choice diagnostic test for assessing student misconceptions. Hence, we set out the following research questions;
(1) Are the items on the instrument used valid and reliable?
(2) What are the item difficulty patterns measured by diagnostic in- struments for assessing student misconceptions on science concepts?
(3) To what extent are the item difficulties able to describe the con- cepts that cause students misconceptions across disciplines and science concepts?
(4) Are there any DIF issues based on gender and grade?
4. Methods
4.1. Participants
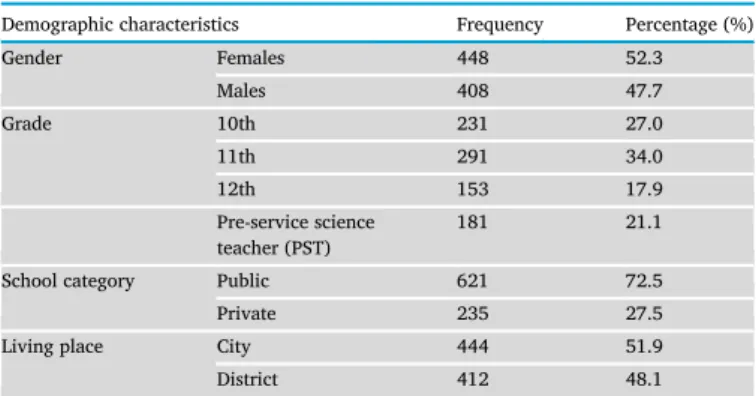
Participants were drawn from 856 senior high school students and a pre-service science teacher in Pontianak, West Kalimantan province, Indonesia. We selected 11 classes randomly fromfive different schools in total as representative schools in this area. All participants in this study were students from three different school levels, 10th, 11th, and 12th grades, and pre-service science teachers. The paper-based test was administered at the schools and university. Students and pre-service science teacher spent 120 min completing the test under the supervi- sion of researchers and teachers. Table 1 presents the demographic characteristics of the participants.
4.2. Instruments
4.2.1. Background questionnaires
The background questionnaire was adapted from the Indonesian version of the PISA 2015 SES instrument (OECD, 2016). The question- naire is embedded in the developed diagnostic test body. The background questionnaire in this study consists of information such as gender, grade, school category, home address, parents' education, and parents' jobs.
However, we omit the parents' education, home address, school category, and job data because we want to analyze item difficulties' patterns across science disciplines and analyze item differences’function on the basis of grade and gender.
4.2.2. The development of the two-tier multiple-choice diagnostic test To capture student misconceptions or alternative conceptions, we implemented the developed two-tier multiple-choice diagnostic test. The two-tier test cannot differentiate students who are just guessing answers and related confidence level, and some researchers usually applied CTT analysis and the CRI (Hasan et al., 1999). Otherwise, Rasch measurement can overcome the weakness of two-tier tests with CTT and CRI analysis in cases of the certainty level and can provide a comprehensive and objective measure (Barbic and Cano, 2016). Before constructing and developing the instrument, the researcher investigated some literature review studies and misconceptions in science handbooks (AAAS, 2012;
Allen, 2014;Csapo, 1998;Soeharto et al., 2019). This process was con- ducted tofind common rationales behind misconceptions in science.
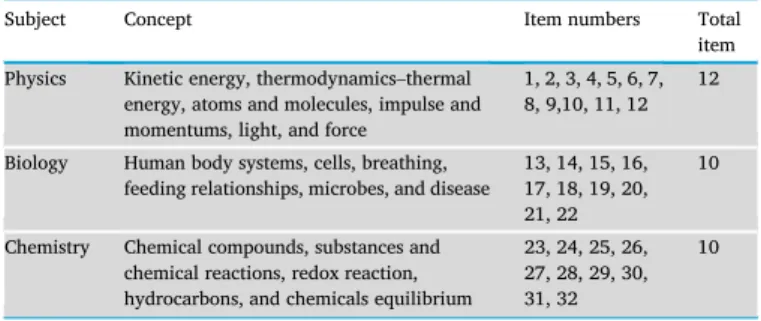
Sixteen concepts were selected and adjusted to the Indonesian education curriculum for Curriculum 2013, especially on the senior high school level from the physics, biology, and chemistry concepts represented in Table 2. Thirty-two item questions were adapted developed in the form of a two-tier multiple-choice diagnostic test with eight items is adapted from the American Association for the Advancement of Science (AAAS) (2012), two items adapted from (Csapo, 1998), 23 items newly designed by authors. The backward‒forward translation process from English to
Table 1.Demographic characteristics of participants in this study.
Demographic characteristics Frequency Percentage (%)
Gender Females 448 52.3
Males 408 47.7
Grade 10th 231 27.0
11th 291 34.0
12th 153 17.9
Pre-service science teacher (PST)
181 21.1
School category Public 621 72.5
Private 235 27.5
Living place City 444 51.9
District 412 48.1
Indonesian was conducted by two science and mathematics instructors and researchers.Table 3represents a sample item from the force concept.
The two-tier multiple-choice diagnostic test consists of two-level questions. Thefirst tier question asks about science content, and the second tier question asks about scientific reasoning. Students can choose one choice in the second tier or write down their own reason in the form of an open-ended answer to explain the related science content.Peterson et al. (1989) supported this two-tier test format since most multiple-choice questions did not provide sufficient information to explain the students' reasoning, whereas the additional explanation items in second-tier questions can assess students’understanding related to science concepts and diagnose misconceptions.
4.3. Procedures, scoring, and data analysis
Before applying data collection in schools and universities, re- searchers asked permission to administer the tests to related institutions and were granted ethical research approval from the university. With the help and supervision of teachers, the paper-based test was implemented in the classroom. For item scoring, the correct answer was scored as 1 point, and an incorrect answer was scored as 0 points for all the items.
Students get 1 point if they address the task correctly in thefirst and second tiers.
The Winsteps version 4.8.0 software (Linacre, 2021a) and Statistical Package for the Social Sciences (SPSS) version 25 (IBM SPSS, 2017) were applied in this study. Rasch analysis and some statistical methods such as descriptive statistics, internal consistency using Cronbach alpha were performed in data analysis. All samples in the data set were investigated
and included in the data analysis. Winsteps software ran the analysis based on joint maximum likelihood estimation equations; in this formulation, we produced item difficulty scores (IFILE) in log odds unit scale (logits) from student raw scores. Logits are interval data ranging from a specific value from negative infinity to a positive infinity number (Linacre, 1998,2020). Item difficulty data in logits will be used as a data variable to evaluate reliability, validity, the item difficulty pattern, and DIF using Rasch analysis. Rasch analysis has some advantages in explaining the psychometric properties of data such as (1) generating the difficulty level of an item accurately and precisely, (2) detecting the suitability and interaction of items and persons (item–person maps), (3) identifying outliers (person misfit), and (4) detecting item bias (DIF), which is useful for exploring item difficulties’ patterns in this study (Boone et al., 2016;Sumintono and Widhiarso, 2014).
5. Results
5.1. Reliability and validity
Rasch analysis provided two parameters of reliability; item reliability and person reliability, ranging from 0 to 1. Both the item and person reliability are acceptable in this study at 1.00 and 0.8, respectively (Fisher, 2007), and the item internal consistency using Cronbach's alpha value for all items is 0.88 (Taber, 2018). Item reliability is considered excellent if the value is close to 1 (Fisher, 2007;Sumintono and Wid- hiarso, 2014). It is possible to achieve if a stable item measure is used for measuring stable person measure above 500, the minimum criteria are 30 items for measuring 30 participants that can generate statistically stable measures with 95 % confidence and1.0 logits (Azizan et al., 2020). These results establish that the instrument used is sensitive enough to differentiate students' ability on different levels.
Validation criteria based on item fit statistics, standardized mean square residual (ZSTD), and the mean square residual (MNSQ) indicated two items with positive point biserial correlations (PTMA) values: BIO21 (.17) and CHEM23 (.08) do not meet thefit criteria with an outfit MNSQ above 1.6. The ideal outfit and infit MNSQ are 1 based on the Rasch measurement model, but the acceptable values range from 0.5 to 1.5 (approximately 1.6 still acceptable) and infit and outfit ZSTD ranging from2 toþ2 sequentially (Andrich, 2018;Bond et al., 2020). If the MNSQ parameters are acceptable, then ZSTD can be ignored (Linacre, 2021b). All items have a positive PTMA, which shows that all items contribute to measuring the differences in students’abilities at various Table 2.Concepts and item number in the developed two-tier multiple-choice
diagnostic test.
Subject Concept Item numbers Total
item Physics Kinetic energy, thermodynamics–thermal
energy, atoms and molecules, impulse and momentums, light, and force
1, 2, 3, 4, 5, 6, 7, 8, 9,10, 11, 12
12
Biology Human body systems, cells, breathing, feeding relationships, microbes, and disease
13, 14, 15, 16, 17, 18, 19, 20, 21, 22
10
Chemistry Chemical compounds, substances and chemical reactions, redox reaction, hydrocarbons, and chemicals equilibrium
23, 24, 25, 26, 27, 28, 29, 30, 31, 32
10
Table 3.Sample item of the two-tier multiple-choice diagnostic test on the force concept.
First tier The book with a weight of 10 N is placed on the table as shown. The book is in rest condition. Which of the following statements is correct?
a) The book at rest condition has no forces acting upon it.
b) The book has a weight force of 10 N and a reaction force of 10 N.
c) The book has a contact force of 10 N.
d) The book has weight force, contact force, and reaction force with equal quantity; each force has 10 N.
Second tier Which one of the following is the reason for your answer to the previous question?
a) When the resultant forces in the book are zero, no forces work on the book.
b) All forces in the book have equal quantity, but the resultant forces in the book are not zero because the book holds on to the table.
c) The resultant forces in the book are the same as the number of all forces working on the book's system.
d) When the book is in a rest condition, all forces negate each other.
e)….….….….….….….….….….….….….….….….….….….….….….….….….….….…….
levels. We, thus, decided to include all items in the analysis.Figure 1 presents itemfit criteria based on infit MNSQ.
For the personfit criteria, the mean of outfit and infit MNSQ are 0.95 and 1.01, which is close to the ideal threshold around 1, and the mean of infit and outfit ZSTD are -0.1 and 0.1, which are still acceptable. The result from the personfit criteria confirms that participants in this study arefit based on Rasch measurement.
5.2. Unidimensionality and local independence
The principal component analysis of Rasch (PCAR) was used to evaluate instrument dimensionality. The two-tier multiple-choice diag- nostic test was used to assess student misconception in science, so we assumed that the unidimensionality criteria as a single factor to measure misconception in science as a latent construct. Based on PCAR, a test only measures a dimension if the minimum variance explained by the measure
is>30 % (Linacre, 1998). Results showed that the variance explained by
measures was 38.5%, showing that the developed test met the unidi- mensionality assumption.
Local independence confirms that the performance of one item is independent of the performance of other items, with the raw residual correlation between pairs of the items<0.3 (Boone et al., 2013). the items in the test have a residual correlation around 0.1 and 0.28 which means that the assumption of local independence was meet in this study.
5.3. Item difficulty pattern between science concepts and disciplines We calculated the standard deviation (SD) and the mean of average item difficulty measure for each of the three science disciplines, that is, physics, biology, and chemistry, using item difficulty estimates or logits of items (Table 4).Table 4shows that the mean of items in chemistry was the most difficult than the mean of items in physics and biology. The mean of items in biology was placed as the easiest on the basis of the mean of item difficulties.
Additionally, we also calculated the item difficulty estimates (mea- sure) on the basis of the 16 science concepts as shown inTable 5in this study. When comparing item difficulty for each concept, the redox re- action (CHEM 32) with 5.06 logits was the most challenging item to solve
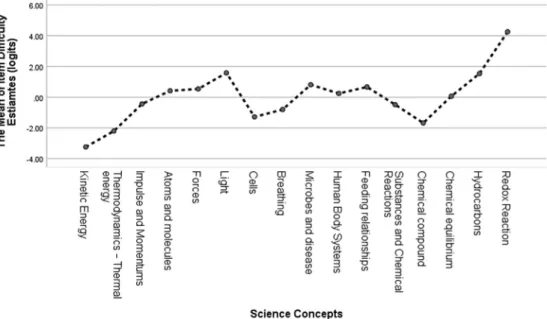
among all of the items in chemistry, and kinetic energy (PHY1) with 5.13 logits was the easiest item among all of the items in physics. We explore the specific item difficulty estimates for each item number and itemfit parameters inTable 5.Figure 2also represents the item difficulty pattern in specific science concepts to make it easier to understand data distributions of item difficulty levels between the science concepts and the science disciplines.
A two-way Analysis of Variance (ANOVA) was used to analyze the effect of science concepts and science discipline on item difficulty esti- mates based on logits. The 22 ANOVA group in this study achieved the assumption of homogeneity variances based on Levene's test (p>0.05).
To validate the normality data assumption, the Kolmogorov–Smirnov test was run before conducting the two-way ANOVA. The results showed that the item difficulty estimates did not differ significantly from normality (p
>0.05) with kurtosis (2.21) and skewness (0.14).
As presented inTable 6, the results showed a significant effect of science concepts on item difficulty estimates with a large effect size, F (13)¼4.76, p<0.0. Also, the interaction effect of science disciplines and science concepts showed a significant effect on item difficulty estimates F (15)¼4.59, p<0.0. However, the difference of item difficulties esti- mates among science disciplines was found to be insignificant, F (2)¼ 1.30, p>0.05. We can assume that there were no significant differences in the population average among the three different science disciplines, i.e., physics, biology, and chemistry, based on a two-way ANOVA, although the difference in the mean logits of item difficulty as shown in Table 4, positioning items in chemistry as being more difficult than items in physics and biology. Both the science concepts and science disciplines can explain 81% of the variance on item difficulty estimates. To sum up,
Figure 1. The bubble chart for itemfit criteria based on infit MNSQ.
Table 4.Standard deviation and mean of item difficulty based on the science discipline.
Science discipline Number of items Difficulty
M SD
Physics 12 0.56 2.12
Biology 10 0.07 0.95
Chemistry 10 0.74 2.23
Table 5.Item difficulty estimates and itemfit parameters.
Item code Discipline Science Concept Measure
(logits)
INFIT MNSQ
OUTFIT MNSQ
PTMA Source
referenced
PHY1 Physics Kinetic energy 5.13 0.96 0.13 0.22 (AAAS, 2012)
PHY2 Kinetic energy 1.35 1.08 1.06 0.37 Authors
PHY3 Thermodynamics—thermal
energy
4.02 1.05 0.43 0.23 Authors
PHY4 Thermodynamics—thermal
energy
0.38 1.21 1.43 0.28 Authors
PHY5 Impulse and momentums 0.99 0.77 0.61 0.63 Authors
PHY6 Impulse and momentums 0.11 0.91 0.92 0.52 Authors
PHY7 Atoms and molecules 0.84 0.77 0.71 0.61 (AAAS, 2012)
PHY8 Atoms and molecules 0.01 0.67 0.59 0.72 Authors
PHY9 Force 0.02 0.58 0.51 0.78 (AAAS, 2012)
PHY10 Force 1.09 0.75 0.65 0.62 Authors
PHY11 Light 0.85 0.72 0.63 0.66 (Csapo, 1998)
PHY12 Light 2.31 1.10 1.14 0.23 Authors
BIO13 Biology Cells 0.59 1.23 1.38 0.27 (AAAS, 2012)
BIO14 Cells 1.97 1.18 0.66 0.36 Authors
BIO15 Breathing 0.92 1.12 1.52 0.33 (AAAS, 2012)
BIO16 Breathing 0.68 0.96 1.27 0.44 Authors
BIO17 Microbes and disease 0.63 1.36 1.34 0.16 (AAAS, 2012)
BIO18 Microbes and disease 0.99 1.10 1.06 0.34 Authors
BIO19 Human body systems 0.53 0.98 1.00 0.45 Authors
BIO20 Human body systems 0.05 0.79 0.71 0.63 Authors
BIO21 Feeding relationships 0.42 1.32 1.72 0.17 Authors
BIO22 Feeding relationships 0.91 1.05 1.02 0.38 (Csapo, 1998)
CHEM23 Chemistry Substances and chemical reactions 0.28 1.43 1.68 0.08 (AAAS, 2012)
CHEM24 Substances and chemical reactions 1.25 1.02 0.92 0.43 Authors
CHEM25 Chemical compound 2.03 0.92 1.25 0.37 Authors
CHEM26 Chemical compound 1.32 0.93 0.87 0.48 Authors
CHEM27 Chemical equilibrium 0.36 1.23 1.47 0.26 Authors
CHEM28 Chemical equilibrium 0.49 0.94 1.00 0.48 Authors
CHEM29 Hydrocarbons 1.15 1.00 0.97 0.41 (AAAS, 2012)
CHEM30 Hydrocarbons 1.92 0.94 0.79 0.41 Authors
CHEM31 Redox reaction 3.46 0.87 0.71 0.31 Authors
CHEM32 Redox reaction 5.06 0.94 0.32 0.20 Authors
Figure 2. Item difficulty patterns between science concepts and across science disciplines.
thesefindings indicated that the item difficulties pattern varies across science concepts, although there are no significant mean differences of item difficulties among disciplines.
5.4. Specific investigation on item difficulty pattern among science concepts For understanding concepts in science distributing misconception to students, we can inspect the item difficulty estimates results fromTable 5.
The item difficulty estimates can be segmented into four categories; very easy (logits<1), easy (1logits<0), difficult (0logits<1), and very difficult (logits1) (Sumintono and Widhiarso, 2014). Item diffi- culty estimates in physics showed that concepts of light (PHY11 and PHY12) are more difficult than other concepts in that discipline. All items in physics have logits ranging from5.12 to 2.13 (very difficult). The concept of kinetic energy (PHY1) is the easiest concept to answer because the concept application can be learned easily. In biology, all item logits are ranging from1.97 to 0.99. Microbes and disease (BIO 18) have 0.99 of logits (difficult) compared with other items in that discipline, indicating that students have suffered misconceptions and difficulty answering correctly, whereas Cells (BIO 14) is the item that is the easiest one to answer correctly with1.97 logits. Chemistry has the highest difficulty level among the three science disciplines with logits ranging from2.03 to 5.06. Redox reaction (CHEM32) has 5.06 logits and was found to be the most difficult item to answer, indicating that students suffer severe mis- conceptions in redox reaction concepts. To visualize the item difficulty pattern from each concept among disciplines, we calculated the mean of item difficulty pattern for each concept inFigure 3.
5.5. DIF based on gender and grade
DIF analysis was performed to assess differences in item function on the basis of gender and grade on all items in test. DIF analysis
investigated item responses on the basis of categorical variables for each item on assessing student misconceptions using a test (Adams et al., 2020;Boone et al., 2013). Differential item functioning analysis is cate- gorized into three types: moderate to large (| DIF |0.64 logits), slight to moderate (| DIF | 0.43 logits), and negligible (Zwick et al., 1999).
Figure 4shows that, overall, items do not have DIF based on gender, except one item in chemistry (CHEM 32). For DIF based on grade, we compared four different cohorts: 10th grade, 11th grade, 12th grade, and the PST. Four items are categorized to differ based on grade: PHY1, PHY5, CHEM23, and CHEM32 (seeFigure 5).
6. Discussions
Through the statistical analysis, we have confirmed that all items used in the developed instrument meet the valid and reliable criteria accord- ing to the parameters for the Rasch measurement. The 32 developed items have outfit and infit MNSQ ranging from 0.13 to 1.72 (seeTable 5), whereby ZSTD can be ignored if the sample size is more than 500 re- spondents (Azizan et al., 2020;Linacre, 2021b).Figure 1shows the item fit pattern based on the MNSQ infit. Several studies had validated the difficulty of items in specific science concepts across science disciplines, such as the concept of energy (e.g.,Park and Liu (2019);Neumann et al.
(2013)). However, the present study attempts to validate and evaluate item difficulty patterns on various science concepts resulting in student misconceptions that are still limited to the science education area. On the basis of thefindings, we can confirm that the item difficulty level is not always reached by students, whereby students must master the more accessible concepts before learning the more complex concepts. This result was in line with previous studies examining the item difficulty level in science subjects (Steedle and Shavelson, 2009), although the science concept under this study is different and the focus is on common concepts causing student misconceptions in science learning.
The difficulty item pattern in the 16 science concepts studied had different average item difficulty levels based on three specific disciplines offered in Indonesian schools (refer toTable 4). The average value of items in thefield of chemistry (M: 0.74 logits, SD: 2.23) was much higher than items in the concept of physics (M:0.56 logits, SD: 2.12) and biology (M:0.07 logits, SD: 0.95), whereby items with the redox re- action concept (CHEM32) with 5.06 logits in chemistry are the most difficult items to be understood by students, indicating that students often experience misconceptions of the redox reaction concept. These findings were also supported by previous research byLaliyo et al. (2019) Table 6.Two-way ANOVA for item difficulty measure.
Dependent variable Sum of
squares
df Mean
square
f p
Disciplines 9.27 2 4.63 1.30 0.28
Science concepts 81.66 13 6.28 4.76 0.00
Disciplines * Science concepts 90.93 15 6.06 4.59 0.00 R2¼.81 (adjusted R2¼.63)
Figure 3. The mean of item difficulty estimates based on science concepts.
measuring the item difficulty level in the redox reaction concept of 1150 Indonesian students having 1.27 logits with the highest logits measure.
This study also assumed that the redox reaction was the concept causing students to experience misconceptions. The concept of the redox reaction is an important topic to understand because the redox reaction helps students understand the phenomena that occur in elements in chemical reactions such as losing and gaining electrons or increasing and decreasing oxidation numbers (Treagust et al., 2014).
The results of the two-way ANOVA show that there is a significant effect on the difficulty estimates of whole items on each science concept, p<0.05. There is also a significant interaction between science concepts and disciplines. However, the item difficulty estimates did not differ significantly in the three different science disciplines, p>0.05. These
findings are consistent with previous studies that found the item diffi- culty estimates in science concepts did not differ by science disciplines (Park and Liu, 2019). Thisfinding implies that students’understanding of various science concepts has a different pattern. However, it tends to be similar across science disciplines, especially in physics, biology, and chemistry, indicating that students have different abilities in solving science problems regarding science concepts.
To investigate the item difficulty estimates for each science concept in the present study, we categorized the average item difficulty estimates for each concept into four categories inTable 7. Four concepts occupy the very difficult categories, namely, forces, light, hydrocarbons, redox reaction. The forces and light concepts in physics subject were also identified as concepts that distribute misconception to students Figure 4. DIF measure based on gender.
Figure 5. DIF measure based on grade.
(Kaltakci-Gurel et al., 2017; Soeharto et al., 2019). In chemistry, the hydrocarbons and Redox were also reported as concepts that were difficult to understand, thus causing student misunderstanding in science learning (Erman, 2017;Laliyo et al., 2019;Ramirez et al., 2020). Five concepts are in the difficult category (seeTable 7), specifying students’ difficulty in answering or understanding the particular science concept correctly. The item difficulties of each concept were also proven to differ in a previous study byPark and Liu (2019)that reported the item diffi- culties of the concept of energy concepts in science varied based on students' abilities. Mapping the level of items in science concepts can help teachers realize conditions in teaching specific science concepts consid- ered difficult to learn in classroom activities. By understanding the dif- ficulty level of items in various science concepts, the teacher can estimate which concepts cause students to experience misconceptions in science learning.
DIF confirms that CHEM32 has differences based on gender. In CHEM 32, the item difficulty estimates for females, DIF measure, is 4.69 logits, and for males, the DIF measure is 5.70. These results were in line with previous studies by (Wyse and Mapuranga, 2009) that reported that DIF might happen based on the respondent background, such as gender, and the DIF measure varies according to the item difficulty level. Hence, the DIF contrast is 1.01 logits indicating females are 1.61 logits less able to address item CHEM 32 than males, so CHEM32 was categorized as moderate to large on DIF. DIF based on grade confirmed that four items were difficult for students to understand based on the school level:
PHY1, PHY5, CHEM23, and CHEM32. Thesefindings indicate that the school level or grade has a reasonably significant implication in assess- ing the differences in students’ ability to work on items on science concepts. Comparing the DIF contrast from 10th grade to 11th grade, 12th grade, and the PST for PHY1, PHY5, and CHEM32, the DIF contrast on PHY1 was categorized into moderate to large DIF with 1.73 logits, 1.99 logits, and 1.28 logits, respectively, showing that students in the 10th grade were less able to solve PHY1 than the other grades. The DIF contrast on PHY5 was categorized into moderate to large DIF with 0.83 logits, 1.18 logits, and 0.46 logits showing students in the 10th grade were less able to solve PHY5 than the other grades. The DIF contrast on CHEM32 was categorized into moderate to large DIF with0.84 logits, 0.93 logits, and 0.77 logits indicating that students in the 10th grade can better solve item CHEM32 than those in the 11th and 12th grades, but those in the 10th grade have less ability than the PST to solve item CHEM32. The DIF contrast on CHEM23 was categorized into moderate to large DIF for 11th–10th grades (0.676 logits) and 12th–10th grades (0.943), the negative values showing that students in the 11th and 12th grades have less ability to solve item CHEM23 than those in the 10th grade.
7. Conclusions
In summary, all items in the developed two-tier multiple choices diagnostic test meet the valid and reliable criteria. Our study confirms that the difficulty level of items on various science concepts is not uni- versally based on science topics, but they are connected or similar across science disciplines, especially in physics, biology, and chemistry. We also
found particular items in the science concept may have different diffi- culty levels based on gender and grade.
7.1. Limitations and future study
We accept that there are some limitations in our study such as the items not covering all concepts in science learning, only selecting a few items across disciplines that persistently generate misconceptions, the fact that the dataset used only cross-sectional data, and the lack of racking analysis. Some of the limitations outlined above are the im- provements that we must consider in further research. Variations of items studied in the further work should be able to cover all science concepts taught across science disciplines, especially at the senior high school level, so that researchers can map the overall item difficulty level of whole science concepts. Time series data collection or longitudinal research design must be added to explore whether there is a change of item difficulty level with the racking method in the Rasch measurement.
Racking analysis allows researchers to evaluate whether there is a change in the difficulty level of the item on the different testing times sequen- tially (Arnold et al., 2018;Linacre, 2021b). We feel this research can encourage other researchers to explore further the difficulty level of items in science concepts across disciplines. Understanding the item difficulty level can help teachers be more careful and concerned about conducting learning activities to deliver particular scientific concepts found difficult to comprehend by students.
For a future study, we will explore in more detail person ability es- timates to identify students’misconceptions and investigate whether students are guessing answers or have inconsistent answer patterns. By evaluating student misconceptions in science, teachers can determine the extent to which students experience misconceptions in science learning.
Declarations
Author contribution statement
Soeharto Soeharto and Ben}o Csapo: Conceived and designed the ex- periments; Performed the experiments; Analyzed and interpreted the data;
Contributed reagents, materials, analysis tools or data; Wrote the paper.
Funding statement
This work was supported by the University of Szeged Open Access Fund (grant number: 5436).
Data availability statement
Data associated with this study has been deposited online athttps://fi gshare.com/articles/dataset/item_difficulites_pattern_sav/16926115/1.
Declaration of interests statement
The authors declare no conflict of interest.
Additional information
No additional information is available for this paper.
References
AAAS, 2012. American Association for the Advancement of Science (AAAS).https://
www.aaas.org/programs/project-2061.
Adams, D., Joo, M.T.H., Sumintono, B., Oh, S.P., 2020. Blended learning engagement in higher education institutions: a differential item functioning analysis of students’
backgrounds. Malays. J. Learn. Instr. 17 (1), 133–158.
Allen, M., 2014. Misconceptions in Primary Science. McGraw-hill Education.
Andrich, D., 2018. Advances in social measurement: a Rasch measurement theory.
Perceived Health Adapt. Chronic Dis. 66–91.
Table 7.The science concept categorization of item difficulty estimates based on the logits mean.
Very easy (logits<1) Easy item (1logits<0)
Difficult item (0logits<1)
Very difficult item (logits1) Kinetic energy,
thermodynamics—thermal energy, cells, and chemical compound
Impulse and momentums, breathing, microbes and disease, substances, and chemical reactions
Atoms and molecules, feeding relationships, human body systems, and chemical equilibrium
Force, light, hydrocarbons, and redox reaction
Arnold, J.C., Boone, W.J., Kremer, K., Mayer, J., 2018. Assessment of competencies in scientific inquiry through the application of rasch measurement techniques. Educ.
Sci. 8 (4).
Azizan, N.H., Mahmud, Z., Rambli, A., 2020. Rasch rating scale item estimates using maximum likelihood approach: effects of sample size on the accuracy and bias of the estimates. Int. J. Adv. Sci. Technol. 29 (4), 2526–2531.
Barbic, S.P., Cano, S.J., 2016. The application of Rasch measurement theory to psychiatric clinical outcomes research: commentary on…Screening for depression in primary care. BJPsych Bull. 40 (5), 243–244.
Becker, N.M., Cooper, M.M., 2014. College chemistry students’understanding of potential energy in the context of atomic-molecular interactions. J. Res. Sci. Teach. 51 (6), 789–808.
Bond, T.G., Fox, C.M., Lacey, H., 2020. Applying the Rasch Model: Fundamental Measurement in the Human Sciences. Routledge.
Boone, W.J., Staver, J.R., Yale, M.S., 2013. Rasch Analysis in the Human Sciences.
Springer.
Boone, William J, Townsend, J. Scott, Staver, John R., 2016. Utilizing Multifaceted Rasch Measurement Through FACETS to Evaluate Science Education Data Sets Composed of Judges, Respondents, and Rating Scale Items: An Exemplar Utilizing the Elementary Science Teaching Analysis Matrix Instrument. Sci. Educ. 100 (2), 221–238.
Brehm, S.A., Anderson, C.W., DuBay, J., 1986. Ecology, a Teaching Module. Institute for Research on Teaching, Michigan State University.
Burgoon, J.N., Heddle, M.L., Duran, E., 2011. Re-examining the similarities between teacher and student conceptions about physical science. J. Sci. Teach. Educ. 22 (2), 101–114.
Butler, J., Mooney Simmie, G., O’Grady, A., 2015. An investigation into the prevalence of ecological misconceptions in upper secondary students and implications for pre- service teacher education. Eur. J. Teach. Educ. 38 (3), 300–319.
Caleon, I., Subramaniam, R., 2010. Development and application of a three-tier diagnostic test to assess secondary students’understanding of waves. Int. J. Sci. Educ. 32 (7), 939–961.
Chabalengula, Mweene, V., Sanders, M., 2012. Diagnosing students’understanding of energy and. Int. J. Sci. Math. Educ. 10 (June 2010), 241–266.
Chen, R.F., Scheff, A., Fields, E., Pelletier, P., Faux, R., 2014. Mapping energy in the Boston public schools curriculum. In: Teaching and Learning of Energy in K–12 Education. Springer, pp. 135–152.
Cooper, M.M., Klymkowsky, M.W., 2013. The trouble with chemical energy: why understanding bond energies requires an interdisciplinary systems approach. CBE- Life Sci. Educ. 12 (2), 306–312.
Csapo, B., 1998. Iskolai Tudas. Osiris Kiado.
Ding, L., Chabay, R., Sherwood, B., 2013. How do students in an innovative principle- based mechanics course understand energy concepts? J. Res. Sci. Teach. 50 (6), 722–747.
Ebert-May, D., Williams, K., Luckie, D., Hodder, J., 2004. Climate change: confronting student ideas. Front. Ecol. Environ. 2 (6), 324–325.
Erman, E., 2017. Factors contributing to students’misconceptions in learning covalent bonds. J. Res. Sci. Teach. 54 (4), 520–537.
Fisher, W.P.J., 2007. Rating scale instrument quality criteria. Rasch Meas. Trans. 21 (1), 1095.http://www.rasch.org/rmt/rmt211m.htm.
Galvin, E., Mooney, S.G., 2015. Identification of misconceptions in the teaching of biology: a pedagogical cycle of recognition, reduction and removal. High Educ. Soc.
Sci. 8 (2), 1–8.
Gurcay, D., Gulbas, E., 2015. Development of three-tier heat, temperature and internal energy diagnostic test. Res. Sci. Technol. Educ. 33 (2), 197–217.
Gurel, D.K., Eryilmaz, A., McDermott, L.C., 2015. A review and comparison of diagnostic instruments to identify students’misconceptions in science. Eurasia J. Math. Sci.
Technol. Educ. 11 (5), 989–1008.
Hasan, S., Bagayoko, D., Kelley, E.L., 1999. Misconceptions and the certainty of response index (CRI). Phys. Educ. 34 (5), 294–299.
IBM SPSS, 2017. IBM SPSS Statistics for Windows, Version 25. IBM SPSS Corp, Armonk, NY [Google Scholar].
Kaltakci-Gurel, D., Eryilmaz, A., Christie, L., McDermott, 2017. Development and application of a four-tier test to assess pre-service physics teachers’misconceptions about geometrical optics. Res. Sci. Technol. Educ. 35 (2), 238–260.
Khine, M.S., 2020. Rasch measurement. In: Rasch Measurement.
Korur, F., 2015. Exploring seventh-grade students’and pre-service science teachers’
misconceptions in astronomical concepts. Eurasia J. Math. Sci. Technol. Educ. 11 (5), 1041–1060.
Krajcik, J., Chen, R.F., Eisenkraft, A., Fortus, D., Neumann, K., Nordine, J., Scheff, A., 2014. Conclusion and summary comments: teaching energy and associated research efforts. In: Teaching and Learning of Energy in K–12 Education. Springer, pp. 357–363.
Laliyo, L.A.R., Botutihe, D.N., Panigoro, C., 2019. The development of two-tier instrument based on distractor to assess conceptual understanding level and student misconceptions in explaining redox reactions. Int. J. Learn. Teach. Edu. Res. 18 (9), 216–237.
Laliyo, L.A.R., Puluhulawa, F.U., Eraku, S., Salimi, Y.K., 2020. The prevalence of students and teachers’ideas about global warming and the use of renewable energy technology. Journal of Environmental Accounting and Management 8 (3), 243–256.
Lancor, R., 2015. An analysis of metaphors used by students to describe energy in an interdisciplinary general science course. Int. J. Sci. Educ. 37 (5–6), 876–902.
Lancor, R.A., 2014. Using student-generated analogies to investigate conceptions of energy: a multidisciplinary study. Int. J. Sci. Educ. 36 (1), 1–23.
Lewis, E.L., Linn, M.C., 1994. Heat energy and temperature concepts of adolescents, adults, and experts: implications for curricular improvements. J. Res. Sci. Teach. 31 (6), 657–677.
Liampa, V., Malandrakis, G.N., Papadopoulou, P., Pnevmatikos, D., 2019. Development and evaluation of a three-tier diagnostic test to assess undergraduate primary teachers’understanding of ecological footprint. Res. Sci. Educ. 49 (3), 711–736.
Linacre, John M., 2021a. Winsteps®(Version 4.8.0) [Computer Software]. Winsteps.com https://www.winsteps.com/.
Linacre, John M., 2021b. Winsteps®Rasch measurement computer program User’s Guide. Winsteps.com..
Linacre, J.M., 1998. Detecting multidimensionality: which residual data-type works best?
J. Outcome Meas. 2, 266–283.
Linacre, J.M., 2020. Winsteps®(Version 4.7.0) [Computer Software]. (4.7.0).
Winsteps.com https://www.winsteps.com/.
Liu, O.L., Ryoo, K., Linn, M.C., Sato, E., Svihla, V., 2015. Measuring knowledge integration learning of energy topics: a two-year longitudinal study. Int. J. Sci. Educ.
37 (7), 1044–1066.
Mubarokah, F.D., Mulyani, S., Indriyanti, N.Y., 2018. Identifying students’
misconceptions of acid-base concepts using a three-tier diagnostic test: a case of Indonesia and Thailand. J. Turk. Sci. Edu. 15 (Special Issue), 51–58.
Neumann, K., Viering, T., Boone, W.J., Fischer, H.E., 2013. Towards a Learning Progression of Energy, 50, pp. 162–188 (2).
OECD, 2016. PISA 2015 Results (Volume I): Excellence and Equity in Education.
OECD, 2020. Science Performance (PISA) (Indicator).
Park, M., Liu, X., 2019. An Investigation of Item Difficulties in Energy Aspects across Biology, Chemistry, Environmental Science, and Physics. Research in Science Education.
Pes¸man, H., Eryılmaz, A., 2010. Development of a three-tier test to assess misconceptions about simple electric circuits. J. Educ. Res. 103 (3), 208–222.
Peterson, R.F., Treagust, D.F., Garnett, P., 1989. Development and application of a diagnostic instrument to evaluate grade-11 and-12 students’concepts of covalent bonding and structure following a course of instruction. J. Res. Sci. Teach. 26 (4), 301–314.
Planinic, M., Boone, W.J., Susac, A., Ivanjek, L., 2019. Rasch analysis in physics education research: why measurement matters. Phys. Rev. Phys. Edu. Res. 15 (2), 1–14.
Prodjosantoso, A.K., Hertina, A.M., Irwanto, 2019. The misconception diagnosis on ionic and covalent bonds concepts with three tier diagnostic test. Int. J. InStruct. 12 (1), 1477–1488.
Ramirez, A., Sarathy, S.M., Gascon, J., 2020. CO2 derived E-fuels: research trends, misconceptions, and future directions. Trends Chem. 2 (9), 785–795.
Slater, E.V., Morris, J.E., McKinnon, D., 2018. Astronomy alternative conceptions in pre- adolescent students in Western Australia. Int. J. Sci. Educ. 40 (17), 2158–2180.
Soeharto, Csapo, B., Sarimanah, E., Dewi, F.I., Sabri, T., 2019. A review of students’
common misconceptions in science and their diagnostic assessment tools. Jurnal Pendidikan IPA Indonesia 8 (2), 247–266.
Soeharto, S., 2017. PHYCCTM development based on KKNI on impuls and momentum material to increase HOTS and independent character. EDUCATIO : J. Educ. 2 (2).
Steedle, J.T., Shavelson, R.J., 2009. Supporting valid interpretations of learning progression level diagnoses. J. Res. Sci. Teach.: Off. J. Nat. Assoc. Res. Sci. Teach. 46 (6), 699–715.
Sumintono, B., Widhiarso, W., 2014. Aplikasi Model Rasch Untuk Penelitian Ilmu-Ilmu Sosial (Edisi Revisi). Trim Komunikata Publishing House.
Taber, K.S., 2018. The use of Cronbach’s alpha when developing and reporting research instruments in science education. Res. Sci. Educ. 48 (6), 1273–1296.
Taslidere, E., 2016. Development and use of a three-tier diagnostic test to assess high school students’misconceptions about the photoelectric effect. Res. Sci. Technol.
Educ. 34 (2), 164–186.
Tiruneh, D.T., De Cock, M., Weldeslassie, A.G., Elen, J., Janssen, R., 2017. Measuring critical thinking in physics: development and validation of a critical thinking test in electricity and magnetism. Int. J. Sci. Math. Educ. 15 (4), 663–682.
Treagust, D., 1986. Evaluating students’misconceptions by means of diagnostic multiple choice items. Res. Sci. Educ. 16 (1), 199–207.
Treagust, D.F., Mthembu, Z., Chandrasegaran, A.L., 2014. Evaluation of the predict- observe-explain instructional strategy to enhance students’understanding of redox reactions. In: Learning with Understanding in the Chemistry Classroom. Springer Netherlands, pp. 265–286.
Tümay, H., 2016. Reconsidering learning difficulties and misconceptions in chemistry:
emergence in chemistry and its implications for chemical education. Chem. Educ.
Res. Pract. 17 (2), 229–245.
Van Den Broek, P., Kendeou, P., 2008. Cognitive processes in comprehension of science texts: the role of co-activation in confronting misconceptions. Appl. Cognit. Psychol.:
Off. J. Soc. Appl. Res. Memory Cogn. 22 (3), 335–351.
Wandersee, J.H., Mintzes, J.J., Novak, J.D., 1994. Research on alternative conceptions in science. Handbook Res. Sci. Teach. Learn. 177, 210.
Wernecke, U., Schütte, K., Schwanewedel, J., Harms, U., 2018. Enhancing conceptual knowledge of energy in biology with incorrect representations. CBE-Life Sci. Educ. 17 (1) ar5.
Wyse, A.E., Mapuranga, R., 2009. Differential item functioning analysis using rasch item information functions. Int. J. Test. 9 (4), 333–357.
Zwick, R., Thayer, D.T., Lewis, C., 1999. An empirical Bayes approach to Mantel-Haenszel DIF analysis. J. Educ. Meas. 36 (1), 1–28.