Volume 4 Number 3 December 2018 page 145-150 p-ISSN:2460-1497 and e-ISSN: 2477-3840
DOI: http://dx.doi.org/10.26858/est.v1i1.7001
145
The Analysis of students’ higher order thinking skills (HOTS) in Wave and Optics Using IRT with winstep Software
Soeharto1, Rosmaiyadi2
1 Educational Sciences, University of Szeged, Hungary Email: Soehartofisika@gmail.com
2Educational Mathematics, STKIP Singkawang, Indonesia Email: Rosmaiyadialong@gmail.com
©2018 – EST Graduate Program Universitas Negeri Makassar. This is an article with open access under license CC BY-NC-4.0 (https://creativecommons.org/licenses/by-nc/4.0/ ).
ABSTRACT
This study aims to determine the Descriptions of Student Higher Order Thinking Skills (HOTS) of Singkawang STKIP physics education students. In addition, this research also aims to. This research is quantitative descriptive. Validity and reliability tests in this study will use rasch modeling with the help of Winsteps software. Through this research will be obtained the exposure of HOTS data of Singkawang STKIP physics education students on wave and optical material so that it is expected to be the basis for further research. In this research, HOTS description of students is produced, namely: (1) HOTS students at the highest ability are owned by LD02 (measure = +2.56 logit) to the lowest ability possessed by LD09 (measure = -2.42) with a standard level of difficulty of the problem with a logit value of 0.48 (2) most students experience difficulties when formulating the physics equation and the calculation process (3) analyzing is the ability that is most dominated by students with logit values in a row of - 0.71 and -0.67 followed by creative ability with logit values of -0.12 and -, 028, respectively, the ability to evaluate with logit values of 0.00, 0.95 and 0.82, respectively. , (4) item reability is a matter of 0.71 (Reliable good category), (4) the ability of students is low as 0.12 means that the HOTS students are low.
Kata Kunci: HOTS; IRT; Rasch Model; Analysis; Winstep Software
INTRODUCTION
Physics is the science that is the basis of science and the basis for all disciplines. Genetic engineering and technology also make physics the basis for its development (Young and Freedman, 2012: 1). Physics is a science that consists of concepts. These concepts are learned by students during lecture activities. However, students still experience weak thinking skills (HOTS). One of the abilities that must be possessed in the 21st century is HOTS (Trilling
& Fadel, 2009). HOTS means students' thinking ability who is able to apply the knowledge and skills that have been developed and use them to
solve new problems through concepts that have been taught. HOTS consists of several aspects including analysis, evaluation and creation (Brookhart, 2010).
Higher Order Thinking Skills (HOTS) are high-level thinking skills that consist of the ability to analyze, evaluate and create. Thinking skills according to Bloom are divided into two levels, namely Lower Order Thinking Skills and Higher Order Thinking Skills. Lower Order Thinking Skills (LOTS) consist of knowledge, understanding and application while HOTS consists of analysis, synthesis and evaluation (Schraw et al, 2011: 191). HOTS is needed to study physics, especially in problem solving
(Received: October-2018; Reviewed: November-2018;; Accepted: December-2018; Published: December-2018)
activities related to physics concepts.
In this research, HOTS will be tested to find out HOTS's description of physics education students, especially in wave and optics. Through this research, it is expected to be a foundation for overcoming HOTS's problem in solving problems related to physical concepts both during lectures and in daily life.
The purpose of this study was to determine the description of HOTS students in Singkawang STKIP on wave and optical material using Rasch model analysis.
The urgency of this study is the ability to think of students who are still in the Lower Order Thinking Skills (LOTS) level to be a concern because it becomes an obstacle for students in understanding the physics material taught by the teacher. Some of the supporting knowledge related to HOTS is as follows:
Ramos et al. (2013) also found that there was a relationship between Higher Order Thinking Skills (HOTS) of students and academic achievement in physics subjects where physics problem solving skills were part of HOTS. Yee Mei Heong, et al. (2011: 121-122) found a positive relationship between the level of high- level thinking skills and academic results. Ya- Ting & Carolyn (2015) also conducted a study that relates to the increase in HOTS of students by using a digital game approach in vocational schools which found that 68% of students who have HOTS below the average ability can increase by being given the media in the form of digital games. HOTS 'capacity building efforts have also been carried out Richland & Simms (2015) using analogy to improve HOTS students who show that the key to developing HOTS in mathematics, science and history is conceptually connected learning. Simon (2015) conducted a study to improve HOTS students with virtual laboratories which showed that media could increase by 60% HOTS of students. Kapler et al (2015) examined class simulations in the long semester to increase HOTS of students who showed effective class simulation programs to increase HOTS. Kuldas et al (2014) examined the importance of students in Malaysia to increase HOTS, fight risk factors and academic demonstrations found that the background of students greatly influenced their ability to solve cognitive tasks. Harrison. N. (2013) investigated the use of interactive whiteboards to improve the ability of HOTS of Teachers. The effort to increase HOTS in science has also been carried out by Hugerat & Kortam (2014) examining the
increase of HOTS through science and inquiry approaches, finding that on average 82% of HOTS students' abilities increased.
METHOD
This research will be conducted for 12 months starting from January 2018 until December 2018. Research and data collection will be carried out in Singkawang STKIP, Singkawang Utara District, Singkawang City, West Kalimantan. This research is quantitative descriptive. Descriptive research aims to get HOTS students in Singkawang STKIP by using Rasch Modle Analysis Population in this research which is all students of STKIP Singkawang Physics Education study program.
Sampling in this research will be done by intact group. Intact group is to choose a sample based on the group as a whole (Sutrisno, Kresnadi, Kartono, 2007: 4.24). Data collection tool in the form of HOTS evaluation test to find out HOTS in the form of multiple choice reasoned. Rasch analysis model with Winstep software helps researchers to know the description of the answer to the problem well
RESULT AND DISCUSSION
In this study HOTS description uses the Rasch software (software) winsteps version 3.73. The description of HOTS in this study uses Rasch modeling in the form of political data.
Political data is data processing with a compound score pattern, meaning that some questions have a different maximum score number (Sumintono & Widhiarso, 2015: 89).
The advantages of Rasch modeling compared to other methods, especially classical test theory is the ability to predict the missing date, make measurements using a logit scale, can predict bias and unbiased data, and can find out the distribution of students. The HOTS description using the Rasch model can be described as follows:
Analysis of Question Points
The items that will be analyzed include the difficulty level analysis of the items, the suitability of the items (the distinguishing power of the items) and the items that are biased. The analysis used uses the RASCH Model with the help of the Winstep application. The example of the difficulty level analysis of the item can be
seen in the picture below:
Figure 1.Output of the difficulty level of the item In the total count column, read the numbers 19 and 20, where the number 20 means all participants answer the question (item E5), while the other items indicate that there is one missing data (the total number of students is 20, so the number of students is 19 ) The table above lists the level of difficulty from the highest (E1) to the lowest (E6), which is shown in the Measure column.
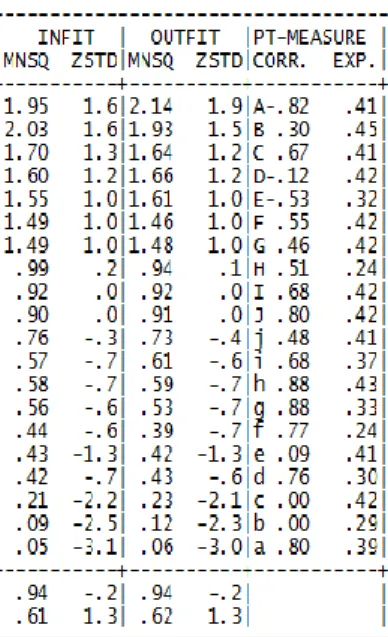
Suitability Level Item. The level of difficulty of the item is the conformity quality of the item with the model, or the item fit (item fit) abbreviated. A fit item explains whether the item is functioning normally or not. If you find a problem that is not fit, it is an indication that there is a misconception among students about the item. For example, analysis of the suitability level of item questions can be explained in the figure below:
The table above shows that the item fit indicator for all items, Means Square Outfit (0.5
<MNSQ <1.5), Z-Standard Outfit (-2.0 <ZSTD
<+ 2.0) and Point Measure Correlation (0.4 <Pt Measure Corr <0.85), does not indicate any problems. In other words, all the questions given can be well understood by students, there are no misconceptions. Seen in the table above that item E1, which contains one criterion that is not fit, namely the Infit Mean Square value which is greater than the value of 1.5.
Detection of the Bias Problem Item. A valid measurement, one measure is an instrument and the items used do not contain bias. An instrument or item is called a bias if it is found that one individual with certain characteristics is more advantageous than an individual with other characteristics. For example, items that are more easily answered by
male students than women, which shows the existence of gender bias items. In Rasch modeling to detect this bias is called DIF detection (differntial item functioning or differential grain function). A question item is said to contain bias if the probability value of the item is below 5% (0.05). To find out whether there are items that are biased towards the origin of the domicile (ie in the second column of this politomi file), then use DIF with the specification $ S2W1. The sample analysis using the $ S2W1 specification is shown as follows:
Figure 2. Output of detection of bias problems The picture above clearly shows that each item does not contain any DIF, where the probability value of all items above 5% (0.05).
In addition to the table, the DIF detection curve can also be used to analyze the following items:
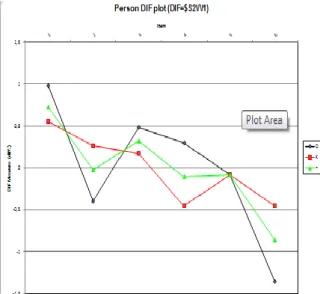
Figure 3. Detection of the problem of bias using a graph
In the picture above there are three curves
based on the domicile origin of the students, namely D (village), K (city), and * (star) indicating the average value. In the graph above, it can be seen that compared to students from the domicile origin of the city (K), students from the village (D) find that the curves in the questions E1, E3, and E4 are relatively more difficult.
However, for items E2 and E6, students who are domiciled in des are more able to work on this problem than those who live in the city. For item E5, both characteristics of students have the same ability in doing this problem. From the difficulty level of the problem, the curve in the picture shows that the E1 item is the most difficult (close to the top), followed by the E3 question; while the item that is considered the easiest is E6 (curve approaching down).
Ability Analysis of Students. Ability analysis is used to identify which learners are indeed high level of ability, learners have different response patterns (for example, those who are not careful), as well as students who are identified as collaborating (cheating).
Individual Ability Level
The level of ability of students can be shown in the following figure:
Figure 4. Output level of individual ability The measure column states the level of ability in logit units. In the table above, the highest ability is owned by LD02 (measure =
+2.56 logit) to the lowest ability that is owned by LD09 (measure = -2.42 logit). If the logit value is the same, this shows the same raw score and the same ability. However, to be able to determine which students have the highest can be known through the scalogram. The scalogram sequences the level of difficulty of the item systematically. Through the scalogram will be seen which students have high ability even though they have the same logit value. The same thing is to detect if students find that they do not have a suitable response pattern according to the ideal model.
Individual Compliance Level
In order to bring up this compliance table, the following picture will appear in sequence of learners who have a non-fit criteria are as follows:
Figure 5. Output of Individual Suitability Level In the picture above there are some individuals who have an inappropriate response pattern, in this case the criteria for fit item indicators, namely Means Square Outfit (0.5
<MNSQ <1.5), Z-standard Outfit (-2.0 <ZSTD
<+2.0) and Point Measure Correlation (0.4 <Pt Measure Corr <0.85), indicating some problems.
For example, LK14 students do not meet two criteria (mnsq outfit is more than 1.5 and measure corr points with negative values), the same thing is also found for PK06 and LK08 students.
In the lower part of the table there are also three students who meet the misfit criteria, namely LD10 and LK13 students who do not
meet the three conditions of conformity with the model, and LD07 students who do not meet the criteria for Outfit Means Square and Z-standard Outfit. To find out more why the above students are not fit with the ideal model, we use a scalogram. The level of ability of students using the scalogram can be shown in the following figure:
Figure 6. Output level of suitability of individuals using a scalogram In the picture above it is found that the LK08 students and LK14 cannot do the problem correctly easily, but the difficult category can be solved properly. In LK13 and LD10 students, it seems that their ability can still be improved so they can get the maximum score. This is because they basically have the ability to do questions but are not complete in their completion.
Reliability Test
The reliability test that will be carried out in this study shows the level of reliability of something. Reliable means with regard to the degree of consistency / constancy of data at certain time intervals (Sugiyono, 2014: 3).
Reliability tests on research and development are reliability of HOTS evaluation test items.
According to Sumintono & Widhiarso (2015:
85) the criteria used to determine the Cronbach Alpha Value (measuring reliability, namely the interaction between the person and the items as a whole are as follows:
Figure 7. Reliability test output
It can be seen that the reliability value of students is 0.78 and the item is 0.71, this shows that the problem has good reliability so it is able to measure what it wants to measure
CONCLUSIONS
Based on Rasch analysis using Winsteps Software is known to HOTS description of students, namely: (1) HOTS students at the highest ability are owned by LD02 (measure = +2.56 logit) to the lowest ability that is owned by LD09 (measure = -2 , 42) with a standard level of difficulty of the problem with a logit value of 0.48 (2) most students experience difficulties when formulating physical equations and the calculation process (3) analyzing is the ability that is most dominated by students with logit values in a row followed by -0.71 and -0.67 followed by the ability to create with logit values of -0.12 and -0.02, respectively, the ability to evaluate with logit values of 0.00, 0.95 and 0.82. and for reliability person 0.78 and the item is 0.71, this shows that the problem has good reliability so it is able to measure what it wants to measure
REFERENCE
Brookhart, S. M. 2010. How to assess higher order thinking skills in your class-room.
Alexandria: ASCD.
Trilling, B & Fadel, C. 2009. 21st Century skills.
San Fransisco: John Wiley & Sons, Inc.
Yee Mei Heong, Othman, W. binti, Md Yunos, J.
bin, et al. 2011. The level of marzano higher order thinking skills among technical education students. International Journal of Social Science and Humanity, 1, 121-125.
Young, D. H., & Freedman, A. R. University Physics with Modern Physics, 13th. San Frasisco: Pearson Education.
Sutrisno, Leo, Hery Kresnadi dan Kartono. 2007.
Pengembangan Pembelajaran IPA SD.
Jakarta: PJJ S1 PGSD.
Sugiyono. 2011. Metode Penelitian Pendidikan.
Bandung: Alfabeta.
Sumintono & Widhiarso. 2015. Aplikasi Pemodelan RASCH Pada Assesment Pendidikan. Surya, Yohanes. (2010). Bahan Ajar Persiapan Menuju Olimpiade Sains Nasional/Internasional Getaran dan Gelombang.
Ya-Ting & Carolyn Yang. (2015). Virtual ceos: A blended approach to digital gaming for enhanching higher order thinking and academic achievement among vocational high school students [Versi elektronik].
ScienceDirect: Computer and Education, 81, 281-295.
Ramos et al. (2013). Higher order thinking skillss and academic performance in physics of college students: A regression analysis[Versi elektronik]. International Journal of Innovative Interdisciplinary Research, 4, 48-60.
Richland, L. E& Simms, N.(2015). Analogy, higher order thinking and education [Versi elektronik]. WIREs Cognitive Science, 6, 177-192.
N. Simon. (2015). Improving Higher-Order Thinking Skillss Using Virtual and Simulated Science Laboratory Experiments[Versi elektronik]. Springer:
New Trends In Networking, computing, E- Learnig, Systems Science, And enginerring, 312, 187-192.
Kuldas, S. et al. (2014). Malaysian adolescent students' needs for enhancing thinking skillss, counteracting risk factors and demonstrating academic resilience [Versi elektronik]. International Journal of Adolescence and Youth, 20, 32–47.
Hugerat, M& Kortam, N. (2014). Improving Higher Order Thinking Skills among freshmen by Teaching Science through Inquiry[Versi elektronik]. Eurasia Journal of Mathematics, Science & Technology Education, 10, 447-454.
I.V Kapler et al. (2015). Spacing in a simulated undergraduate classroom:long-term benefits for factual and higher-level learning [Versi elektronik]. ScienceDirect: Learning and Instruction, 36, 38-45.