1
Biological dose summation of intensity-modulated arc therapy and image-guided high- 1
dose-rate interstitial brachytherapy in intermediate and high risk prostate cancer 2
Georgina Fröhlich, Ph.D.a,b, Péter Ágoston, Ph.D.a,c, Kliton Jorgo, M.D.a,c, Csaba Polgár, 3
D.Sc.a,c , Tibor Major, D.Sc.a,c 4
a. National Institute of Oncology, Centre of Radiotherapy, Ráth György Street 7-9, H- 5
1122 Budapest 6
b. Eötvös Loránd University, Faculty of Science, Pázmány Péter mall 1/A, H-1117 7
Budapest 8
c. Semmelweis University, Faculty of Medicine, Department of Oncology, Ráth György 9
Street 7-9, H-1122 Budapest 10
Corresponding author: Georgina Fröhlich, National Institute of Oncology, Centre of 11
Radiotherapy, Ráth György Street 7-9, H-1122 Budapest, Tel: +36-1-224-8600, Fax: +36- 12
1-224-8620, E-mail: frohlich.georgina@gmail.com 13
Biological dose summation of prostate tele- and brachytherapy 14
2 Abstract 15
Objective: To validate an alternative method for summing the biologically effective doses of 16
intensity-modulated arc therapy (IMAT) with interstitial HDR brachytherapy (BT) or IMAT 17
boost in prostate cancer and compare it to the recent Uniform Dose Conception (UDC) 18
method.
19
Methods: Initially 15 IMAT plus interstitial HDR BT plans of patients with intermediate- and 20
high-risk prostate cancer were included and additional plans of IMAT plus IMAT boost were 21
created. The prescribed dose was 2/44 Gy for the whole pelvis, 2/60 Gy for the prostate and 22
vesicle seminals and 1x10 Gy for the prostate gland in BT boost or 2/18 Gy for the prostate 23
PTV in IMAT boost. CT set of teletherapy was registered with the US of BT, and the most 24
exposed volume of critical organs in BT were identified on these CT images. The minimal 25
dose of this volumes was calculated in IMAT plans and summed with the dose from BT using 26
the linear-quadratic radiobiological model. Biological total doses (EQD) were calculated and 27
compared between plans with BT and IMAT boost. This method was compared with uniform 28
dose conception (UDC) in IMAT plus BT boost plans.
29
Results: D90 of the prostate was significantly higher with BT than with IMAT boost: 99.3 Gy 30
vs. 77.9 Gy, p=0.0034. The dose to rectum and hips were significantly lower with BT boost, 31
D2 were 50.3 Gy vs. 76.8 Gy (p=0.0117) and 41.9 Gy vs. 50.6 Gy (p=0.0044), respectively.
32
The dose to bladder showed the same trend, D2 were 73.1 Gy vs. 78.3 Gy in BT vs. IMAT 33
plans, dose to urethra was significantly higher with BT boost, D0.1 was 96.1 Gy vs. 79.3 Gy 34
(p=0.0180) using BT vs. IMAT boost technique. UDC overestimates D2 of rectum by 37%
35
(p=0.0117) and underestimates D0.1 of urethra by 1% (p=0.0277) and D2 of bladder by 7%
36
(p=0.0614).
37
3
Conclusions: Based on our biological dose summation method, total dose of the prostate is 38
higher using BT boost, than the IMAT. BT boost yields lower rectum, bladder and hip doses, 39
but higher dose to urethra. UDC overestimates rectum dose and underestimates the dose to 40
urethra and bladder.
41
Keywords: prostate cancer; dose summation; integrated biological doses; intensity-modulated 42
arc therapy; interstitial brachytherapy 43
44 45
4 Introduction
46
The standard of care in the curative treatment of intermediate- and high-risk prostate cancer is 47
external beam radiotherapy (teletherapy, TT) and high-dose-rate (HDR) interstitial 48
brachytherapy (BT) boost with androgen deprivation therapy. Since the α/β value of prostate 49
tumour is low, dose escalation has an essential role in the development of both radiotherapy 50
modalities [1,2]. The more complex the techniques, the more they are capable escalating the 51
dose to the tumour, while sparing the organs at risk (OARs). The state-of-the-art radiotherapy 52
combination is intensity-modulated arc therapy (IMAT) and image-guided interstitial BT 53
[3,4]. These complex treatments require reliable reporting of the dose received by tumour and 54
the critical structures.
55
The use of BT boost has been linked with improved biochemical-progression-free and 56
overall survival [5,6]. What is more, modern HDR BT approach results in improved quality of 57
life, as a consequence of lower acute urinary and rectal toxicity [7], with the dose coverage of 58
the target volume (D90, the minimum dose delivered to 90% of the prostate) correlating with 59
local tumour control [8], and dose of the OARs with normal tissue toxicity [9].
60
To achieve reporting these dose-volume parameters properly, overall volumetric doses 61
have to be properly integrated from tele- and brachytherapy. As simple physical dose 62
summation does not take into consideration the different biological effects, the equivalent 63
dose given in 2 Gy fractions (EQD2) has to be calculated [10,11]. The dose distribution of the 64
TT is assumed to be completely uniform in the target volume and OARs (Uniform Dose 65
Conception, UDC) [12]. However, in the IMAT technique the most exposed 2 ccm of the 66
OARs is not a compact volume, since its voxels are dispersed in the organ, as we have shown 67
earlier [13]. It was also shown that the most exposed part of the OARs in the integrated plans 68
is located in the same region that receives the largest dose in BT. Nevertheless, this 2 ccm 69
5
volume is not in the same location, as the most exposed part in TT [14]. So simple DVH 70
addition sums the dose of two different 2 ccm volumes.
71
In the majority of previous investigations authors did not take into account the real 72
biological dose of the prostate and the OARs in TT in combined TT and BT treatment.
73
Pinkawa et al. [15] used the above mentioned UDC method to estimate the doses from TT and 74
engaged physical BT doses only. Andrzejewski et al. [16] compared different advanced 75
radiotherapy methods for boosting dominant intraprostatic lesion. They calculated biological 76
equivalent doses for comparison but did not examine combined therapies. Kikuchi et al. [17]
77
made a CT series after BT and calculated the biological effective dose of the rectum in TT 78
and BT. They associated this dose to the pixels of the rectum volume and computed a 79
summarised dose-volume histogram (DVH) of TT and BT based on this. This was a better 80
estimation of the rectal dose, than the UDC method, but they could not take into consideration 81
the quadratic behaviour of the biological dose. This biological dose has to be calculated pixel- 82
by-pixel in the same organ, but currently in none of the treatment planning systems this 83
feature is available. The image registration of the TT CT and the CT after BT treatment does 84
not use the dose values from the real BT plan. The dose gradient is high in BT, so the dose 85
distribution can be significantly different in a post-BT plan without the needles and the US 86
probe than in the live plan. Using doses of the live plan, where the needles is in their real 87
place, is the most adequate method.
88
We have developed an alternative dose summation method in combined radiotherapy 89
of cervical cancer [14]. The aim of the present study is to validate an alternative method for 90
summing the biologically effective doses of IMAT with interstitial HDR BT or IMAT boost 91
in prostate cancer and compare it to the recent UDC method.
92
6 Materials and methods
93
At our institute, fifteen IMAT plus interstitial HDR BT plans of patients with intermediate- 94
and high-risk prostate cancer were included for this study. Selection criteria were the 95
following: PSA>10 ng/mL and/or GS 7-10 and/or Stage T2b-T3b. The TT was performed in 96
supine position, the patients were immobilized with knee and ankle support system. The 97
prescribed dose was 2/44 Gy for the whole pelvis, 2/60 Gy for the prostate and the vesicle 98
seminals and was delivered with an energy of 10 MV using 2 full arcs. Based on our local 99
IGRT protocol, CBCT verification was made from 1st to 3rd fractions, the systematic error was 100
calculated and corrected before the 4th fraction, then weekly verification was done for patient 101
positioning. TT was complemented with transrectal US-guided interstitial HDR BT boost, 102
performed after the 4 weeks TT course, given 1 fraction of 10 Gy [18]. After scanning the 103
prostate with US, a virtual preimplant plan was generated (Oncentra Prostate v3.1, Elekta 104
Brachytherapy, Veendendaal, The Netherlands). HIPO optimization method was used, and the 105
prescribed dose was 10 Gy to the whole prostate gland (V100≥95%). Based on this plan, 106
metal needles were inserted into the prostate through a template under live US guidance. The 107
optimization procedure was used again for calculating the dwell times in the inserted needles 108
to achieve the final dose distribution. The detailed description of our treatment method can be 109
found in our previous publications [19,20]. The total treatment time of TT and BT was 7 110
weeks (44-54 days). In clinical routine, the EUD method was used to determine the dose 111
constraints for prostate and OARs in BT implant and their total doses.
112
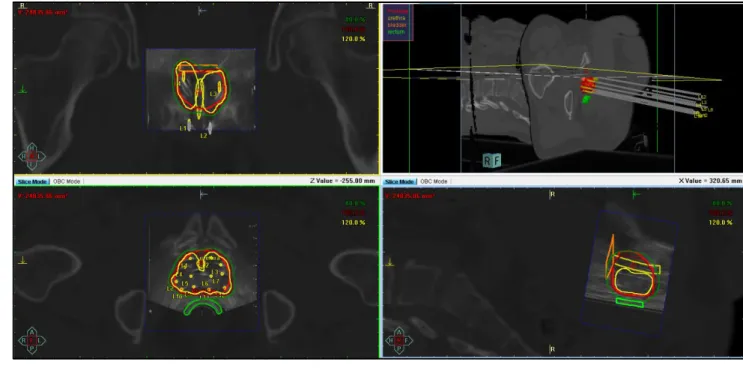
First, the treatment planning CT for TT was registered with the US set of BT in BT 113
treatment planning system in every case (Figure 1), then the TT CT with the BT plan was 114
imported to the TT planning system (Eclipse v13.7, Varian Medical Systems, Palo Alto, 115
USA).
116
7
Then, the localisation of the most exposed part of the OARs was investigated in the sum 117
of TT and BT plans. The most exposed part of hips (femoral heads) is always the nearest 118
volume to the prostate and the dose contribution from BT is practically zero. So, the most 119
exposed 0.1 and 2 ccm of hips were calculated only from the TT plan. The most exposed part 120
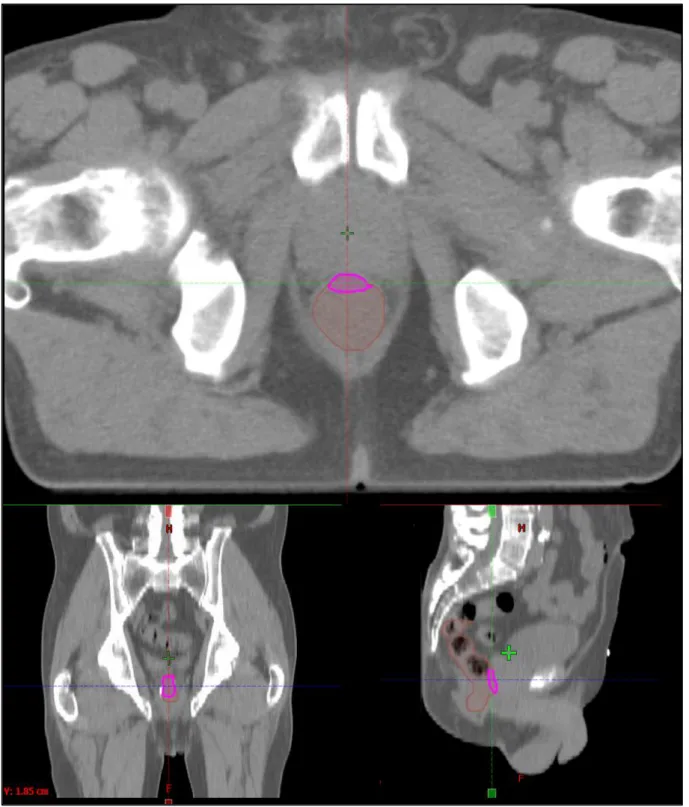
of the rectum, urethra and bladder is in the region where the dose maximum is in BT. So, the 121
most exposed 0.1 and 2 ccm from BT were determined in the TT CTs, and the intersection of 122
this volumes and the given organ was created (Figure 2). The minimal dose of this 123
intersection was calculated in TT plans and summed with the dose of this volumes from BT 124
using the linear-quadratic radiobiological model. The α/β of prostate tumour was assumed 1.5 125
Gy, while for OARs 3 Gy was used. The following dose-volume parameters were used for 126
quantitative evaluation of the plans:
127
D90: the minimum dose delivered to 90% of prostate (Gy);
128
D0.1(x): the minimal dose of the most exposed 0.1 ccm of the critical organ x (Gy), 129
where x: rectum, urethra, bladder or hips.
130
D2(x): the minimal dose of the most exposed 2 ccm of the critical organ x (Gy), 131
where x: rectum, bladder or hips.
132
To patients, whom BT is not accomplishable, TT boost is performed with additional 18 133
Gy in 2 Gy fractions for the prostate gland using safety margins of 0.5 cm, if gold markers are 134
implanted into the prostate, and 0.8 cm, if not [21,22]. For comparison, additional TT boost 135
plans were created for every patient in the study with the same IMAT technique, and total 136
EQD2 doses of the most exposed volume of the organs at risks were calculated in these 3-step 137
TT plans.
138
Wilcoxon-matched pairs test was used (Statistica 12.5, StatSoft, Tulsa, OK, USA) to 139
compare biological total dose of the combination of TT and BT or TT boost in the treatment 140
8
of prostate tumour. The comparison of our biological dose summation (BDS) and the 141
conventional UDC method was also performed with this statistical test.
142
Results 143
The mean volume of the prostate was 29.8 ccm (21.1-43.0 ccm). We found that EQD2 D90 of 144
the prostate was 99.3 Gy (96.8-101.9 Gy) using two-step TT and BT boost. The D0.1 and D2 of 145
rectum were 62.8 Gy (41.0-75.6 Gy) and 50.3 Gy (29.8-65.8 Gy). The D0.1 of urethra was 146
96.1 Gy (95.5-96.9 Gy), the volume of it was less than 2 ccm in our cases. The D0.1 and D2 of 147
bladder were 85.8 Gy (62.5-169.8 Gy) and 73.1Gy (46.0-140.5 Gy). The D0.1 and D2 of hips 148
were 49.6 Gy (39.8-67.3 Gy) and 41.9 Gy (33.5-58.3 Gy).
149
In TT boost, the volume of the PTV is larger than the prostate, it was 111.7 ccm on 150
average (range: 71.9-179.5 ccm). In comparison of BT and TT boost techniques, D90 of the 151
prostate was significantly higher with BT than with TT: 99.3 Gy vs. 77.9 Gy, p=0.0034. The 152
dose to rectum and hips were significantly lower with BT boost, D2 was 50.3 Gy vs. 76.8 Gy 153
(p=0.0117) and 41.9 Gy vs. 50.6 Gy (p=0.0044), respectively. The difference between the 154
dose to bladder in the case of BT and TT boost showed the same trend, D2 was 73.1 Gy vs.
155
78.3 Gy in BT vs. TT plans, but this difference was not significant. Nevertheless, the dose to 156
urethra was significantly higher with BT boost, D0.1 was 96.1 Gy vs. 79.3 Gy (p=0.0180) 157
using BT vs. TT boost technique (Figure 3). The detailed results can be found in Table 1.
158
Comparing our dose summation method to the conventional UDC in the case of 159
combined TT with BT boost, we found that the UDC overestimates D2 of rectum by 37% and 160
underestimates D0.1 of urethra by 1%. The D2 of bladder was also 7% smaller using UDC, but 161
this difference was not significant because of the large standard deviation of this variable 162
(Table 2).
163
9 Discussion
164
Dose escalation has a fundamental role in the radiotherapy of intermediate- and high-risk 165
prostate cancer [1,2]. Presently there are no better alternatives of BT boost, however, several 166
high-tech teletherapy techniques are possible competitors, such as image-guided and 167
intensity-modulated teletherapy, arc therapy, helical tomotherapy and stereotactic 168
radiotherapy with linear accelerators or CyberKnife [3,7,16].
169
Vanneste et al. [1] have pointed out the strong correlation between overall survival and 170
D90 of the prostate target volume in localised prostate cancer, with the best results being 171
achievable above 75.6 Gy EQD2. Different treatment techniques lead to the same cure rate 172
but with different toxicity pattern. The EQD2 prescribed dose to the prostate with our 173
fractionation scheme is 92.9 Gy using BT and 78 Gy with TT boost. At the same time dose to 174
the OARs is reduced with BT [3,4]. In our study, using IMAT TT with HDR BT boost could 175
be dose of all OARs kept in a good tolerance level. The EQD2 D90 of the prostate was 99.3 176
Gy, while D2 of rectum was 50.3 Gy, approximately the half of the prostate dose. D0.1 dose to 177
the urethra was 96.1 Gy on average, less than the prostate dose, in spite of that urethra is 178
inside the prostate. D2 dose to the bladder was 73.1 Gy, while for hips it was only 41.9 Gy.
179
All dose to the hips originates from 60 Gy of TT, BT does not contribute to it.
180
Notwithstanding, in TT larger target volume is used than BT, the total dose to the 181
prostate is 22% (21.4 Gy) less, D90 was 99.3 Gy using BT and 77.9 Gy with TT boost. D2
182
dose to the rectum, bladder and hips were 35% (26.5 Gy), 7% (5.2 Gy) and 18% (8.7 Gy) 183
smaller with BT, than using TT boost. 18 Gy IMAT boost to the prostate target volume 184
instead of BT means extra 9 Gy dose to the hips. Only the dose to the urethra was higher with 185
BT boost, D0.1 was 18% (16.8 Gy) higher than using TT boost.
186
In previous publications authors used the recommended UDC method to estimate the 187
total dose of the prostate and OARs in combined therapy [15]. However, they did not take 188
10
into account the real biological doses. Kikuchi et al. [17] tried a better estimation of the rectal 189
dose, than the UDC method, but they used a CT after removing the needles and the US probe 190
instead of a postimplant CT or a live US imaging in the intraoperative BT plan and they did 191
not take into account the quadratic behaviour of the biological dose. Since the most exposed 192
part of the rectum, urethra and bladder is in the region where the dose maximum is in BT, this 193
most exposed 2 ccm can be used for the calculation of the total biological dose. In this small 194
volume, the quadratic dependence is negligible. Thus, our dose summation method is simple, 195
timesaving and there is no interobserver variation. The only more precise method would be a 196
pixel-by-pixel calculation of the biological dose in the same organ after a deformable 197
registration of BT and TT images, but no treatment planning systems provides this possibility 198
at the moment.
199
The effect of the dose summation technique on dose-volume parameters in combined 200
TT and BT was also investigated in our study. The EQD2 D90 of the prostate was practically 201
equal in our BDS and the conventional UDC method, but UDC overestimates the dose to 202
rectum by 37% (18.6 Gy) and underestimates the dose to urethra by 1% (0.7 Gy) and dose to 203
bladder by 7% (4.9 Gy) compared to BDS method. Besides this, the potential advantage of the 204
BDS method is that it takes into account the most exposed part of the OARs and thus sparing 205
these parts from higher doses in TT, as is shown in Figure 4. On the whole, the dose to the 206
OARs can be reduced using our alternative dose summation method.
207
This study is the starting point of the development of an algorithm for the summation 208
of TT and BT biologically effective doses, which uses an artificial-intelligence-based DIR 209
algorithm to match the critical anatomical structures in the two radiotherapy modalities.
210
Further investigations are needed to assess whether our method predicts toxicity better than 211
the recent UDC method.
212
11 Conclusions
213
Based on our biological dose summation method in IMAT with interstitial HDR BT or IMAT 214
boost treatment in prostate cancer, total dose of the prostate is higher using BT boost, than the 215
IMAT. BT boost results lower rectum, bladder and hip doses, but higher dose to the urethra.
216
UDC overestimates rectum dose and underestimates the dose to the urethra and to the bladder.
217
Conflict of Interest statement:
218
GF: This paper was supported by the János Bolyai Research Scholarship of the Hungarian 219
Academy of Sciences and the ÚNKP-18-4 New National Excellence Program of the Ministry 220
of Human Capacities.
221
All other authors: The authors report no proprietary or commercial interest in any product 222
mentioned or concept discussed in this article.
223
Contributions:
224
GF: worked out the concept, did the analysis and wrote this paper.
225
PÁ: made the contouring and discussed the details of this study.
226
KJ: made the contouring.
227
CsP: supported the study.
228
TM: supported the study and discussed the details.
229
12 References
230
1. Vanneste BG, Van Limbergen EJ, van Lin EN, van Roermund JG, Lambin P. Prostate 231
Cancer Radiation Therapy: What Do Clinicians Have to Know? Biomed Res Int.
232
2016;2016:6829875. doi: 10.1155/2016/6829875.
233
2. Kuban DA, Tucker SL, Dong YL, Starkschall ZG, Huang EH, Cheung R, Lee AK, 234
Pollack A. Long-term results of the M. D. Anderson randomized dose-escalation trial 235
for prostate cancer. Int J Radiat Oncol Biol Phys. 2008;70(1):67–74.
236
3. Georg D, Hopfgartner J, Gòra J, Kuess P, Kragl G, Berger D, Hegazy N, Goldner G, 237
Georg P. Dosimetric considerations to determine the optimal technique for localized 238
prostate cancer among external photon, proton, or carbon-ion therapy and high-dose- 239
rate or low-dose-rate brachytherapy. Int J Radiat Oncol Biol Phys. 2014;188(3):715- 240
22. doi: 10.1016/j.ijrobp.2013.11.241.
241
4. Yang R, Zhao N, Liao A, Wang H, Qu A. Dosimetric and radiobiological comparison 242
of volumetric modulated arc therapy, high-dose rate brachytherapy, and low-dose rate 243
permanent seeds implant for localized prostate cancer. Med Dosim. 2016;41(3):236- 244
41. doi: 10.1016/j.meddos.2016.06.002.
245
5. Kee DLC, Gal J, Falk AT, Schiappa R, Chand ME, Gautier M, Doyen J, Hannoun- 246
Levi JM. Brachytherapy versus external beam radiotherapy boost for prostate cancer:
247
Systematic review with meta-analysis of randomized trials. Cancer Treat Rev.
248
2018;70:265-271. doi: 10.1016/j.ctrv.2018.10.004.
249
6. Fu-Min F, Yu-Ming W, Chong-Jong W, Hsuan-Ying H, Po-Hui C. Comparison of the 250
Outcome and Morbidity for Localized or Locally Advanced Prostate Cancer Treated 251
by High-dose-rate Brachytherapy Plus External Beam Radiotherapy (EBRT) Versus 252
EBRT Alone. Jpn J Clin Oncol 2008;38(7)474–479. doi:10.1093/jjco/hyn056 253
13
7. Morgan TM, Press RH, Cutrell PK, Zhang C, Chen Z, Rahnema S, Sanda M, Pattaras 254
J, Patel PR, Jani AB, Rossi PJ. Brachytherapy for localized prostate cancer in the 255
modern era: a comparison of patient-reported quality of life outcomes among different 256
techniques. J Contemp Brachytherapy. 2018;10(6):495-502. doi:
257
10.5114/jcb.2018.81024.
258
8. Ash D, Al-Qaisieh B, Bottomley D, Carey B, Joseph J. The correlation between D90 259
and outcome for I-125 seed implant monotherapy for localised prostate cancer.
260
Radiother Oncol. 2006;79(2):185-9.
261
9. Murakami N, Itami J, Okuma K, Marino H, Nakagawa K, Ban T, Nakazato M, Kanai 262
K, Naoi K, Fuse M. Urethral dose and increment of international prostate symptom 263
score (IPSS) in transperineal permanent interstitial implant (TPI) of prostate cancer.
264
Strahlenther Onkol. 2008;184(10):515-9. doi: 10.1007/s00066-008-1833-3.
265
10. Fowler JF. The linear-quadratic formula on progress in fractionated radiotherapy. Br J 266
Radiol 1989;62:679-694.
267
11. Nag S, Gupta N. A simple method of obtaining equivalent doses for use in HDR 268
brachytherapy. Int J Radial Oncol Biol Phys. 2000;46:507-513.
269
12. Niemierko A. Reporting and analyzing dose distributions: a concept of equivalent 270
uniform dose. Med Phys. 1997;24(1):103-10.
271
13. Fröhlich G, Lang S, Berger D et al. Spatial relationship of the 3D dose distribution 272
from brachytherapy and external beam therapy for adding both dose plans in patients 273
with cervix cancer. Brachytherapy 2008;7(2):95 274
14. Fröhlich G, Vízkeleti J, Nguyen Anhhong N, Major T, Polgár Cs. Comparative 275
analysis of image-guided adaptive interstitial brachytherapy and intensity-modulated 276
arc therapy versus conventional treatment techniques in cervix cancer using biological 277
dose summation. J Contemp Brachyther, 2018;11(1):1–7.
278
14
15. Pinkawa M, Fischedick K, Treusacherr P, Asadpour B, Gagel B, Piroth MD, Borchers 279
H, Jakse G, Eble M. Dose-volume impact in high-dose-rate Iridium-192 280
brachytherapy as a boost to external beam radiotherapy for localized prostate cancer- a 281
phase II study. Radiother Oncol. 2006;78:41-46.
282
16. Andrzejewski P, Kuess P, Knäusl B, Pinker K, Georg P, Knoth J, Berger D, Kirisits C, 283
Goldner G, Helbich T, Pötter R, Georg D. Feasibility of dominant intraprostatic lesion 284
boosting using advanced photon-, proton- or brachytherapy. Radiother Oncol.
285
2015;117(3):509-14. doi: 10.1016/j.radonc.2015.07.028.
286
17. Kikuchi K, Nakamura R, Tanji S, Yamaguchi S, Kakuhara H, Yabuuchi T, Inatsu W, 287
Oikawa H, Ariga H. Three-dimensional summation of rectal doses in brachytherapy 288
combined with external beam radiotherapy for prostate cancer. Radiother Oncol.
289
2013;107(2):159-64. doi: 10.1016/j.radonc.2013.03.003.
290
18. Kovács Gy, Pötter R, Loch T, Hammer J, Kolkman-Deurloo IK, de la Rosette JJ, 291
Bertermann H. GEC/ESTRO-EAU recommendations on temporary brachytherapy 292
using stepping sources for localised prostate cancer. Radiother Oncol. 2005;74:137- 293
148.
294
19. Fröhlich G, Ágoston P, Lövey J et al. Dosimetric evaluation of high-dose-rate 295
interstitial brachytherapy boost treatments for localized prostate cancer. Strahlenther 296
Onkol, 2010;186(7): 388-395.
297
20. Ágoston P, Major T, Fröhlich G, Szabó Z, Lövey J, Fodor J, Kásler M, Polgár Cs.
298
Moderate dose escalation with single-fraction high-dose-rate brachytherapy boost for 299
clinically localized intermediate- and high-risk prostate cancer: 5-year outcome of the 300
first 100 consecutively treated patients. Brachytherapy. 2011;10:376-384.
301
21. Boehmer D, Maingon P, Poortmans P, Baron MH, Miralbell R, Remouchamps V, 302
Scrase C, Bossi A, Bolla M; EORTC radiation oncology group. Guidelines for 303
15
primary radiotherapy of patients with prostate cancer. Radiother Oncol.
304
2006;79(3):259-69.
305
22. Lawton CA, Michalski J, El-Naqa I, Buyyounouski MK, Lee WR, Menard C, O'Meara 306
E, Rosenthal SA, Ritter M, Seider M. RTOG GU Radiation oncology specialists reach 307
consensus on pelvic lymph node volumes for high-risk prostate cancer. Int J Radiat 308
Oncol Biol Phys. 2009;74(2):383-387. doi: 10.1016/j.ijrobp.2008.08.002.
309 310
16 Tables:
311
EQD2 TT + BT boost TT + TT boost *p-value
D90 (Gy) 99.3 (96.8-101.9) 77.9 (76.4-78.5) 0.0034 D2(rectum) (Gy) 50.3 (29.8-65.8) 76.8 (65.8-79.3) 0.0017 D0.1(urethra) (Gy) 96.1 (95.5-96.9) 79.3 (78.6-80.4) 0.0180 D2(bladder) (Gy) 73.1 (46.0-140.5) 78.3 (77.2-79.8) 0.1614 D2(hips) (Gy) 41.9 (33.5-58.3) 50.6 (43.6-58.1) 0.0044 Table 1. The EQD2 total doses of intensity-modulated arc therapy plus interstitial HDR 312
BT boost (TT + BT boost) and intensity-modulated arc therapy plus teletherapy boost 313
(TT + TT boost). D90: the minimum dose delivered to 90% of prostate (Gy), D2(rectum), 314
D2(bladder), D2(hips): the minimal dose of the most exposed 2 ccm of rectum, bladder 315
and hips (Gy), D0.1(urethra): the minimal dose of the most exposed 0.1 ccm of urethra 316
(Gy). *Wilcoxon-matched pairs test.
317 318
EQD2 BDS UDC *p-value
D90 (Gy) 99.3 (96.8-101.9) 100.2 (96.6-104.8) 1.0000 D2(rectum) (Gy) 50.3 (29.8-65.8) 68.9 (66.6-70.9) 0.0117 D0.1(urethra) (Gy) 96.1 (95.5-96.9) 95.4 (94.4-96.0) 0.0277 D2(bladder) (Gy) 73.1 (46.0-140.5) 68.2 (62.9-74.0) 0.0614 Table 2. The EQD2 total doses of intensity-modulated arc therapy plus interstitial HDR 319
BT boost calculated by our biological dose summation (BDS) and the uniform dose 320
conception (UDC) method. D90: the minimum dose delivered to 90% of prostate (Gy), 321
17
D2(rectum), D2(bladder): the minimal dose of the most exposed 2 ccm of rectum and 322
bladder (Gy), D0.1(urethra): the minimal dose of the most exposed 0.1 ccm of urethra 323
(Gy). *Wilcoxon-matched pairs test.
324 325
18 Figures:
326
327
Figure 1. The BT treatment plan on the registered TT CT and BT US sets. Top left: a 328
coronal view, top right: 3D reconstruction, bottom left: an axial view, bottom right: a 329
sagittal view. Thick red: prostate, thick green: rectum, thick yellow: urethra, thick 330
orange: bladder, green, red and yellow line: the 80%, 100% and 120% isodose line.
331
19 332
Figure 2. The most exposed 2 ccm part (pink) of the rectum (brown) in an axial (up), in 333
a coronal (left) and in a sagittal (right) slice of the TT CT.
334
20 335
Figure 3. The EQD2 total doses of intensity-modulated arc therapy plus interstitial HDR 336
BT boost (BT) and intensity-modulated arc therapy plus teletherapy boost (TT). D90:
337
the minimum dose delivered to 90% of prostate (Gy), D2(rectum), D2(bladder), D2(hips):
338
the minimal dose of the most exposed 2 ccm of rectum, bladder and hips (Gy), 339
D0.1(urethra): the minimal dose of the most exposed 0.1 ccm of urethra (Gy).
340
21 341
Figure 4. The most exposed 2 ccm of rectum is indicated with brown, the urethra and 342
the bladder are contoured with yellow and orange and the prostate gland is shown with 343
red (colorwash) in an axial (left) and a sagittal (right) CT slice in a two-step intensity- 344
modulated arc therapy plan. Isodose lines: red: 60 Gy, yellow: 57 Gy, blue: 44 Gy and 345
green: 41.8 Gy.
346