Does inverse planning improve plan quality
in interstitial high-dose-rate breast brachytherapy?
Prof. Tibor Major, PhD, DSc
1,2, Georgina Fröhlich, PhD
1,3, Norbert Mészáros, MD
1,2, Viktor Smanykó, MD
1, Prof. Csaba Polgár, MD, PhD, DSc
1,21Radiotherapy Centre, National Institute of Oncology, Budapest, Hungary, 2Department of Oncology, Semmelweis University, Budapest, Hungary, 3Eötvös Loránd University, Faculty of Science, Budapest, Hungary
Abstract
Purpose: To investigate the effect of input parameters for an inverse optimization algorithm, and dosimetrically evaluate and compare clinical treatment plans made by inverse and forward planning in high-dose-rate interstitial breast implants.
Material and methods: By using a representative breast implant, input parameters responsible for target coverage and dose homogeneity were changed step-by-step, and their optimal values were determined. Then, effects of param- eters on dosimetry of normal tissue and organs at risk were investigated. The role of dwell time modulation restriction was also studied. With optimal input parameters, treatment plans of forty-two patients were re-calculated using an inverse optimization algorithm (HIPO). Then, a pair-wise comparison between forward and inverse plans was per- formed using dose-volume parameters.
Results: To find a compromise between target coverage and dose homogeneity, we recommend using weight factors in the range of 70-90 for minimum dose, and in the range of 10-30 for maximum dose. Maximum dose value of 120% with a weight factor of 5 is recommended for normal tissue. Dose constraints for organs at risk did not play an important role, and the dwell time gradient restriction had only minor effect on target dosimetry. In clinical treatment plans, at identical target coverage, the inverse planning significantly increased the dose conformality (COIN, 0.75 vs.
0.69, p < 0.0001) and improved the homogeneity (DNR, 0.35 vs. 0.39, p = 0.0027), as compared to forward planning. All dosimetric parameters for non-target breast, ipsilateral lung, ribs, and heart were significantly better with inverse plan- ning. The most exposed small volumes for skin were less in HIPO plans, but without statistical significance. Volume irradiated by 5% was 173.5 cm3 in forward and 167.7 cm3 in inverse plans (p = 0.0247).
Conclusions: By using appropriate input parameters, inverse planning can provide dosimetrically superior dose distributions over forward planning in interstitial breast implants.
J Contemp Brachytherapy 2020; 12, 2: 166–174 DOI: https://doi.org/10.5114/jcb.2020.94584 Key words: inverse planning, high-dose-rate, interstitial breast implants.
Purpose
Inverse planning algorithms have been routinely used in external beam therapy for intensity and volume mod- ulated radiotherapy for several years, but in brachyther- apy (BT), it cannot be considered as a standard planning method yet. In BT, the classical dosimetry systems played an important role in standardizing the treatments and were developed for low-dose-rate (LDR) sources. How- ever, the introduction of high-dose-rate (HDR) stepping source technique opened new possibilities in clinical do- simetry. Furthermore, the introduction of cross-sectional imaging and 3D target volume definition in BT required new planning approaches. Forward optimization is now regularly used for BT planning, and the most accepted methods are the geometrical (GO) and graphical optimi-
zations (GRO), which can provide clinically acceptable dose distributions for breast implants [1,2,3,4]. During GO, there is no need for defining dose points, because dwell positions themselves serve as reference dose points for optimization. After GO, the dwell time at any dwell position is inversely proportional to the dose delivered by other dwell positions, resulting in homogeneous dose distribution. If the catheters geometrically cover the tar- get volume properly, the planning target volume (PTV) is encompassed by the reference isodose surface. In case of possible geometrical miss of the catheters, an underdosed region can develop in the PTV, which can be decreased using the GRO. With the drag-and-drop method, an iso- dose line can be shifted into a desired position on the CT image with the cursor on the screen. However, it must Address for correspondence: Prof. Tibor Major, PhD, DSc, National Institute of Oncology, Radiotherapy
Centre, 7-9 Rath Gy. u. 1122 Budapest, Hungary, phone: +36 1 224 8600/3277, fax: +36 1 224 8620,
e-mail: major@oncol.hu
Received: 21.01.2020 Accepted: 12.03.2020 Published: 30.04.2020
be remembered that with improving target coverage, the dose homogeneity deteriorates. In BT, the coverage is generally characterized by the V100 (percentage of PTV receiving at least 100% of the prescribed dose [PD]), while the dose homogeneity is considered as the DNR (dose non-uniformity ratio). The latter is the ratio of volumes irradiated by 1.5 times the PD and the PD. To make an optimal plan, many steps must be occasionally repeated during the planning process, with continuous evaluation of the dose-volume histogram (DVH) parameters. Since the target coverage and dose homogeneity always change in the opposite direction, there is a big challenge for the planner to meet both conditions with a compromise.
This requires repetitive dose calculations, which can be time-consuming. On the contrary, during inverse optimi- zation, all dosimetric requirements (dose coverage, dose homogeneity, organs at risk [OARs] protection) are simul- taneously and automatically considered. Inverse optimi- zation always requires cross-sectional imaging, since it is anatomy-based, and the 3D volume definitions are its pre- conditions. The two most frequently used algorithms in BT are the HIPO (hybrid inverse planning optimization) [5] and IPSA (inverse planning simulated annealing) [6].
In BT, apart from prostate cancer, the integration of inverse planning into clinical routine has not been accom- plished so far. In the literature, there are reports on the use of inverse planning for cervix cancer [7,8,9,10,11,12,13], vaginal irradiation [14,15], and head and neck brachyther- apy [16,17]. For breast cancer, the available information is scarce. Among partial breast irradiation techniques, interstitial brachytherapy has the longest patients’ fol- low-up and the highest level of evidence as an alternative treatment option to whole breast irradiation [18,19,20].
Based on our experience with forward planning in breast BT, in this work, we performed a detailed investigation about the feasibility of inverse planning in interstitial HDR breast implants and compared its efficacy with con- ventional forward planning regarding target dosimetry and protection of OARs.
Material and methods
First, a representative case was selected to investigate the effect of optimization parameters on target dosimetry during inverse optimization. The Oncentra Brachy v.4.5.3 planning system (Elekta Brachytherapy, Veenendaal, The Netherlands) was used for both forward and inverse opti- mizations. The HIPO implemented in Oncentra Brachy is based on dose-volume parameters defined as minimum (MinValue) and maximum (MaxValue) dose limits for tar- gets [5,21], and for OARs, only maximum dose limits are considered. Based on these dose limits, HIPO calculates a corresponding objective function, and with an impor- tance factor or penalty (MinWeight, MaxWeight) defined by the user, HIPO calculates the total objective function, which is then considered for the optimization. The total ob- jective function is subsequently calculated as the weighted sum (aggregation) of all individual objective functions.
The results of optimization are the source dwell times.
Using HIPO, the effects of different weight factors and dwell time modulation on target dosimetry were in-
vestigated in detail and subsequently, their optimal val- ues were defined. As a first step, the minimum weight (MinWeight) was changed between 0 and 100 in steps of 10, and its effect on V100 and DNR was calculated at various dose homogeneity. Then, the maximum weight (MaxWeight) was changed between 0 and 100 in steps of 10, and V100 and DNR were calculated at different target coverage. Afterwards, the optimization on normal tissue and OARs was studied. For normal tissue, the role of maximum dose value and its weight were examined. The objectives used for an OAR situated close to and far from the PTV (skin and rib, respectively) were also changed, and subsequent target dosimetry was assessed. The tar- get volume was adjacent to skin and a few cm away from the rib.
HIPO includes an option for modulating dwell times in neighboring dwell positions, which is called dwell time gradient restriction (DTGR). The DTGR parameter takes value between 0.0 and 1.0. At value of 0.0, there is no restriction, and large fluctuations between neighboring dwell times can develop. When maximal value is applied (DTGR = 1.0), the resulting distribution of dwell times in catheters will be smooth, similar to GO. The effect of modulation of neighboring dwell times on target cover- age and dose homogeneity in HIPO was also investigat- ed. The parameter of DTGR was changed between 0.0 to 1.0 in steps of 0.1, and V100 and DNR were calculated.
In the second part of the study, treatment plans of for- ty-two patients with early stage breast cancer who were treated with accelerated partial breast irradiation using multicatheter interstitial brachytherapy were selected.
The patient selection and target volume definition were based on the GEC-ESTRO recommendations [22,23]. Us- ing the optimal input parameters determined in the first part of our study, competing treatment plans were made with HIPO, and they were compared with the original forward plans.
Implantation and forward planning
Our implantation technique was based on two CT imaging. The first one was used for planning the posi- tion of catheters, and then the treatment planning was completed by a second imaging performed after the im- plantation. First, lumpectomy cavity, PTV, and organs at risk were delineated and then, the catheters were reconstructed using the CT information. After that, the source dwell positions were activated inside the PTV with 0 margin, and geometrical optimization was per- formed. Basal dose points were created in the central plane and after normalization, an isodose line was se- lected for dose prescription, so that the target coverage be at least 90%. The f-factor used for dose prescription ranged between 0.75 and 0.90, corresponding to isod- ose level of 75% and 90%. At the same time, a proper dose homogeneity had to be maintained with the DNR
≤ 0.35. At conflicting values, the target volume coverage was prioritized. In case when the target coverage was not sufficient, graphical optimization was applied to improve the dose distribution locally in the underdosed regions. The prescribed dose (PD) was 7 × 4.3 Gy. This
method is called conventional or forward planning, and referred as GO + GRO. The catheters were implanted into the breast in a triangular pattern, with a separation of 1.3 cm. The source step size was 2.5 mm, the first/last source position in the catheters was always at least 5 mm from the skin surface. The resolution of calculation ma- trix was 1 mm.
Inverse planning
Retrospectively, for each patient, a plan with inverse optimization (HIPO) was made using the same CT im- ages and contours used in forward planning. The input parameters in HIPO that were used included: for PTV – MinWeight = 75, MinValue = 100, MaxWeight = 25, and MaxValue = 150, and for normal tissue – MaxWeight
= 5 and MaxValue = 120. Normal tissue, which is always mandatory for the optimization, is considered as all tis- sues surrounding the PTV, excluding any other OARs.
For other OARs, no objectives were applied here. The MinValue and MaxValue were related to the PD as per- centages. The value for DTGR parameter was selected to be 0.2. The active source positions were inside the PTV, similarly to GO + GRO.
Competing plans were assessed and compared with dose-volume parameters, such as relative volumes receiv- ing a percentage of PD (e.g., V100, V90, V50) and relative doses in percentage of the PD to small absolute volumes (e.g., D0.1cm3, D1cm3). Since the skin and ribs were not de- lineated as whole organs, the V5 for skin and the V50 for ribs were given as absolute value in cm3. The dose ho- mogeneity was described by the DNR (dose non-unifor- mity ratio) and the conformality with COIN (conformity index). The COIN simultaneously considers the coverage of PTV and irradiation of normal tissues outside the PTV by the PD [24]. Descriptive statistics were used to char- acterize the two groups of treatment plans, and the dis- tribution of parameters was tested with Shapiro-Wilk’s W test regarding normality. Since most of the parameters were not normally distributed, non-parametric Wilcoxon
matched-pairs test was used for all comparisons with Sta- tistica 7.0 software (StatSoft, Inc., Tulsa, OK, USA), and p < 0.05 was considered statistically significant.
Results
A representative patient with a PTV of 34 cm3 and im- planted with 12 catheters was selected to study the effect of optimization parameters in HIPO.
Target coverage and dose homogeneity
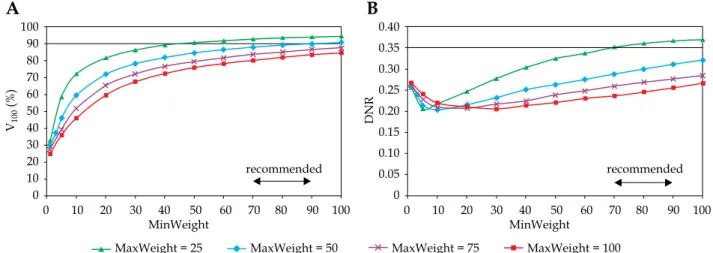
In Figure 1, the target coverage and dose homogeneity are presented in the function of minimum weight at dif- ferent homogeneity parameters. As the minimum weight increased, the V100 continuously improved. The larger the MinWeight, the higher the V100 (Figure 1A). Furthermore, the maximal coverage developed when the constraint for dose homogeneity was weak (MaxWeight = 25). When the homogeneity was the greatest (MaxWeight = 100), the coverage was less than 80%. The dependence of DNR on MinWeight was not monotonous (Figure 1B). As the MinWeight increased, the DNR decreased first and then slowly increased. The lowest DNR was around 0.20 but developed at different MinWeight depending on the MaxWeight. Based on the graphs in Figure 1A, the value for minimum weight in the range of 70-90 seemed to be an acceptable compromise between the target coverage and the dose homogeneity.
Looking at the changes of V100 and DNR in the func- tion of dose homogeneity parameter (MaxWeight), an explicit dependence was observed. Putting emphasis on the importance of dose homogeneity both the V100 and the DNR decreased (Figure 2). The DNR was the low- est at MinWeight = 25 (Figure 2B), but the coverage was not acceptable at MaxWeight higher than 10. The V100 was greatly influenced by the MinWeight and the Max- Weight, which is shown in Figure 2A. Only low values of MaxWeight resulted in adequate coverage (V100 ≥ 90%), but the DNR was high at MaxWeight below 10. A range
Fig. 1. Dependence of target coverage (A) and dose homogeneity (B) on the weight factor for minimum dose (MinWeight) at the periphery of PTV. The horizontal line shows the planning aim and the double-headed arrow indicates the range of recom- mended values. V100 is the percentage of PTV receiving the prescribed dose, DNR is the dose non-uniformity ratio. MaxWeight is a weight factor controlling the dose homogeneity in the PTV
V100 (%) DNR
100 90 80 70 60 50 40 30 20 10 0
0.40 0.35 0.30 0.25 0.20 0.15 0.10 0.05 0
A B
0 10 20 30 40 50 60 70 80 90 100
MinWeight 0 10 20 30 40 50 60 70 80 90 100
MinWeight
recommended recommended
MaxWeight = 25 MaxWeight = 50 MaxWeight = 75 MaxWeight = 100
between 10-30 was a compromise again between the tar- get coverage and the dose homogeneity.
Normal tissue
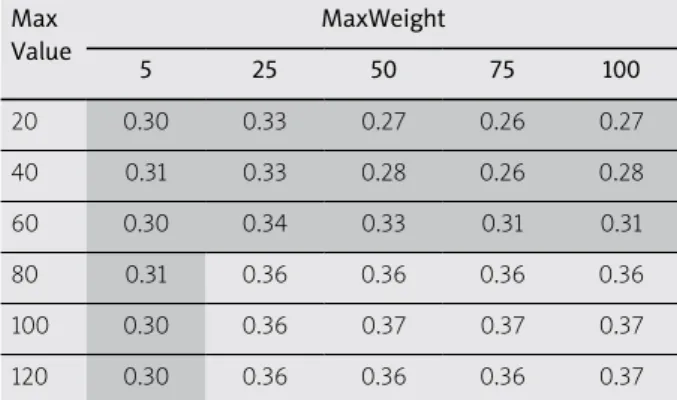
The normal tissue surrounded the PTV and it was always obligatory to use objectives for it. Table 1 shows how the two input parameters (MaxValue, MaxWeight) affect the target coverage characterized by the V100. The shaded area included the coverage higher than 90%. At low weight factor (MaxWeight = 5), the V100 was always larger than 90% independently on the maximal dose val- ue (MaxValue). If the allowed dose maximum was 120%, the weight factor did not influence the coverage, since the V100 was between 91.7% and 92.7%. The dose homo- geneity also depended on MaxValue and MaxWeight of normal tissue (Table 2). In the shaded area, the DNR was less than 0.35. If the MaxValue was relatively low (≤ 60%) homogeneous dose distribution developed at any weight factor (DNR < 0.35). When using a low weight factor for maximum dose (MaxWeight = 5), the DNR was always low (0.30-0.31) and it did not depend on the maximum dose value. Summarizing the results shown in Tables 1
and 2, the MaxValue = 120 with MaxWeight = 5 as an ob- jective for normal tissue seemed to be the right selection for input parameters in inverse planning.
Organs at risk
With proper normal tissue dosimetry, the dose to OARs can be kept low. If an OAR was not used directly during dose optimization, it would be a part of normal tissue and the dose objectives to normal tissue would im- plicitly apply to that as well. For example, if the target is superficially located and the PTV touches the skin defined as a 5 mm layer from body surface, the dose objective set up for normal tissue will govern the skin dosimetry. This is demonstrated in Table 3, since the coverage was nearly identical at all weight factors and change of the DNR was also very small. When the maximum dose to skin was in- creased from 40% to 120% at maximum weight factor (MaxWeigh = 100), the coverage improved slightly and the homogeneity marginally deteriorated, but the change of V100 and DNR was less than 1% (Table 4). In this anal- ysis, we used MaxValue = 120 and MaxWeight = 5 for normal tissue.
Fig. 2. Dependence of target coverage (A) and dose homogeneity (B) on the weight factor for maximum dose (MaxWeight) in the PTV. The horizontal line shows the planning aim and the double-headed arrow indicates the range of recommended values.
V100 is the percentage of the PTV receiving the prescribed dose, DNR is the dose non-uniformity ratio. MinWeight is a weight factor controlling the target coverage through minimum dose at the periphery of the PTV
V100 (%) DNR
100 90 80 70 60 50 40 30 20 10 0
0.60 0.50 0.40 0.30 0.20 0.10 0
A B
0 10 20 30 40 50 60 70 80 90 100
MaxWeight 0 10 20 30 40 50 60 70 80 90 100
MaxWeight
recommended recommended
MinWeight = 25 MinWeight = 50 MinWeight = 75 MinWeight = 100
Table 1. Effect of MaxValue and MaxWeight parameters of normal tissue on V100 (%) Max
Value
MaxWeight
5 25 50 75 100
20 90.6 82.1 65.2 46.6 28.3
40 90.6 82.2 67.1 54.6 47.3
60 90.8 84.8 77.6 72.0 68.3
80 91.6 89.4 86.3 84.1 82.7
100 92.1 91.7 90.8 89.9 89.4
120 92.7 92.7 92.2 92.0 91.7
V100 – percentage of the PTV receiving the prescribed dose
Table 2. Effect of MaxValue and MaxWeight parameters of normal tissue on DNR Max
Value
MaxWeight
5 25 50 75 100
20 0.30 0.33 0.27 0.26 0.27
40 0.31 0.33 0.28 0.26 0.28
60 0.30 0.34 0.33 0.31 0.31
80 0.31 0.36 0.36 0.36 0.36
100 0.30 0.36 0.37 0.37 0.37
120 0.30 0.36 0.36 0.36 0.37
DNR – dose non-uniformity ratio
Dwell time gradient restriction (DTGR)
Table 5 shows the effects of DTGR on target coverage and dose homogeneity. When no constraint was used for neighboring dwell times (DTGR = 0.0), the DNR was the lowest (0.341) and the V100 the highest (93.7). From the data, it can be observed that in the function of DTGR, the variation of both parameters was small, less than 1% for the V100 and less than 5% for the DNR.
Patient dosimetry
The mean volume of lumpectomy cavity and PTV was 10.7 cm3 (range, 3.5-37.0 cm3) and 56.7 cm3 (range, 26.6- 173.6 cm3), respectively. Twenty-seven patients (64%) had left-sided and fifteen (36%) right-sided lesion. In sev- en cases (17%), the PTV was close to and in eight cases (19%) far from the skin. Median 13 catheters were im- planted into the breast, with a range between 7 and 28.
Table 6 includes dosimetric parameters for treatment plans made by forward (GO + GRO) and inverse (HIPO) planning for forty-two patients. The basis of comparison was the same target coverage. Both, the mean V100 and D90 were nearly identical for the two groups. But the con- formality and the homogeneity was also better with the inverse planning. The mean COIN increased from 0.69 to 0.75 (p < 0.0001) and the DNR decreased from 0.39 to 0.35 (p < 0.0027). The volume irradiated by the PD was sig- nificantly smaller in the inverse plans (63.6 cm3 vs. 67.5 cm3, p < 0.0001). The non-target breast (ipsilateral breast excluding the PTV) received significantly less dose in the HIPO plans, and the same applied for the ipsilateral lung.
The mean lung dose (MLD) was 8% less in HIPO and in the other three parameters (D0.1cm3, D1cm3, V5), there was a 5% decrease as well. Although, the doses to the most exposed 0.1 cm3 and 1 cm3 of skin were less with inverse planning, the difference was not significant. But the abso- lute volume irradiated by low-dose (5%) was 5.8 cm3 less with HIPO (p < 0.0001). Regarding the dose to ribs, the HIPO was superior with significant less doses (D0.1cm3, D1cm3), and the volume irradiated by half of the PD (V50) was also less compared to forward planning (1.7% vs.
1.8%, p = 0.0247). We noted that the reference isodose line never reached the ribs in any HIPO plan meaning that the maximum dose was always less than the PD, and in for- ward plans, we observed only one case out of forty-two patients where volume of 0.1 cm3 received the PD. Twen- ty-seven patients had left-sided cancer, and looking at the heart dosimetry, the superiority of inverse over forward planning could be seen. The mean heart dose was 8% less, and in HIPO plans, we observed not only lower doses to most exposed small volumes (0.1 cm3, 1 cm3), but also smaller volumes irradiated by low-dose (5%). The amount of decrease in heart parameters ranged between 8-12%, with always statistical significance. The dose to contralat- eral breast and lung was always small, with no significant differences between the two planning techniques.
Discussion
Inverse planning has been intensively used in exter- nal beam radiotherapy at least for a decade to optimize Table 3. Effect of weight factor of maximum dose
to skin on target coverage and dose homogene- ity (MaxValue = 120)
MaxWeight V100 DNR
0.001 92.66 0.300
1 92.66 0.302
10 92.67 0.304
20 92.59 0.300
40 92.54 0.303
60 92.54 0.303
80 92.53 0.307
100 92.55 0.308
V100 – percentage of the PTV receiving the prescribed dose, DNR – dose non-uni- formity ratio
Table 4. Effect of maximum dose to skin on tar- get coverage and dose homogeneity (MaxWeight
= 100)
MaxValue V100 DNR
40 91.67 0.304
60 92.16 0.304
80 92.49 0.305
100 92.55 0.306
120 92.55 0.307
V100 – percentage of the PTV receiving the prescribed dose, DNR – dose non-uni- formity ratio
Table 5. Effect of dwell time gradient restriction (DTGR) on target coverage and dose homogeneity
DTGR V100 DNR
0.0 93.7 0.341
0.1 93.4 0.354
0.2 93.3 0.358
0.3 93.1 0.355
0.4 93.2 0.354
0.5 93.2 0.354
0.6 93.2 0.353
0.7 93.2 0.356
0.8 93.2 0.355
0.9 93.2 0.357
1.0 93.2 0.359
V100 – percentage of the PTV receiving the prescribed dose, DNR – dose non-uni- formity ratio
the dose distribution for state-of-the-art dose delivery techniques, such as intensity modulated radiation ther- apy and volume modulated arc therapy. However, in brachytherapy, it is still not routinely used for various treatment sites, except for the prostate. In clinical prac- tice in both LDR and HDR prostate BT, optimal positions of radioactive sources are determined with inverse plan- ning for no less than two decades, considering surface and volumetric dose constraints in addition to dose limits to urethra and rectum [6,21,25,26,27,28,29,30,31]. The role of inverse planning in gynecological BT is also studied in the literature. Trnková et al. [7] analyzed the feasibility of inverse planning algorithm (HIPO) for image-guided cer-
vical cancer brachytherapy. Ten patients treated with in- tracavitary and another ten with combined intracavitary/
interstitial techniques were planned with manual and in- verse optimization. They found that HIPO was feasible for improving the therapeutic ratio and limiting the sub- stantial high-dose regions around the needles; therefore, it was introduced into their clinical practice. The same group made a comparison between manual and inverse plans in HDR intracavitary/interstitial cervical cancer brachytherapy using data of 20 patients [8]. They found that HIPO produced clinically acceptable treatment plans and enabled the reduction of high-dose regions in the immediate vicinity of the target volume. Compared to Table 6. Comparison of patient dosimetry between treatment plans made by forward (GO + GRO) and inverse (HIPO) optimization techniques for 42 patients with mean ± standard deviation
GO + GRO HIPO Difference# P-value
PTV
V100 (%) 91.2 ±2.43 91.4 ±2.48 0.2 0.9111
D90 (%) 101.6 ±4.89 102.0 ±4.21 0.4 0.2914
COIN 0.69 ±0.06 0.75 ±0.07 0.06 < 0.0001
Implant
DNR 0.39 ±0.07 0.35 ±0.05 –0.04 0.0027
Non-target breast
V100 (%) 2.2 ±1.77 1.5 ±0.94 –0.7 < 0.0001
V50 (%) 13.0 ±8.46 12.0 ±7.65 –1.0 < 0.0001
V25 (%) 32.0 ±15.22 30.5 ±14.56 –1.5 < 0.0001
Ipsilateral lung
MLD (%) 5.3 ±2.18 4.9 ±1.63 –0.4 < 0.0001
D0.1cm3 (%) 42.9 ±13.99 40.6 ±12.98 –2.3 < 0.0001
D1cm3 (%) 37.7 ±12.61 35.7 ±11.78 –2.0 < 0.0001
V5 (%) 31.9 ±10.29 30.3 ±10.11 –1.6 < 0.0001
Skin
D0.1cm3 (%) 76.1 ±30.03 73.8 ±30.39 –2.3 0.1027
D1cm3 (%) 59.1 ±19.82 57.5 ±19.65 –1.6 0.1633
V5 (cm3) 173.5 ±47.65 167.7 ±45.75 –5.8 < 0.0001
Ribs
D0.1cm3 (%) 56.6 ±19.21 52.1 ±18.82 –4.5 < 0.0001
D1cm3 (%) 44.8 ±16.73 41.7 ±16.76 –3.1 < 0.0001
V50 (cm3) 1.8 ±2.87 1.7 ±3.15 –0.1 0.0247
Heart*
MHD (%) 3.9 ±1.79 3.6 ±1.75 –0.3 < 0.0001
D0.1cm3 (%) 22.0 ±11.86 19.4 ±11.14 –2.6 0.0016
D1cm3 (%) 18.2 ±10.06 16.6 ±9.77 –1.6 0.0002
V5 (%) 25.8 ±17.89 23.7 ±17.95 –2.1 0.0008
Contralateral breast
D0.1cm3 (%) 4.3 ±2.9 3.8 ±2.55 –0.5 0.5165
D1cm3 (%) 2.9 ±1.79 2.6 ±1.68 –0.3 0.1976
Contralateral lung
D0.1cm3 (%) 4.9 ±2.81 5.2 ±2.72 0.3 0.3131
D1cm3 (%) 3.5 ±1.82 3.5 ±1.92 0.0 0.9739
GO – geometrical optimization, GRO – graphical optimization, HIPO – hybrid inverse planning optimization; *only for left-sided lesions (27 patients),
#HIPO – (GO + GRO)
IPSA, HIPO considered the current clinical experience gained from manual treatment planning. Other authors also found inverse planning feasible for cervical cancer BT [9,10,11,12,31]. Inverse planning can offer good spar- ing of critical structures without compromising the target coverage [9]. Moreover, IPSA significantly reduces over- all treatment planning time with improved reduction of doses to the OARs, as compared with a volume-based op- timization treatment planning method [12]. Matias et al.
[11] provided a fine class solution of HIPO, demonstrating comparable results in relation to graphical optimization regarding both dosimetric and radiobiological endpoints.
Kannan et al. [10] found that IPSA significantly improved the target volume coverage compared with manual plan- ning. Inverse planning in vaginal BT performed with multichannel applicator was also studied, and its dosi- metric advantages were demonstrated using planning data in two studies with twelve patients in both investi- gations [14,15]. For other sites, information about inverse planning in BT is sparsely available. In a case study with two patients, Jameson et al. [16] presented the usefulness of IPSA for head and neck BT, and Choi et al. [17] com- pared two inverse algorithms (IPSA, HIPO) in interstitial tongue HDR-BT of 20 patients. Regarding breast cancer, two inverse planning algorithms (IPSA, HIPO) were compared for 20 patients treated with BT boost using rig- id needles [32]. With IPSA algorithm, the dose to OARs was less, but the target coverage and conformality was better with HIPO. In a recent paper, simulated annealing optimization was demonstrated for permanent breast im- plant treatment planning [33]. Treatment plans produced manually and with inverse planning of a 10-patient co- hort were dosimetrically compared. Although in target coverage and dose to skin, no difference was found, a sta- tistical difference was observed in reduction of volume irradiated by the 1.5 times the PD and in increase of con- formity index in favor of inverse planning.
To the best of our knowledge, in interstitial HDR breast BT, detailed investigation of the input parameters of inverse optimization algorithms on dosimetry has not been performed. In our study, using HIPO, we firstly analyzed the effect of weight factors on target dose pa- rameters accountable for target coverage (MinWeight), and dose homogeneity (MaxWeight) on quality of dose distributions in a breast implant. We clearly showed that these two factors played against each other. In order to find an acceptable compromise between the coverage and the homogeneity, we changed those weight factors step- by-step and subsequently determined a recommended range of their values. Dosimetric constraints for normal tissues surrounding the PTV had an influence on both the coverage and the homogeneity. To investigate this phe- nomenon, we changed the maximum dose (MaxValue between 20-120%) and its weight (MaxWeight between 5-100) to normal tissue and calculated the V100 and the DNR. According to data in Table 1, the weight factor has a role only when the prescribed maximum dose in normal tissue is low (≤ 100%). If the MaxValue is 120, the V100 is always larger than 90%, independently on the weight fac- tor. At low maximum doses (MaxValue ≤ 60%), the dose distribution is always homogeneous with low DNR, and
the weight factor does not have a big effect (Table 2). But, at low weight factor (MaxWeight = 5), the DNR is prac- tically the same (0.30-0.31) at any maximum dose value.
The skin is considered as one of the most important OARs in breast BT. Similarly, to normal tissue, a maxi- mum dose and its weight factor are the input parame- ters for skin dosimetry in inverse planning. Logically, with these two parameters, the dose to skin can be sim- ply controlled. But, at the same time, the target coverage and the dose homogeneity are changing as well. If the skin is far from the PTV, there is no reason to use dose constraints, since it always receives relatively low dose.
However, when the PTV is in close proximity to the skin, dose objectives in order to decrease the maximum dose can be applied. It is evident that the smaller the distance between the skin and PTV, the higher the maximum dose to skin. We investigated the role of input parameters of optimization for skin when the PTV is in contact with skin. Tables 3 and 4 demonstrate how the V100 and DNR are affected by the values of MaxWeight and MaxValue.
Summarizing the results obtained with optimization of dose to skin, we can state that, basically, there is no effect of dose objectives for skin on the target coverage and the dose homogeneity. The explanation can be that the opti- mization objectives for normal tissue are strong enough to control the dose distribution outside the PTV. In fact, if it is not outlined separately, the skin is a part of normal tissue and if similar dose constraints are used as for the normal tissue, their effects will be minimal. Considering that the positions of the ribs related to the PTV can be very similar to the skin (far from or close to it), the con- clusions drawn for skin dosimetry are valid for the ribs as well. We recommend using optimization parameters for any OAR only in a special case, when the maximum dose has to be kept below a certain level. Nevertheless, it must not be forgotten that dose to any OAR cannot be reduced unless the dose delivered to the PTV is decreased.
The classical dosimetry systems are based on LDR sources. With the stepping source technique, those sys- tems can be simulated using uniform source dwell times [2,3,34]. However, after any optimization technique, the dwell times will be non-uniform, occasionally with large fluctuation. The dwell time gradient restriction in HDR stepping source dosimetry was introduced to avoid large dwell time differences in adjacent source dwell po- sitions [35]. The role of controlling neighboring dwell times in quality of treatment plan is controversial. In a recent study, a negative correlation was found between modulation restriction, and both HR-CTV D90 and V100 in cervix BT as well as an increasing restriction, negatively affected the conformity index [36]. According to the re- sults of Mavroidis et al. [37], dwell time regularization technique in HIPO introduced a minor improvement in the effectiveness of the optimized prostate HDR dose dis- tributions. Balvert et al. [38] also investigated the role of dwell time modulation restrictions for HDR prostate BT and found that the use of restriction did not necessarily improve the treatment plan quality. In another study, an increase of dwell time deviation constraint yielded a few percent decrease in target coverage and a slight increase in V150 in HDR prostate implants using IPSA [39]. The lat-
ter is in agreement with our results shown in Table 5. The most homogeneous dose distribution develops when no restriction is used for the gradient, and the DNR is con- tinuously increasing with stronger restriction. However, the difference between the extreme DNR values is only 5%, while the value of V100 practically does not change.
Although our detailed investigation about the role of input parameters on plan quality in inverse planning was performed only in one selected case, the results were validated in a relatively large patient cohort of forty-two cases. Our data showed that inverse planning performs better than forward planning regarding dosimetric pa- rameters of target and OARs. In interstitial breast im- plants, a large number of dwell positions are in the tar- get volume, which probably contributes to the efficacy of optimization algorithm. In other treatment sites such as cervix or head and neck, much less dwell positions are used, and the advantages of inverse planning may not be so evident. Though quantitative data about planning time was not given here, we noted that inverse planning requires considerably less amount of time than forward planning. This is another point for implementing inverse planning in clinical practice.
Conclusions
Prerequisite for effective use of inverse planning al- gorithm in interstitial breast BT is the determination of proper input parameters for optimization. Having found those presets, the optimization procedure is fast and practically always resulting in more superior dose distribution, when compared with forward planning.
This statement was verified by comparing the data of patients’ dosimetry obtained by the two optimization methods. Our results clearly show that inverse planning is superior to forward planning, since at the same target coverage, all dosimetric parameters for any OAR, except only for contralateral lung, were more favorable with in- verse planning, and in most cases, the differences were statistical significant. Furthermore, more homogeneous and more conformal dose distributions developed after inverse planning. Based on our results, the introduction of inverse planning into routine clinical practice is recom- mended in interstitial HDR breast brachytherapy.
Acknowledgements
Financial support from the 2019 Thematic Excellence Program (TUDFO/51757/2019-ITM) is greatly acknowl- edged.
Disclosure
The authors report no conflict of interest.
References
1. Major T, Polgár C, Lövey K et al. Dosimetric characteristics of accelerated partial breast irradiation with CT image-based multicatheter interstitial brachytherapy: A single institu- tion’s experience. Brachytherapy 2011; 10: 421-426.
2. Wiercinska J, Wronczewska A, Kabacinska R et al. Transition from Paris dosimetry system to 3D image-guided planning
in interstitial breast brachytherapy. J Contemp Brachytherapy 2015; 7: 479-484.
3. Major T, Polgár C. Treatment planning for multicatheter in- terstitial brachytherapy of breast cancer – from Paris system to anatomy-based inverse planning. J Contemp Brachytherapy 2017; 9: 89-98.
4. Demianovich A, Sanin D, Martynova V et al. Experience in multicatheter interstitial high-dose-rate breast brachythera- py: dose-volume histogram analysis of the first results. J Con- temp Brachytherapy 2019; 11: 349-355.
5. Karabis A, Giannouli S, Baltas D. HIPO: a hybrid inverse treatment planning optimization algorithm in HDR brachyt- herapy. Radiother Oncol 2005; 76: S29.
6. Lessard E, Pouliot J. Inverse planning anatomy-based dose optimization for HDR-brachytherapy of the prostate using fast simulated annealing algorithm and dedicated objective function. Med Phys 2001; 28: 773-779.
7. Trnková P, Pötter R, Baltas D et al. New inverse planning technology for image-guided cervical cancer brachytherapy:
Description and evaluation within a clinical frame. Radiother Oncol 2009; 93: 331-340.
8. Trnková P, Baltas D, Karabis A et al. A detailed dosimetric comparison between manual and inverse plans in HDR int- racavitary/ interstitial cervical cancer brachytherapy. J Con- temp Brachytherapy 2010; 2: 163-170.
9. Jamema SV, Kirisits C, Mahantshetty U et al. Comparison of DVH parameters and loading patterns of standard loading, ma- nual and inverse optimization for intracavitary brachytherapy on a subset of tandem/ovoid cases. Radiother Oncol 2010; 97: 501-506.
10. Kannan RA, Gururajachar JM, Ponni A et al. Comparison of manual and inverse optimisation techniques in high dose rate intracavitary brachytherapy of cervical cancer: A dosi- metric study. Rep Pract Oncol Radiother 2015; 20: 365-369.
11. Matias Ldos S, Palmqvist T, Wolke J et al. Dosimetric and radiobiological evaluation of hybrid inverse planning and optimization for cervical cancer brachytherapy. Anticancer Res 2015; 35: 6091-6096.
12. Pelagade S, Maddirala HR, Misra R et al. Dosimetric com- parison of volume-based and inverseplanning simulated annealing-based dose optimizations for high-dose-rate bra- chytherapy. Med Dosim 2015; 40: 235-239.
13. Tang B, Liu X, Wang X et al. Dosimetric comparison of graphical optimization and inverse planning simulated annealing for brachytherapy of cervical cancer. J Contemp Brachytherapy 2019; 11: 379-383.
14. Bahadur YA, Constantinescu C, Hassouna AH et al. Single versus multichannel applicator in high-dose-rate vaginal brachytherapy optimized by inverse treatment planning.
J Contemp Brachytherapy 2014; 6: 362-370.
15. Carrara M, Cusumano D, Giandini T et al. Comparison of different treatment planning optimization methods for va- ginal HDR brachytherapy with multichannel applicators:
A reduction of the high doses to the vaginal mucosa is pos- sible. Phys Med 2017; 44: 58-65.
16. Jameson MG, Ohanessian L, Batumalai V et al. Comparison of Oncentra® Brachy IPSA and graphical optimisation tech- niques: a case study of HDR brachytherapy head and neck and prostate plans. J Med Radiat Sci 2015; 62: 168-174.
17. Choi CH, Park SY, Park JM et al. Comparison of the IPSA and HIPO algorithms for interstitial tongue high-dose-rate brachytherapy. PLoS One 2018; 13: e0205229.
18. Polgár Cs, Major T, Fodor J et al. Accelerated partial-breast irradiation using high-dose-rate interstitial brachytherapy:
12-year update of a prospective clinical study. Radiother On- col 2010; 94: 274-279.
19. Polgár C, Fodor J, Major T et al. Breast conserving therapy with partial or whole breast irradiation: Ten-year results of
the Budapest randomized trial. Radiother Oncol 2013; 108:
197-202.
20. Strnad V, Ott OJ, Hildebrandt G et al. 5-year results of accel- erated partial breast irradiation using sole interstitial multi- catheter brachytherapy versus whole-breast irradiation with boost after breast-conserving surgery for low-risk invasive and in-situ carcinoma of the female breast: a randomized, phase 3, non-inferiority trial. Lancet 2016; 387: 229-238.
21. Karabis A, Belotti P, Baltas D. Optimization of catheter po- sition and dwell time in prostate HDR brachytherapy using HIPO and linear programming. IFMBE Proceedings 2009;
25/1: 612-615.
22. Polgár C, van Limbergen E, Pötter R et al. Patient selection for accelerated partial breast irradiation (APBI) after breast conserving surgery: Recommendations of the Groupe Euro- péen de Curiethérapie-European Society for Therapeutic Radiology and Oncology (GEC-ESTRO) Breast Cancer Wor- king Group based on clinical evidence (2009). Radiother Oncol 2010; 94: 264-273.
23. Major T, Gutiérrez C, Guix B et al. On behalf of Breast Can- cer Working Group of GEC-ESTRO. Recommendations from GEC ESTRO Breast Cancer Working Group (II): Target defi- nition and target delineation for accelerated or boost Partial Breast Irradiation using multicatheter interstitial brachyther- apy after breast conserving open cavity surgery. Radiother Oncol 2016; 118: 199-204.
24. Baltas D, Kolotas C, Geramani K et al. A conformal index (COIN) to evaluate implant quality and dose specification in brachytherapy. Int J Radiat Oncol Biol Phys 1998; 40: 515-524.
25. Messing EM, Zhang JBY, Rubens DJ et al. Intraoperative op- timized inverse planning for prostate brachytherapy: early experience. Int J Radiat Oncol Biol Phys 1999; 44: 801-808.
26. Jacob D, Raben A, Sarkar A et al. Anatomy-based inverse planning simulated annealing optimization in high-dose-ra- te prostate brachytherapy: significant dosimetric advantage over other optimization techniques. Int J Radiat Oncol Biol Phys 2008; 72: 820-827.
27. Pokharel S, Rana S, Blikenstaff J et al. Evaluation of hybrid inverse planning and optimization (HIPO) algorithm for op- timization in real-time, high-dose-rate (HDR) brachytherapy for prostate. J Appl Clin Med Phys 2013; 14: 4198.
28. Siebert FA, Wolf S, Bertermann H et al. Introduction of in- verse dose optimization for ultrasound-based high-dose-ra- te boost brachytherapy: How we do it in Kiel. Brachytherapy 2014; 13: 250-256.
29. Deis TM, Gorissen BL. High-dose-rate prostate brachyther- apy inverse planning on dose-volume criteria by simulated annealing. Phys Med Biol 2016; 61: 1155-1170.
30. Poulin E, Varfalvy N, Aubin S et al. Comparison of dose and catheter optimization algorithms in prostate high-dose-rate brachytherapy. Brachytherapy 2016; 15: 102-111.
31. Fröhlich G, Geszti Gy, Vizkeleti J et al. Dosimetric compari- son of inverse optimisation methods versus forward optimi- sation in HDR brachytherapy of breast, cervical and prostate cancer. Strahlenther Onkol 2019; 195: 991-1000.
32. Dymnicka M, Kociemba A, Krupka J et al. Comparison of two inverse planing algorithms HIPO and IPSA in terms of their suitability for breast brachytherapy planning. Phys Med 2018;
52: 154. P185.
33. Roumeliotis M, Yates B, Watt E et al. Demonstration of si- mulated annealing optimization for permanent breast seed implant treatment planning. Brachytherapy 2018; 17: 615-620.
34. Van der Laarse R. The stepping source dosimetry system as an extension of the Paris system. In: Brachytherapy from radium to optimization. Mould RF, Battermann JJ, Marti- nez AA, Speiser BL (eds.). Nucletron BV, Veenendaal 1994;
pp. 319-330.
35. Baltas D, Katsilieri Z, Kefala V et al. Influence of modula- tion restriction in inverse optimization with HIPO of prostate implants on plan quality: analysis using dosimetric and ra- diobiological indices. IFMBE Proc 2009; 25: 283-286.
36. Mosleh-Shirazi MA, Shahcheraghi-Motlagh E, Gholami MH et al. Influence of dwell time homogeneity error weight parameter on treatment plan quality in inverse optimized high-dose-rate cervix brachytherapy using SagiPlan. J Con- temp Brachytherapy 2019; 11: 256-266.
37. Mavroidis P, Katsileri Z, Kefala V et al. Radiobiological eva- luation of the influence of dwell time modulation restriction in HIPO optimized HDR prostate brachytherapy implants.
J Contemp Brachytherapy 2010; 2: 117-128.
38. Balvert M, Gorissen BL, den Hertog D et al. Dwell time mo- dulation restrictions do not necessarily improve treatment plan quality for prostate HDR brachytherapy. Phys Med Biol 2015; 60: 537-548.
39. Smith RL, Panettieri V, Lancaster C et al. The influence of the dwell time deviation constraint (DTDC) parameter on dosi- metry with IPSA optimisation for HDR prostate brachyther- apy. Australas Phys Eng Sci Med 2015; 38: 55-61.