Confocal line-scanning microscope with modified illumination
László Dudás,1József Sinkó,1,* Miklós Erdélyi,1,2,3and Gábor Szabó1
1Department of Optics and Quantum Electronics, University of Szeged, Dom ter 9, Szeged 6720, Hungary
2Analytical Science Division, National Physical Laboratory, Teddington, Middlesex TW11 0LW, UK
3Department of Chemical Engineering and Biotechnology, University of Cambridge, New Museums Site, Pembroke Street, Cambridge CB2 3RA, UK
*Corresponding author: jsinko@titan.physx.u‑szeged.hu
Received July 9, 2012; revised September 6, 2012; accepted September 10, 2012;
posted September 10, 2012 (Doc. ID 172268); published October 11, 2012
A modified illumination-based method has been proposed to improve resolution of a confocal line-scanning system by 20%. Phase-only apodization is applied to the illumination and combined with confocal detection. The method was studied both theoretically and experimentally. Measurements were performed on silver nanospheres as sub- resolution test samples, and the captured data were analyzed to determine the modulation transfer function and ultimately the spatial resolution of the system. © 2012 Optical Society of America
OCIS codes: 180.5810, 180.1790, 220.2945.
Modified illumination methods such as phase shifting [1], off-axis illumination [2], optical proximity correction [3], and multiple imaging [4] in optical lithography; stimu- lated emission depletion [5], vectorial aperture engineer- ing [6], and point spread function engineering in confocal scanning microscopy [7]; and structured illumination [8]
and coated objective [9–12] in microscopy have been pro- posed to improve the spatial resolution and enhance the overall image quality.
In a line-scanning microscope (LSM) [13,14], a diffrac- tion limited line is used in the focus to scan the sample.
The lateral resolution limit of a scanning microscope can be defined by the FWHM of the line spread function (LSF) or the point spread function of line-scanning or point-scanning imaging systems, respectively. The LSM has 15% higher resolution in the scanning direction com- pared to the point scanning system, using the same numerical aperture (NA) objective and illumination wavelength [15]. However, the optical transfer function of a conventional LSM system is not isotropic. The result- ing transfer function of the imaging system can be made isotropic by repeating the scanning from different direc- tions and reconstructing the image using tomographic methods (e.g., in a line-scanning tomographic optical microscope [16,17]). With LSM a relatively high frame rate can be reached [18].
In this Letter we propose a combination of phase- modified illumination and confocal detection to achieve resolution improvement in an LSM system. The phase structure of the incoming beam was modified to attain an LSF consisting of triple peaks in the focal plane. The FWHM of the central peak was narrower than the FWHM of a normal LSF, and only the area illuminated by the cen- tral peak was detected by means of confocality.
In a confocal arrangement, the resulting LSF can be expressed as the product of the excitation intensity distribution and the detection intensity distribution in convolution with the area of the detector [19]:
LSFresx; y; z jhillx; y; zj2
jhdetx; y; zj2⊗Dx; y
; (1)
wherehillandhdetare the illumination and detection am- plitude distribution, respectively,Dis the aperture func- tion of the detector, and⊗ denotes the convolution. A similar procedure proposed by Duschet al.[20] for fluor- escent detection was followed in this Letter to describe the LSM in a reflectance mode. In this case, the excitation and detection distributions are equal. After replacing the appropriate terms in Eq. (1) based on the scalar Debye diffraction theory and model proposed by Dusch et al., the resulting LSF in the vicinity of the focus can be written as
LSFresy; z Zα
−αPillθ· exp−ikysinθ
× exp−ikzcosθkcosθdθ 2
× Zs
−s
Zα
−αPdetθ· exp−iky−yssinθ
× exp−ikzcosθkcosθdθ
2dys; (2) where Pillθ and Pdetθ are the apodization terms or pupil function of illumination and detection in the polar coordinate system, respectively; k is the length of the wave vector or the wave number (n2π∕λ); α is the aperture half-angle of the objective; and s represents the half-slit width in Airy units (1Airy unitAU twice the FWHM of LSF in the image plane). The line emerging in the focal plane is parallel to thexaxis.
The three-peak distribution mentioned above can be achieved by the appropriate phase manipulation of the incoming beam in the following way: the aperture func- tion should be divided along the y axis into three sec- tions. In the middle section a π phase shift should be introduced relative to the sidewise parts. The phase manipulation introduced into illumination along the y axis (Fig. 1) can be expressed in the apodization term of the illumination assuming an aplanatic lens (sine con- dition is fulfilled) as:
October 15, 2012 / Vol. 37, No. 20 / OPTICS LETTERS 4293
0146-9592/12/204293-03$15.00/0 © 2012 Optical Society of America
Pillθ 8>
><
>>
:
expiπ
n1∕n2cos θ
p ; ifsinsinθα≤ε n1∕n2cosθ
p ; ifε<sinsinθα≤1
0; otherwise
;
(3) where n1 and n2 are the refractive indexes before and after the focusing lens, respectively, andεis the obstruc- tion ratio, the ratio between the full aperture and the width of the middle section. In thexdirection the incom- ing beam is divergent, it does not affect the distribution in theydirection, and the angle of divergence determines the length of the line in the focal plane.
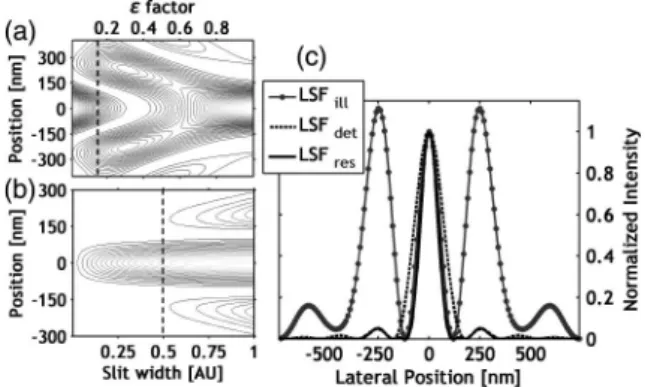
The width of the central peak that determines the re- solution depends on the obstruction ratio (ε). Figure2(a) depicts the cross sections of intensity distribution in the focal plane versus the obstruction ratio (ε) measured in relative coordinates to the full incoming aperture size. An optimum can be found at aroundε0.15, where the in- tensity of the central peak is sufficient for illumination, while the width of the central peak is narrower, providing resolution improvement.
Further analysis was performed for the width of the slit [19]. The effect of the width of the confocal slit on the cross section of detected distribution can be seen in Fig.2(b). If the width of the slit tends to 0,∼20%resolu- tion enhancement can be achieved relative to a confocal system; however, the number of transmitted photons can be too low for detection. On the other hand, in case of a wide slit, the sidelobes will be dominant. Therefore the slit width should be kept below 0.5 AU, where the ampli- tudes of the sidelobes are less than 5%. A further option to decrease the effect of sidelobes is using an optimized amplitude and/or phase filter or deconvolution. The
fluorescence loss caused by the slit is 20% and 80%, in the case of 0.5 AU and 0.1 AU slit width, respectively.
The cross section of modified illumination amplitude dis- tribution, detection distribution, and the resulting LSF [terms from Eq. (1)] can be seen in Fig. 2(c) at ε 0.15 and slit width of 2s0.1AU. The calculations were performed with the following system parameters:
NA1.49, illumination wavelength λ532nm, and oil refractive index n1.56.
By these conditions the FWHMs of LSF by normal il- lumination and modified illumination with confocal de- tection are 170 and 101 nm, respectively, which means that a resolution improvement of∼40%can be expected.
Normal illumination with confocal detection results in an FWHM of 127 nm, which means that a resolution im- provement of∼20%can be expected. However, the axial resolution decreases by up to 15%.
The above-described optimized intensity distribution can be produced by a Michelson interferometer or by a special phase plate. Since mechanical stability can be a critical issue in optical microscopy, the phase plate (e.g., spatial light modulator [SLM]) seems to be a more suitable choice.
The schematic view of the optical system can be seen in Fig.3. Phase manipulation was carried out by an SLM (Holoeye LC2002 SLM). The aperture was divided into three sections as described above. The ratio of the peak intensities and the FWHM of the central peak in the focal plane can be adjusted by the width of the middle region.
The optimal adjustment was set according to the calcu- lated optimum described above. The beam was colli- mated after the cylindrical lens in one direction, and the structured scanning line with three peaks emerged in the focus of a high NA microscope objective (1.49 Nikon CFI Apochromat TIRF). Confocal detection—using a single line of the CCD camera with a pixel size of 0.1 AU—was used to measure only the central peak, excluding the ef- fect of the sidewise peaks. The measurements were car- ried out with a diode pumped, frequency doubled Nd:
YAG laser (λ532nm,Pmax40mW). The scanning of the sample was performed with anX∕Y∕Z piezo transla- tor (PI NanoCube E-710, PZ 118E). The translator had a 100μm travel distance in every direction and provided a 5 nm step resolution in the closed-loop mode. Highly precise adjustment of confocal detection and SLM is necessary to provide the desired resolution (the inaccu- racy causes higher sidelobes and asymmetry).
The LSFs of the imaging system were measured by means of single silver nanoparticles (of 10–50 nm in size).
Fig. 1. Modified illumination of the focusing lens.
Fig. 2. (a) Cross sections of illumination LSF as a function of the obstruction ratioε, (b) cross sections of the resulting LSF by increasing slit width (0–1 AU) in contour plot, and (c) cross sec- tions of illumination, detection, and resulting LSF atε0.15
and a slit width of 0.1 AU. Fig. 3. Schematic view of the imaging system.
4294 OPTICS LETTERS / Vol. 37, No. 20 / October 15, 2012
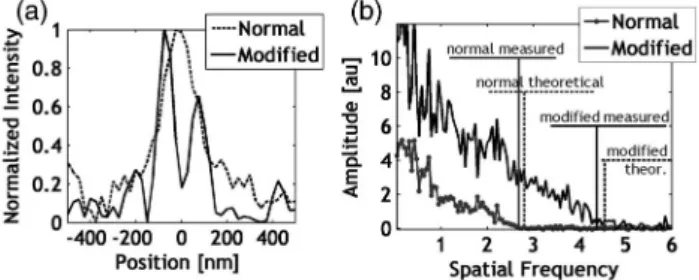
The cross sections of LSFs captured in cases of normal illumination and modified illumination combined with confocal detection compared to the calculated LSFs can be seen in Fig.4.
The measured FWHMs of normal LSF and modified LSF with confocal detection are 16110nm and 958nm, respectively, which means an improvement of∼40%. The FWHM of normal LSF combined with con- focal detection was also measured and found to be 12011nm, which means an improvement of∼20%.
For further demonstration of resolution improvement an area on the sample was chosen, with two nanospheres separated by approximately 150 nm. The two nano- spheres can be clearly separated using the proposed modified illumination method, while they are indistin- guishable under normal illumination [Fig.5(a)].
The optical transfer functions were determined by means of Fourier analyses of captured images in the case of normal and modified illumination [Fig. 5(b)]. The Rayleigh resolution limits were calculated from the deter- mined cut-off frequencies. The values in the normal and modified illumination cases were 1835nm and 1155nm, respectively. For comparison, the theoreti- cal values were 178.5 and 109.9 nm, respectively.
Table1contains the most important results. The reso- lution improvements can be seen normalized to the normal case.
We have demonstrated a resolution improvement of 20% by using the combination of modified illumination and confocal detection in a line-scanning system. The proposed method requires only minor modifications in the LSM systems. It does not need postprocessing, there- fore high frame rate can be achieved; however, highly precise adjustment of confocal detection and SLM are necessary.
Financial support from the OTKA-NKTH CNK 78549 grant of the Hungarian Scientific Research Fund Orszá- gos Tudományos Kutatási Alapprogramok (OTKA) is gratefully acknowledged. M. Erdélyi was partially funded by the Engineering and Physical Sciences Research Council (EPSRC). The authors would like to thank G.
Steinbach and Z. Kónya for their contribution, as well as Carl Zeiss MicroImaging GmbH. The project is sup- ported by the European Union and cofunded by the Eur- opean Social Fund. Project title: “Broadening the knowledge base and supporting the long term profes- sional sustainability of the Research University Centre of Excellence at the University of Szeged by ensuring the rising generation of excellent scientists.”Társadalmi Megújulás Operatív Program (TÁMOP) Social Renewal Operational Programme. Project Number: TÁMOP- 4.2.2/B-10/1-2010-0012.
References
1. M. D. Levenson, N. S. Viswanathan, and R. A. Simpson, IEEE Trans. Electron Devices,ED-29, 1812 (1982).
2. K. Kamon, T. Miyamoto, Y. Myoi, H. Nagata, M. Tanaka, and K. Horie, Jpn. J. Appl. Phys.30, 3021 (1991).
3. A. K. Wong, Resolution Enhancement Techniques in Optical Lithography(SPIE, 2001).
4. M. Erdélyi, Zs. Bor, W. L. Wilson, M. C. Smayling, and F. K.
Tittel, Appl. Opt.39, 1121 (2000).
5. S. W. Hell and J. Wichmann, Opt. Lett.19, 780 (1994).
6. B. R. Boruah, Appl. Opt.49, 701 (2010).
7. M. Martinez-Corral, Proc. SPIE5182, 112 (2003).
8. M. G. Gustafsson, J. Microsc.198, 82 (2000).
9. J. E. Wilkins, J. Opt. Soc. Am.40, 222 (1950).
10. H. Osterberg and J. E. Wilkins, Jr., J. Opt. Soc. Am.39, 553 (1949).
11. B. J. Thompson, J. Opt. Soc. Am.55, 145 (1965).
12. J. W. Y. Lit, J. Opt. Soc. Am.61, 297 (1971).
13. R. Fiolka, A Stemmer, and Y. Belyaev, Histochem. Cell Biol.
128, 499 (2007).
14. P. J. Dwyer, C. A. DiMarzio, and M. Rajadhyaksha, Appl.
Opt.46, 1843 (2007).
15. R. T. Corle and G. S. Kino, Confocal Scanning Optical Microscopy and Related Imaging System (Academic, 1996).
16. G. Gajdátsy, L. Dudás, M. Erdélyi, and G. Szabó, J. Opt.12, 115505 (2010).
17. J. Sinkó, L. Dudás, G. Gajdátsy, M. Erdélyi, and G. Szabó, Opt. Lett.36, 4011 (2011).
18. K. Im, S. Han, H. Park, D. Kim, and B. Kim, Opt. Express13, 5151 (2005).
19. J. Pawley,Handbook of Biological Confocal Microscopy 3rd ed. (Springer, 2006).
20. E. Dusch, T. Dorval, N. Vincent, M. Wachsmuth, and A.
Genovesio, J. Microsc.228, 132 (2007).
Fig. 4. Measured LSFs by means of a single silver nanoparticle, compared to the calculated LSFs.
Fig. 5. (a) Unresolved and resolved nanosphere pair in cases of normal and modified illuminations, respectively, and (b) optical transfer functions of the system in cases of normal and modified illumination.
Table 1. Resolution Improvements Normalized to the Normal Case
Calculated Measured
Slit Width 0.5 AU
Slit Width 0.1 AU
With Single Nanosphere
With Optical Transfer Function Confocal 0.82 0.74 0.750.07 0.780.04 Modified 0.63 0.59 0.590.05 0.630.04 October 15, 2012 / Vol. 37, No. 20 / OPTICS LETTERS 4295