Takahashi
Graphical Abstract
Electron transfer kinetics of methylviologen included in 4-sulfonatocalix[n]arenes at glassy carbon electrode;
adiabaticity and activation energy
Yuki Takahashi,a Takashi Fujiharaa, Naritaka Kobayashi,b Seiichiro Nakabayashi,*a,b Zsombor Miskolczy,c László Biczókc
a Department of Chemistry, Graduate School of Science and Engineering, Saitama University, Shimo-okubo 255, Sakura-ku, Saitama 338-8570, Japan
b Division of Strategic Research and Development, Graduate School of Science and Engineering, Saitama University, Shimo-okubo 255, Sakura-ku, Saitama 338-8570, Japan
c Institute of Materials and Environmental Chemistry, Research Centre for Natural Sciences, Hungarian Academy of Sciences, P.O. Box 286, 1519 Budapest, Hungary
Abstract
Quasi-reversible single electron transfer (ET) kinetics of methylviologen partly-included at the rim of 4-sulfonatocalix[n]arenes (n=4,6 and 8) has been investigated in aqueous solution. ET rates were measured by Nicholson method with relatively large potential scan rates (0.9V/s< v <50V/s). ET proceeded adiabatically on the direct collision between the MV+/MV2+ and the electrode surface, with excess energy to overcome the activation barrier. The host-guest binding equilibrium was not established under the high speed cyclic voltammetry condition. The non-equilibrium stabilization energy was independent of the size of the cavitands. The activation energy of ET under the partly-included condition was 70~80% of that without any inclusion.
Corresponding author. Phone: (+81 48) 858-3617;
E-mail: Sei@chem.saitama-u.ac.jp
1. Introduction
In biological systems, many redox centers are embedded in proteins, such as the cytochrome c in the electron transport chain [1,2,3], and the
manganese cluster as the catalysis of oxygen evolution in the photo-synthesis of green plants [4,5]. In artificial systems such as molecular machine, the electron transfer (ET) centers are located in the supramolecular inclusion complex [6]. Much simpler systemsconsist of a redox active guest in a host molecule. As host molecules, cyclodextrins (CD) and cucurbiturils (CB) have been extensively investigated [7,8]. A typical redox molecule, 1,1'-dimethyl-4,4'- bipyridinium dication (methylviologen, MV2+) spontaneously forms host-guest complexes with CD [9] or CB [10] in which the redox molecule is located in the center of the cavities.
In electrochemical conditions, the redox properties of these complexes are governed by the orientation between the redox-active molecule and the electrode [11], the electron tunneling through the sheath surrounding the ET center [12], and also the reorganization energy in the embedded conditions [13].The electrochemical ET of cytochrome c is orientation dependent [3].
Recently, ET between gold electrode surface-modified with amine and a ferrocene located off center in a carboxylic acid dendrimer structure was gated by solution pH. ET proceeded at pH 4 but was prohibited at pH 7, where the electrostatic interaction prevented the collision between ferrocene and the electrode [11]. This successfully demonstrated that the orientation perfectly governed the electrochemical ET. The activation energy of ET [13]
is a quarter of the reorganization energy (RE) in an electrochemical process.
Marcus represented the dielectric continuum model to estimate RE for a redox molecule in a homogeneous solution [13]. However, few theoretical investigations have been reported on the RE of the redox center included in the supramolecular assemble [1,2,14, 15].
In contrast to CD and CB, 4-sulfonatocalix[n]arens (SCXn) have an off-centered upper-rim that provides anchoring points. The upper-rim
provides two kinds of the stabilization: π−π interaction with the interior of the π-electron rich cavity, and electrostatic interaction with the localized negative charges at the rim [16]. Thus, SCXn macrocycles have been used as host molecules for off-centered binding of various organic cations [16-20].
Among them, the MV+/MV2+ redox couple forms self-assembled inclusion complexes with SCXn. The binding constant reported for the encapsulation of MV2+ in SCX5 (Ks = 2.5x10⁵ M-1 ) was larger than that found for the
analogous process of SCX4 (Ks = 9.3x10⁴ M-1) [21]. The complexion has been studied by isothermal titration calorimetry (ITC), which provides the thermodynamic parameters in equilibrium [17-19,21]. The Ks values are determined while all of the atomic positions in the complexes and the surrounding water molecules are in equilibrium. However, under the electrochemical conditions, the inclusion equilibrium does not always hold since the ET proceeds in advance of the nuclear relaxation to the
equilibrium.
The present article reports on the electrochemical ET rate of
MV+/MV2+⊂SCX4,6,8 complexes. The part of the ET center (MV+/MV2+) is surrounded by the rim and cavity of SCXn, whereas the rest is facing to the solvent (water) molecules. The adiabaticity and the activation energy of the electrochemical ET of MV+/MV2+⊂SCX4,6,8 is the topic of this article. As the redox reaction of MV0/MV+ proceeds via an ECE (electron transfer, chemical reaction, electron transfer) mechanism especially at slow electrochemical perturbation, the investigation is focused on ET of MV+/MV2+.
2. Experimental
Materials. 4-Sulfonatocalix[4]arene (SCX4, >94%), 4-sulfonatocalix[6]arene (SCX6,
>95%), and 4-sulfonatocalix[8]arene (SCX8, >98%) containing 1:9, 1:13, and 1:21 stoichiometric amount of water molecules in their crystal structure were purchased from TCI (Tokyo Chemical Industry). 1,1'-Dimethyl-4,4'- bipyridinium dichloride
(methylviologen, >98%) was received from TCI. All chemicals were used without further purification.
Sample preparation. 1 mM MV2+ and 1 mM SCXn solutions were prepared in 0.1 M phosphate buffer (pH 7). Inclusion complex was obtained by mixing MV2+ and SCXn
solutions under stirring. The solutions were deaerated by nitrogen gas bubbling for 30 minutes before electrochemical measurements.
Electrochemical procedure. Cyclic voltammetry measurements were carried out on a HZ-7000 (Hokuto Denko) apparatus. A typical three-electrode cell was used. A glassy carbon electrode with a surface area of 0.071 cm2 was polished by 0.1 µm and 0.05 µm alumina slurry on a cloth polishing pad. The surface was electrochemically cleaned by repeating potential scanning between the oxygen and hydrogen formation potentials in 0.5 M of sulfuric acid. The cleaned glassy carbon electrode, a saturated calomel
electrode (SCE), and a Pt wire were used as working electrode, reference electrode, and counter electrode, respectively.
Kelvin Probe Force Microscopy. Contact potential difference (CPD) of SCX8
deposited on a highly oriented pyrolytic graphite (HOPG) was measured by Kelvin probe force microscopy (KFM) in air using a home-built atomic force microscopy (AFM) and a commercially available lock-in amplifier (HF2LI, Zurich Instrument). The lock-in amplifier can apply DC and AC bias voltages [Vdc and Vaccos(2πfmt),
respectively] between a tip and a sample, detect a modulation frequency (fm) component of electrostatic force, and feedback control Vdc to obtain CPD (VCPD). We adopted amplitude modulation KFM (AM-KFM) [23] and set fm to the 1st resonance (f1=67 kHz) of an Au-coated cantilever (PPP-FMAu, Nanoworld). For simultaneous topography imaging, the cantilever oscillated at the 2nd resonance (f2=401.2 kHz).
3. Results
3.1. Electrochemical responses
Representative cyclic voltammograms (CV) of MV+/MV2+⊂SCX4 inclusion complex are shown in Fig. 1. The dotted and solid lines present the CV with potential scan rate (v=dE/dt) of 50 and 10 mV/s, respectively. The first and second redox
potentials are -0.69 and -1.02 V vs. SCE. The complexation of MVs by SCXn caused shifts in the redox potentials of MV0/MV+ and MV+/MV2+ as shown in Fig.S1. These shifts reflect that the binding energy in the hosts are different depending on the redox
states of the guest [10. 21]. The anodic currents of the oxidation of MV0/MV+⊂SCXn
decreased at lower potential scan rates, which indicated slow release of MV0 from SCXn
due to the lack of electrostatic interaction. The first redox peaks of MV+/MV2+ was reversible in the range of the scan rate from 50 to 900 mV/s.
The diffusion constants (D) of MV2+⊂SCXn at 298 K were obtained from the v1/2 dependence of the current at the first cathodic peak using the well-known relation [24];
ip =0.446(F3/RT)1/2 n3/2AD1/2Cv1/2=(2.69x105) n3/2AD1/2Cv1/2 (1) where ip, n, A, D, C and v are the peak current (A), the number of transferred electron (n=1), the area of the electrode (cm2), the diffusion constant (cm2/s), the concentration of the redox couple (mol/cm3) and the scan rate (V/s), respectively. A relationship between ip and v1/2 was plotted in Fig. 2B.
When the potential scanning rates were low, the concentration of redox molecules at the electrode surface was fixed to those in equilibrium condition determined by Nernst equation. Under this condition, the current was governed by diffusion, which was ascertained by the linear dependence shown in Fig. 2B. D was obtained by the slopes of the plots.
The hydrodynamic radius (r) of MV2+ and MV2+⊂SCXn were obtained by Stokes-Einstein relationship;
r = kbT/6πηD (2)
where kbT, η and D are the thermal energy, the dynamic viscosity of water and the diffusion constant. The obtained r and the radius of the cavity of SCXn (C) reported by Young and Villiers [22] are shown in Table 1, demonstrating that r is proportional to C.
The parallel changes of r and C implies the inclusion of MV+/MV2+ in SCXn. At high v (0.9 V/s ≦ v ≦ 50 V/s), the concentrations at the electrode surface differs from those in equilibrium. The shape of CV shown in Fig.3 is determined by the electron transfer kinetics, whereΔEp varies as a function of v. The electron transfer rate (ko) of MV+/MV2+ and MV+/MV2+⊂SCXn were obtained by Nicholson method [25]. The following relationship defines ko values:
ko = (πDRTv)1/2Ψ(ΔEp) (3)
where Ψ(ΔEp) presented in table [24, 25] is the dimensionless parameter estimated by Nicholson. The obtained ko values are listed in Table 1. The ko of MV+/MV2+ agrees well with that previously measured by Kneten and MacCreery with the same method [26].
The redox reaction of MV0/MV+ are sluggish due to the disappearance of the electrostatic interaction between MV0 and SCXn. ET rate of MV0/MV+ is out of the range of Nicholson method because of the release of MV0 from SCXn followed by ET (ECE). Therefore, the investigation is focused on ET of MV+/MV2+⊂SCXn. The higher scan rate (0.9V/s ≦ v ≦ 50V/s) does not provide enough time for the release of the guest from the host.
3.2 Images of Kelvin Probe Force Microscopy
In order to estimate the barrier height of electron tunneling through SCXn, contact potential difference image was taken by Kelvin probe force microscopy (KFM). Fig.4 A and B display the simultaneously recorded topographic and contact potential difference images of SCX8. The
topographic image indicates a SCX8 thin film formation with a height of 1.5-2.0 nm. The potential profile (Fig. 4C) measured along the line a-b in Fig.
4B suggests that the potential of the SCX8 thin film is 40-60 mV higher than that of the Au tip while the potential of the HOPG substrate is lower than that of the Au tip. A typical work function of Au is within the range of 4.8-5.1 eV, which is higher than that of HOPG (4.4-4.7 eV) [27]. This trend is
consistent with our result. Assuming that a work function of the Au tip is 4.8 eV, that of the SCX8 layer is determined ~4.85 eV with respect to the energy in vacuum (Eabs).
In order to estimate the barrier height for the electron tunneling, we need to know the LUMO energy of SCX8 in the electrochemical scale. According to the recommendation of IUPAC, the Fermi energy of normal hydrogen
electrode (NHE) is -4.44 eV [28], which means E (SCE)/V= E (abs)/V – 4.68.
Then, the HOMO energy is 0.17 V vs. SCE. SCXn cavitands are transparent in the visible region and the edge of the optical absorption starts at 290 mn (4.29 eV) [29], which corresponds to a LUMO energy of -4.11 V vs. SCE.
Since the redox potential of MV+/MV2+ is -0.69 V vs. SCE as shown in Fig.1, the tunneling barrier height is 3.42 eV.
4. Discussion
4.1 Possible terms for the ET rate
Within a frame work of Marcus theory, the electrochemical electron transfer rate ko consists of the three terms [13];
ln k0 = ln T (d,θ,φ)+ ln Z –△G‡/kT (4)
where T (d,θ,φ) is the electron tunneling probability through SCXn to the electrode surface. Z and △G‡ are the collision frequency and the activation energy, respectively. The collision frequency is given by Z= (ω/2π)δ, whereω andδ are the effective solvent frequency and the electrode-reactant distance (ca. 1 Å), respectively. Under this experimental condition, Z is regarded to be constant, Z = 104 cm/s.
4.2 Adiabaticity of the ET
The electron tunnels through the barrier in SCXn. The geometric parameters of a,d,θ, and φ are presented in Fig.5. The tunneling distance a varies
depending on the orientation (θ,φ) between the electrode surface and the redox center.
With the WKB (Wentzel-Kramers-Brillouin) approximation [30], T (d,θ,φ) is given by 𝑇 𝑑, 𝜃, 𝜑 = 𝑒𝑥𝑝 −,-. 94(5,6,7) 2𝑚(𝑉 𝑥 − 𝐸 𝑑𝑥 (5) T (d ) was obtained by integration within the parameters of 0≦θ≦(π/2) and -(π/2)≦φ≦(π/2). The tunneling curves had two parameters, d and V, where d is the distance between the center positions of MV+/MV2+ and SCXn. V is the tunneling barrier height. The curves in Fig.6 plotted by open and closed symbols were created using V = 3.42 and 0.72 eV, respectively. The former barrier height (V = 3.42 eV) was estimated from the contact potential difference obtained by Kelvin force microscopy (Fig.4). The latter (V = 0.72 eV) barrier height was estimated from the bottom of the conduction band of liquid water [31]. In spite of the large difference in the barrier heights (2.7 eV), the two curves became almost identical when d > (3/4)r.
The activation energy of ET is given by △G‡ =λ/4, whereλ is the reorganization energy of MV+/MV2+⊂SCXn . Sinceλ is in inverse
proportion to the geometric size of the redox couple [13], ko is expected to increase with the increase of n in SCXn. However, as shown in Table 1, ko
decreased as the size of SCXn grew, which was the contrary to the prediction.
The reason of this contradiction is owing to the fact that the transferred electron is localized only on the redox molecule, i.e., the SCXn is an insulating sheath.
As shown in Fig. S3, the tentative crystal structures obtained by SC-XRD demonstrate that MV+/MV2+ are captured at the rim of SCXn, and the large part of the guest is directly surrounded by water molecules. λ in water phase is much larger than that in SCXn [2]. Then, △G‡ value of MV+ /MV2+⊂SCXn complexes are independent of the size of the host because the contribution by SCXn is smaller than that by water. Under this assumption (Z and △G‡ is constant) , eq. 4 suggests T(d) = kr, where kr is the ratio of ko with and without SCXn. The crossing points between kr and T(d) give each d in SCXn (n = 4, 6, and 8) as shown in Fig.6. The difference in d obtained by the two curves (the closed and the open symbols) were negligibly small, in spite of the big difference in barrier heights, V= 3.42 or 0.72 eV. This suggests that the contribution of electron tunneling is negligibly small, i.e., the ET proceed adiabatically.
4.3 Activation energy of the ET
At the activated state, the non-equilibrium orientation of water molecules and SCXn
around MV2+ reaches the iso-energy states, where the energy of HOMO of MV2+ is equal to the Fermi energy of the electrode. The activation energy is the work required to reorganize the conformation of the surrounding solvent and SCXn molecules to match the iso-energy conditions. This activated state is reached by thermal fluctuation of water molecules and also of SCXn.
At the rim of SCXn, a part of MV+/MV2+ was surrounded by water molecules and the rest was included in the host. The stability constant for the MV2+ inclusion
complexation with SCXn (n = 4, 5) are reported to be Ks = 9.0x10⁴, 2.5x10⁵ and 2.2x10² M-1 was found for the binding to SCX6 possessing methylated phenolic groups [20, 21].
The highest stability constant, Ks = 2.5x10⁵ M-1 for MV2+⊂SCX5 [21] corresponds to -0.3 eV/molecule. The host-guest binding equilibrium is not always established under the cyclic voltammetry condition. At low v, the inclusion equilibrium followed the potential scan. As shown in Fig.1, the anodic currents of the oxidation of
MV0/MV+⊂SCX4 decreased at lower potential scan rates by the slow release of MV0 from SCX4 due to the lack of electrostatic interaction. However, at the high speed of v aiming at the evaluation of the ET rate, i.e., the Nicholson region [25, 26], the anodic peak existed even with the low Ks of SCX8 as shown in Fig.3. Despite the alternation of the charge of MV2+ sequentially to MV+ and MV0, the geometry of inclusion complexes were not the equilibrium ones and a quasi-reversible CV was obtained with the
non-equilibrium inclusion complex.
These non-equilibrium stabilization Gibbs free energies for MV+/MV2+ ⊂SCXn are represented by △Gnon-eq. In the dielectric continuum approach [13], the rational way to estimate the reorganization energy of the non-equilibrium inclusion complex is not known [32,33]. By the multiscale modeling of cytochrome c, Warshel
demonstrated that the reorganization energy in the protein is much smaller than in water [2]. Since MV+ /MV2+⊂SCXn is mainly surrounded by water, and SCXn contains a few water molecules in the interior [22], the overall reorganization energy is assumed to be near to the reorganization energy of unbounded guest,λo= 0.47 eV. Under this assumption, △G‡ is given by [32, 33]
△G‡ =(λo /4) (1+△G non-eq/λo)2 (6)
Since △G non-eq is smaller thanλo = 0.47 eV [2], eq. (6) is approximated to be △G‡ =(λo /4) + (△G non-eq/2) (7)
Under the adiabatic ET, the ET rate ko is expressed by ko = ZTSA exp (–△G‡/kBT ) (8)
where TSA is the solid angle ratio for the direct collision between MV2+ and the electrode surface, i.e., the ratio between the area of MV+ /MV2+and the total spherical area of the MV+ /MV2+⊂SCXn. The obtained △G non-eq are -0.047, -0.071 and -0.066eV for SCXn (n=4, 6, and 8), respectively. The obtained TSA, △G non-eq
and △G‡are shown in Table 2. Under the non-equilibrium conditions, despite the size change of the rim from 3 to 12 Å and at least three orders of
magnitude difference in the stability constants, the Gibbs free energy for the stabilization were independent of the size, ca. -0.05 ~ -0.07 eV. The
inclusion decreased the activation energy of ET 70~80% of that without any inclusion.
4.3. Limitation of the present discussion
According to d obtained in Fig.6, the estimated structure of MV2+⊂SCXn (n = 4, 6, and 8) are shown in Fig. S2. Geometrically, the obtained d agreed well with the fact that MV+ /MV2+ located at the rim of SCXn. The crystallographic structure of
MV2+⊂SCXn are shown in Fig. S3. The comparison between Figs. S2 and S3 suggests that the spherical approximation of MV2+⊂SCX8 is out of the range of possibility. In the aqueous solution at the used concentrations, SCX8 is not expected to capture two MV2+. However, in solid crystal, Fig. S2C depicts two MV2+ are captured in the rim of SCX8. The deduced binding manner of MV2+⊂SCX8 in the solution is not sound at this stage.
5. Conclusion
The electrochemical ET rate of MV+/MV2+ partly included by
4-sulfonatocalix[n]arenes (n=4, 6, and 8) proceeds adiabatically and the inclusion decreases the activation energy by 70~80% compared to that of the free redox couple. With the high-speed potential scan (0.9 V/s <ν < 50 V/s), the ET proceeds from a non-equilibrium conformation of the inclusion
complex. In spite of the three orders of magnitude difference in Ks, the Gibbs free energy for the stabilization in these non-equilibrium complexes were -0.05 ~ -0.07 eV, which was almost independent of the size of cavitands.
Acknowledgement
This work was supported by the bilateral cooperation program between the Japanese Society for the Promotion of Science and the Hungarian Academy of Science and the National Research, Development and Innovation Office of Hungary (NKFIH, Grant K123995).
Reference
[1] C. A. Bortolotti, M. Borsari, M. Sola, R. Chertkova, D. Dolgikh, A. Kotlyar, P. Facci, J.
Phys. Chem. C. 111 (2007) 12100.
[2] A. K. Churg, R. M. Weiss, A. Warshel, T. Takano, J. Phys. Chem. 87 (1983) 1683.
[3] T. Sagara, K. Niwa, A. Sone, C. Hinnen, K. Niki, Langmuir 6 (1990) 254.
[4] Y. Umena, K. Kawakami, J-R, Shen, N. Kamiya, Nature 473 (2011) 55.
[5] H. Lee, Y-C. Cheng, G. R. Fleming, Science 316 (2007) 1462.
[6] P. L. Anelli, N. Spencer, J. F. Stoddart, J. Am. Chem. Soc. 113 (1991) 5131.
[7] W. S. Jeon, K. Moon, S. H. Park, H. Chun, Y. H. Ko, J. Y. Lee, E. S. Lee, S. Samal, N.
Selvapalam, M. V. Rekharsky, V. Sindelar, D. Sobransingh, Y. Inoue, A. E. Kaifer, K. Kim, J. Am. Chem. Soc. 127 (2005) 12984.
[8] W. S. Jeon, E. Kim, Y. H. Ko, I. Hwang, J. W. Lee, S. Y. Kim, H. J. Kim, K. Kim, Angew.
Chem. Int. Ed. 44 (2005) 87.
[9] A. Mirzoian, A. E. Kaifer, Chem. Eur. J. 3 (1997) 1052.
[10] H-J. Kim, W. S. Jeon, Y. H. Ko, K. Kim, Proc. Natl. Acad. Sci. USA. 99 (2002) 5007.
[11] Y. Wang, C. M. Cardona, A. E. Kaifer, J. Am. Chem. Soc. 121 (1999) 9756.
[12] J. F. Smalley, S. W. Feldberg, C. E. D. Chidsey, M. R. Linford, M. D. Newron, Y-P. Liu, J. Phys. Chem. 99 (1995) 13141.
[13] R. A. Marcus, N. Sutin, Biochim. Biophys. Acta. 811 (1985) 265.
[14] T. Motylewski, J. Najbar, M. Tachiya, Chem. Phys. 212 (1996) 193.
[15] A. G. Krivenko, A. S. Kotkin, G. V. Simbirtseva, R. R. Nazmutdinov, D. V. Glukhov, N.
V. Ronyatovskaya, G. A. Tirlina, Phys. Chem. Chem. Phys. 10 (2008) 2390.
[16] D-S. Guo, Y. Liu, Acc. Chem. Res. 47 (2014) 1925.
[17] K. Wang, S-Y. Xing, X-G. Wang, H-X. Dou, Org. Biomol. Chem. 13 (2015) 5432.
[18] D-S. Guo, S. Chen, H. Qian, H-Q, Zhang, Y. Liu, Chem. Comm. 46 (2010) 2620.
[19] C. M. Cardona, S. Mendoza, A. E. Kaifer, Chem. Soc. Rev. 29 (2000) 37.
[20] R. Castro, L. A. Godinez, C. M. Criss, A. E. Kaifer, J. Org. Chem. 62 (1997) 4928.
[21] D-S. Guo, L-H. Wang, Y. Liu, J. Org. Chem. 72 (2007) 7775.
[22] W. Yang, M. M. Villiers, Eur. J. Pharm. Biopharm. 58 (2004) 629.
[23] A. Kikukawa, S. Hosaka and R. Imura, Appl. Phys. Lett., 66 (1995) 3510.
[24] A. J. Bard, L. R.Faulkner, Electrochemical Methods, Fundamental and Applications 2nd Edition, John Wiley & Sons Inc., New York, 2001, p. 226 .
[25] R. S. Nicholson, Anal. Chem. 37 (1965) 1351.
[26] K. R. Kneten, R. L. McCreery, Anal. Chem. 64 (1992) 2518.
[27] H. Kawano, Prog. Surf. Sci. 83 (2008) 1.
[28] S. Trasatti, Pure & Appl. Chem. 58 (1986) 955.
[29] T. Kamegawa, S. Matsuura, H. Seto, H. Yamashita, Angew. Chem. Int. Ed. 52 (2013) 916.
[30] D. Bohm, Quantum Theory, Dover Books on Physics, New York, 1979, p. 264.
[31] T. Goulet, A. Bernas, C. Ferradini, J. P. Jay-Gerin, Chem. Phys. Lett. 170 (1990) 492.
[32] J. P. Roth, J. P. Klinman, Proc. Natl. Acad. Sci. USA, 100 (2003) 62.
[33] G. M. Brown, N. Sutin, J. Am. Chem. Soc. 101 (1979) 884.
Figure captions
Fig. 1. Effect of low-speed potential scan rate (v) on the cyclic voltammograms (CV) of MV2+ in the presence of equal equivalent of SCX4 in 0.1 M of phosphate buffer solution (pH 7). The solid and the dotted lines present CV at v =10, and 50 mV/s, respectively.
Fig.2. (A) Effect of potential scan rate (v) on the cyclic voltammograms of MV2+ in the presence of equal equivalent of SCX4 in 0.1 M of phosphate buffer solution (pH 7). (B) Plots of the absolute value of the one electron reduction peak current of MV+/MV2+
against the square root of v.
Fig. 3. Cyclic voltammogram of MV2+ in the presence of 1 equivalent of SCX8 in 0.1 M of phosphate buffer solution (pH 7) at 0.9 (dotted line) and 10 V/s (solid line) potential scan rates.
Fig.4. (A) Topography image and (B) contact potential difference of SCX8 deposited on HOPG in air. (C) Averaged contact potential difference between a and b in (B).
Fig.5. Geometric model of MV+/MV2+⊂SCXn. (A) Solid and dotted spheres represent MV+/MV2+ and SCXn, respectively. The distance between the two centers of the spheres is d. The orientation of MV+/MV2+⊂SCXn is denoted by θ,φ. (B) The tunneling
distance between MV+/MV2+ through SCXn sheath is represented by a (d,θ,φ).
Fig. 6. Estimated tunneling coefficient (T) against the distance (d) between MV2+ and SCXn (n=4, 6, and 8), where the barrier height (V) V = 3.42 and 0.72 eV for filled and open symbols, respectively.
Takahashi Fig.1.
Takahashi Fig.2.
Takahashi Fig.3.
Takahashi
Fig.4. A
B
C
Takahashi Fig.5.
Takahashi Fig.6.
T (d)
d / Å
■MV+/MV2+⊂SCX4
●MV+/MV2+⊂SCX6
▲MV+/MV2+⊂SCX8
Takahashi
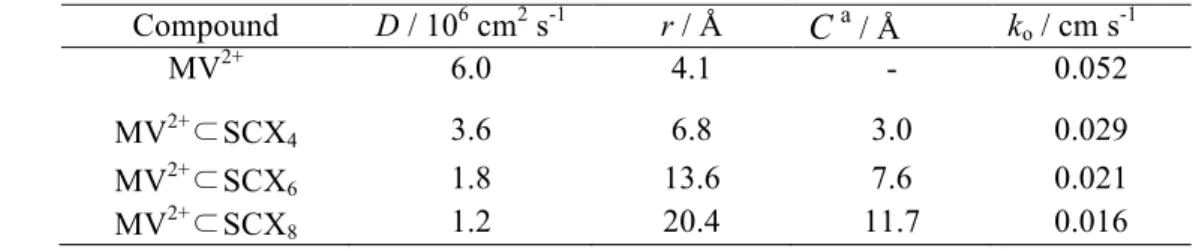
Table 1. Diffusion coefficient (D), hydrodynamic radius (r) , cavity radius (C) and ET rate (ko) of MV+/ MV2+⊂SCXn (n=4, 6, and 8).
Compound D / 106 cm2 s-1 r / Å Ca / Å ko / cm s-1
MV2+ 6.0 4.1 - 0.052
MV2+⊂SCX4 3.6 6.8 3.0 0.029
MV2+⊂SCX6 1.8 13.6 7.6 0.021
MV2+⊂SCX8 1.2 20.4 11.7 0.016
a Reference [22]
Takahashi
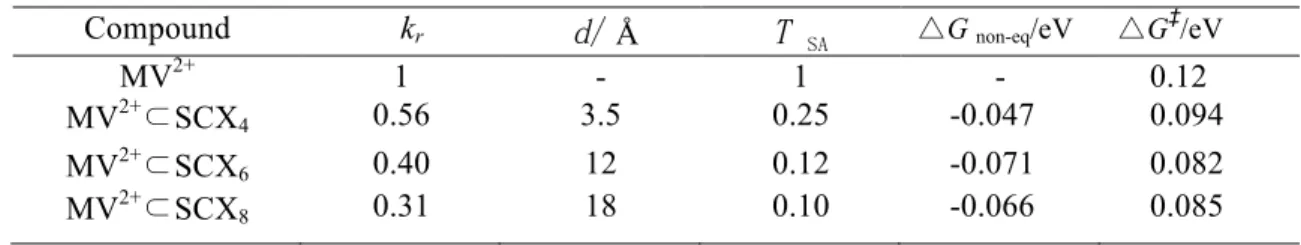
Table 2. Ratio of ET rate (kr), solid angle ratio (TSA), off-centered distance (d), non-equilibrium stabilization Gibbs free energy (△G non-eq), and activation Gibbs free energy (△G‡) of MV2+/ MV2+⊂SCXn (n=4, 6, and 8).
Compound kr d/ Å T SA △G non-eq/eV △G‡/eV
MV2+ 1 - 1 - 0.12
MV2+⊂SCX4 0.56 3.5 0.25 -0.047 0.094
MV2+⊂SCX6 0.40 12 0.12 -0.071 0.082
MV2+⊂SCX8 0.31 18 0.10 -0.066 0.085
Supporting Information
Electron transfer kinetics of methylviologen included with 4-sulfonatocalix[n]arenes at glassy carbon electrode;
adiabaticity and activation energy
Yuki Takahashi, Takashi Fujiwara, Naritaka Kobayashi, Seiichiro Nakabayashi, Zsombor Miskolczy,László Biczók
Fig.S1. Potential shifts on the cyclic voltammograms of MV2+ in the presence of equivalent of SCXn in 0.1M of phosphate buffer solution (pH 7) at v = 200 mV/s.
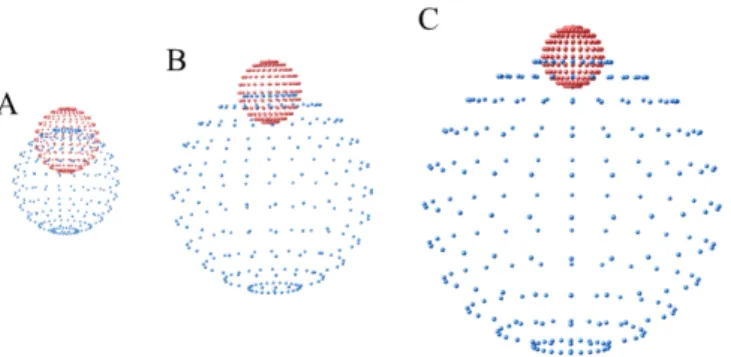
Fig. S2. Structure of MV2+–SCX4 (A), MV2+–SCX6 (B), and MV2+–SCX8 (C) according to d estimated shown in Fig. 6.
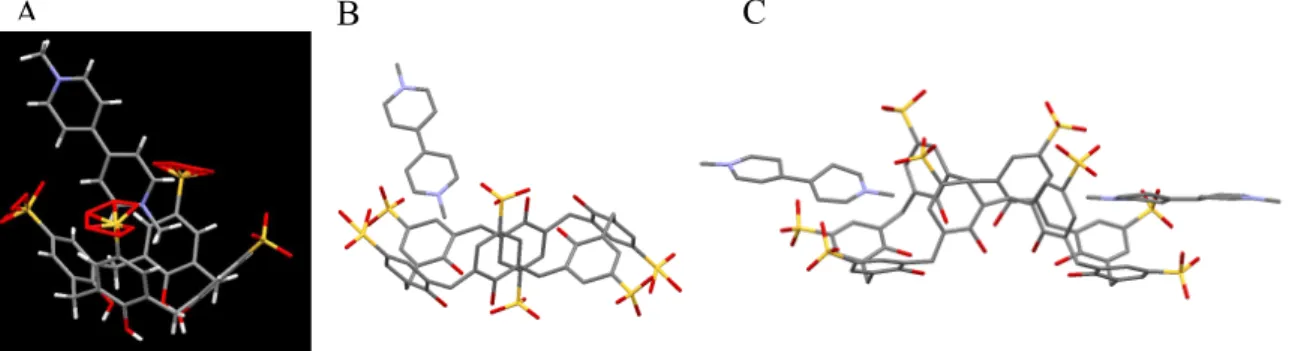
Fig. S3. Deduced binding manners of (A) SCX4, (B) SCX6 and (C) SCX8 with MV2+
according to SC-XRD data. (A) is the optimized and identical to the reported structure [21, S1, S2]. (B) and (C) are the tentative structures.
[S1] Crystallographic Data for MV2+⊂SCX4, D. S. Guo, X. Su, Y. Liu, CCDC 626914, Experimental Crystal Structure Determination. 2014, http://dx.doi.org/10.5517/ccp1c13
[S2] K. Wang, S. Y. Xing, X. G. Wang, H. X. Dou, Org. Biomol. Chem. 13 (2015) 5432.
A B C