ZOLTÁN KOLLÁTH1,2, DÉNES SZÁZ1, KAI PONG TONG1, KORNÉL KOLLÁTH3,1
LIGHT POLLUTION SURVEY IN HUNGARIAN NATIONAL PARKS
1Eötvös Loránd University (ELTE) BDKP, Department of Physics, Szom- bathely, Hungary, 2Eszterházy Károly University, Department of Physics, Eger, Hungary, 3Hungarian Meteorological Service, Budapest,
Hungary
E-mail: zkollath@gmail.com
Abstract
We have started a light pollution survey in the Hungarian national parks. We use a mobile laboratory consisting of digital cameras and robotic panorama heads to gather high-resolution panorama imaging radiometry. The same type of cameras with fish-eye lenses are used in fix monitoring stations. Parallel to the imaging radiometry, we measure the spectral distribution of the sky radiation. The spectroradiometry provides additional calibration check on the measurements and further information on the sources of light. The mobile laboratory provides an excellent spatial resolution at a given national park while the monitoring all-sky camera stations add the possibility to detect temporal changes in night sky quality. We developed new SI traceable met- rics for the measurement of night sky quality. The RGB colour channels of the camera provide an optimal way to obtain multispectral radiance information.
The selected metric is the band-averaged spectral radiance. Besides, we use a colour enhancement technique to find traces of different sources of night sky radiance. In the near future, we expect a large amount of high-quality data from the Hungarian national parks, which provide an outstanding possibility in light pollution related and atmospheric research. In the paper, we present the first results of the sky quality survey.
Keywords: light pollution, sky radiance, spectroradiometry
https://doi.org/10.33041/ActaUnivEszterhazyBiol.2021.46.111
KOLLÁTH ZOLTÁN1,2, SZÁZ DÉNES1, TONG KAI PONG1, KOLLÁTH KORNÉL3,1
FÉNYSZENNYEZÉS FELMÉRÉS A NEMZETI PARKOKBAN
1Eötvös Loránd Egyetem (ELTE) BDKP, Fizikai Tanszék, Szombathely,
2Eszterházy Károly Egyetem, Fizika Tanszék, Eger, 3Országos Meteorológiai Szolgálat, Budapest
Összefoglalás
Fényszennyezés-felmérést kezdtünk a magyarországi nemzeti parkokban. A vizsgálathoz digitális kamerákból és automata panorámafejekből álló hordoz- ható laboratóriumot használunk, amellyel lehetőség van a nagy felbontású panorámaleképező radiometria végzésére. Ugyanilyen típusú kamerákat és halszemoptikákat állandó telepítésű mérőállomásokon is használunk. A leké- pező radiometriával párhuzamosan az égbolt fénylésének spektrális eloszlását is mérjük. A spektroradiometria járulékos kalibrációs információt szolgáltat a mérésekhez, ezen kívül segít a lehetséges források megkülönböztetésében is.
A hordozható laboratórium megfelelő térbeli felbontást szolgáltat a nemzeti parkokban, míg az állandó teljeségbolt-mérőállomások biztosítják azt az időbeli felbontást, amellyel az égboltminőség változásait érzékelhetjük. Kidolgoztunk egy SI-egységekre visszavezethető metrikát az égboltminőség méréséhez, a kiválasztott metrika a sávátlagolt spektrális sugársűrűség. Ezen kívül egy szín- kiemeléses eljárást is alkalmazunk, amellyel az égbolt fénylésének különböző forrásainak a jeleit detektálhatjuk. A közeljövőben a magyarországi nemzeti parkokból nagy mennyiségű, jó minőségű adatra számíthatunk, ami kiváló lehetőséget ad a fényszennyezéssel kapcsolatos és légkörfizikai jellegű kutatá- sokhoz. A jelen cikkben bemutatjuk az égboltminőség-felmérés első eredmé- nyeit.
Kulcsszavak: fényszennyezés, égbolt radiancia, spektroradiometria
Introduction
In the last decades, the increasing level of artificial light at night (ALAN) is mainly caused by increasing urbanization. There are ever fewer places where a clear starry sky can be enjoyed, without interfering artificial lights. Due to an increase in demand for lighting and the change in the lighting customs, light pollution affects ever-larger areas with growing intensity, reaching large dis- tances. It damages astronomical observations and has significant environmen- tal, ecological and human health issues. The skyglow, caused by urban lights that are partially scattered back toward the ground producing a diffuse glow, can be perceived from a distance of 100 km or even more (kyBa et al. 2012, 2015). Artificial light has various kinds of influence on the ecological system:
animals can become disoriented and misled by additional illumination. They may be attracted to or repulsed by glare, which affects foraging, reproduc- tion, communication, and other critical behaviours. It also changes the natural behavioural patterns that evolved in the presence or absence of natural night lighting (longcoReand RicH 2004). Light pollution has adverse impacts on human health and the quality of life (auBé et al. 2013).
The National Landscape Strategy of Hungary for the years 2017-2026 (national landsaPestRategy) contains recommendations for the National assess- ment of light pollution through the determination of sky luminance/radiance distribution. Based on the requirements of the landscape strategy, we have started the night sky quality survey in the Hungarian national parks.
The recent development of commercial digital cameras provides a new opportunity to monitor the quality of the night sky and light pollution. We can calibrate cameras that can save images in a raw format to measure the radi- ance of the sky. We have been using this method routinely, see, e.g. kollátH
2010, kollátH et al. 2016, 2017, JecHoW et al. 2016, 2018. However, it has turned out that the use of only the green channel in the measurements has some drawbacks. The colour information provides additional possibilities to distin- guish different phenomena. To overcome the problems we have encountered, we also introduced a new metric and unit (kollátH et al. 2020).
Here, we present our first results obtained in the Living Environmental Laboratory for Lighting (LELL) (see száz et al. 2020) with a new measurement system, consisting of a remotely controllable fixed digital camera with an all-sky fisheye lens, installed at a specific location for continuous light pol- lution survey. LELL is a modernized and reconstructed public lighting sys- tem, where the protection of the night sky and the environment were the primary goals. This system was first realized in the villages of Bárdudvarnok and Répáshuta, being parts of dark sky parks in Hungary. In these regions, the old CFL technology was changed to LED-based street lighting with a cus- tomized emission spectrum. Our motivation was twofold: i) change lighting according to the requirements of the International Dark-Sky Association (IDA) and ii) observe the environmental impacts of new LED technology. Later, we
will continue the sky quality surveys in the LELL and at other national parks in Hungary.
Material and methods
Equipment for light pollution measurements
The essential tool to perform the light pollution survey of national parks is a commercial digital camera. The measurements can be taken with various set- ups, such as a standalone digital camera with a 180° fisheye lens, a digital cam- era with a 24 mm lens and a robotic panorama head, a remotely controllable fixed digital camera with an all-sky fisheye lens, installed at a specific location for continuous measurements.
For our survey, we preferred using a robotic panorama head with a 24 mm lens on a full-frame camera. With this instrument, we got 28 separate photos with different pointing to cover the whole sky and some of the ground and environment with high resolution. Since the large aperture lenses and the sen- sitivity of the camera made it possible to use 6-10 seconds of exposure time, we could perform all the measurements in 10-15 minutes at a given location. It provided a high resolution together with high accuracy and efficiency (kollátH
et al. 2020).
Besides the portable camera, a remotely controllable fixed camera was installed at the Zselic Observatory, in the area of Zselic Starry Sky Park being the first dark sky park in Hungary and Europe. The camera had an all-sky fish- eye lens and took photos daily every 10 minutes from sunset until sunrise.
Similar cameras will be deployed at different locations.
Evaluation of the measurements
There are very different units used for the evaluation of sky luminance/radi- ance. Unfortunately, some of these metrics were not well defined, and most of them did not follow the requirements of SI traceability. To eliminate these problems, Kolláth et al. (2020) provided a recommendation for a new unit.
The definition is based on spectroradiometry, and it can be directly applied for digital camera measurements. The new unit gives the spectral radiance of the sky in band-averaged metric; therefore, the values do not depend on the bandwidths of the spectral response of the given detector but represents the average spectral radiance. The unit of this metric is nW/m2/sr/nm, and for simplicity, we introduce the dsu (dark sky unit) abbreviation for the unit. The radiance of the unpolluted natural sky is around 2 dsu, and in cloudy weather, it can decrease to 1 dsu.
We developed a unified workflow for the post-processing of the obtained images. The processing pipeline consists of several independent steps. We also used open-source or commercially available software to perform specific tasks, like the stitching of the individual images to whole sky panoramas. As a first step, we used our self-developed software, DiCaLum, to convert the raw images to calibrated 16 bit per channel colour images. DiCaLum uses the open-source package ‘dcraw’ to read in the raw camera files and to save it in an unprocessed ppm image. The colour channels of the output image obtained from DiCaLum contain the calibrated band averaged radiances with 100 ‘dsu’ representing the maximum digital number in the standard file. Optionally, in individual cases, other saturation values can be specified. These calibrated images contain all the necessary information, storing the data on a linear scale, for further pro- cessing and statistical analysis. After the above process, the images taken by the robotic panorama head and the full-frame camera with 24 mm lens, were stitched together to provide a whole sky image in spherical projection. The pro- cessing guarantees that the calibration and the scale of units are conserved.
The next processing step with DiCaLum provides the false colour repre- sentation of the band averaged radiances in all the three channels. After that, additional smoothing of the images may be necessary and statistical analysis is possible. Since DiCaLum is a GNU Octave library, all the processing and sta- tistical packages can be used which are available in GNU Octave. We usually added another processing step to evaluate the mean band-averaged radiance at and around the zenith, to find the darkest and brightest locations. DiCaLum has no graphical output with a full summary of the image. Thus, we used addi- tional software to create a measurement report in a more flexible format. The results of the statistical analysis were saved in a ‘GNU sed’ compatible script file. It had the advantage that LaTeX, a standard publication-quality document processing system could easily handle the file to make the final report of the measurements pipeline.
Results with Discussion
Here we present the preliminary results of our national park survey. We have to note that at some locations, the weather conditions were not favourable for precise measurements. Moreover, the natural background is variable due to the changes in the airglow level. Therefore the measurements represent the distribution of the sky radiance for a given night. The mobile measurements are crucial to show the differences between different locations inside a national park. The fixed all-sky cameras will provide additional information on the vari- ability and the representative range on sky radiance.
# Site Latitude Longitude Date/Time (UT)
1 Zselic DSP, bright 46.2388 17.7634 2020.02.21 18:15 2 Zselic DSP, darkest 46.2697 17.6621 2018.04.19 02:20
3 Bükk DSP 48.0527 20.5119 2019.03.06 02:20
4 Balaton Upland NP 46.8541 17.3302 2020.05.26 23:50
5 Fertő-Hanság NP 47.6825 16.8433 2019.03.30 20:40
Table 1. Coordinates and dates of Measurements
Figures 1-5 display typical sky radiance distribution maps at different locations.
Usually, the non-natural structure of these maps is determined by one or two local city/cities. The light domes of these settlements make the major degrada- tion in night sky quality.
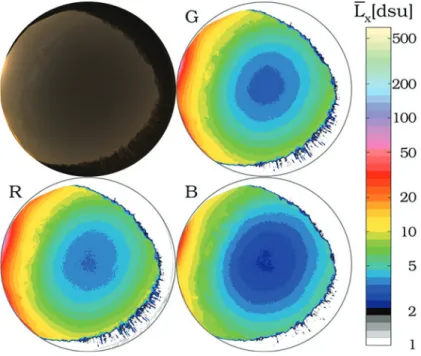
Figure 1 demonstrates the changes in natural sky brightness in the Zselic Starry Sky Park. The first measurement (Fig. 1A) was taken on an average night in the presence of zodiacal light (the bright light triangle at the right of the all- sky image) and with the Milky Way in the zenith. This condition significantly increases the radiance of the night sky. In contrast, the second image (Fig. 1B) was taken during the darkest clear night we experienced in the Zselic area. This time the Milky way did not extend to the zenith and the transparency of the atmosphere was excellent meaning less light scattering in the air. Although the radiance of the sky around the zenith was close to the natural level, the light dome of Kaposvár remained a strong degradation factor to sky quality.
Figure 1. Natural night sky at two locations in The Zselic Starry Sky Park A and B) Real colour image of the natural night sky (top left) and the false colour radi-
ance maps of the RGB channels.
The Bükk National Park (also The Bükk Starry Sky park) has very similar con- ditions to the sky quality in Zselic (Figure 2.). Like in Zselic, there is a sharp contrast between radiance at the zenith and at the horizon in the direction of the neighbouring cities. In this case, Miskolc presents a significant light dome.
Figure 2 Real colour image of the natural night sky at a location in the Bükk Starry Sky Park (top left) and the false colour radiance maps of the RGB channels.
The last two measurements presented here (Fig. 3) were performed at more light-polluted places. In these cases, there are relatively bright light domes in various directions, and the scattered light from these sources adds to a higher zenith radiance as well. The presented figure from the Balaton Upland National Park represents the darkest place we visited there (Fig. 3A). The hills and the foliage of the neighbouring forest also provide some shielding from the direct view of the light domes. A significant local feature on the photo and the false-co- lour images is the light beam resulting from the lighting of a church tower. The measurements taken close to the Lake Neusiedl (Fertő tó) clearly show that all the lights up to vast distances sum to a significant extra radiance close to the horizon. Here the major sources are Vienna, Bratislava and Sopron (Fig. 3B).
Figure 3 Natural night sky in two light polluted areas.
A) Real colour image of the natural night sky at a location in the Balaton Upland National Park (top left) and the false colour radiance maps of the RGB channels. B) Real colour image of the natural night sky at a location in the Fertő-Hanság National Park (top left)
and the false colour radiance maps of the RGB channels.
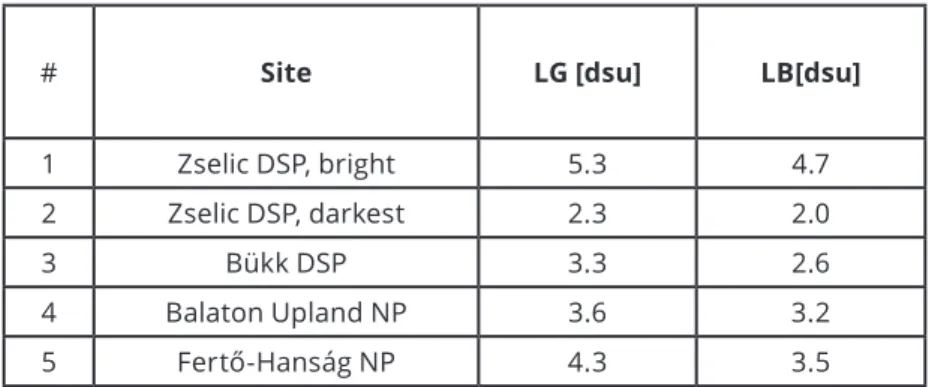
We summarize the measurements in Table 2. The difference of the differ- ent conditions in the case of the Zselic measurements confirm that continuous measurements are needed to describe a given location correctly
# Site LG [dsu] LB[dsu]
1 Zselic DSP, bright 5.3 4.7
2 Zselic DSP, darkest 2.3 2.0
3 Bükk DSP 3.3 2.6
4 Balaton Upland NP 3.6 3.2
5 Fertő-Hanság NP 4.3 3.5
Table 2. Representative zenith radiance values
The remotely controllable fixed all-sky cameras in the protected area pro- vide essential information about the dynamics of the night sky. At the prepara- tion of the manuscript, only the camera in the Zselic Starry Sky Park collected enough data to perform an analysis. Figure 4 shows a summary of the mea- surements. All the dots represent an all-sky photo. In the horizontal direction, the position represents the day of the measurement.
In contrast, in the vertical direction, from top to down, the individual mea- surements of the given night are shown. We present only images taken during the astronomical night and with no Moon on the sky. We used artificially enhanced colours, to show the deviation from the standard natural sky. It is not the real colour of the sky, but the colours indicate the direction of the shift from the natural sky. We refer to this processing as false colour enhancement (FCE).
Figure 4. Fixed camera data from Zselic – False colour enhanced images from astronomical night with the Moon under the horizon. All nights with at least seven
images between 01.04.2020-30.06.2020.
For a detailed analysis of the variation of sky radiance, we selected all the photos with natural moonless nights (solar elevation < -18°, lunar elevation <
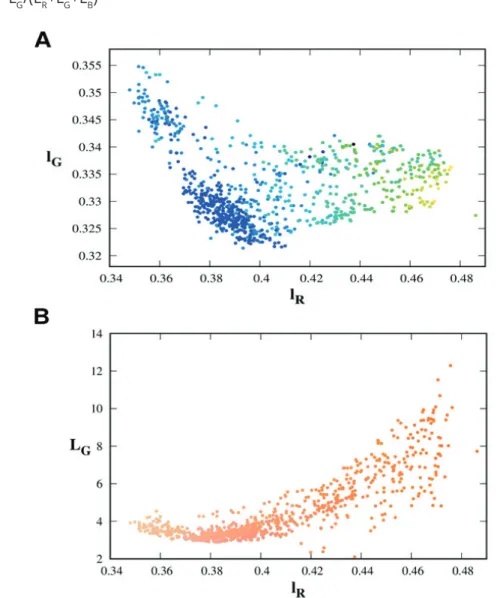
-1°). The band-averaged radiances of the sky around the zenith (inside a circle with a radius of 10 degrees) were calculated for all the 3 colour bands. Then, we defined the normalized dsu colour indices:
lR=LR/(LR+LG+LB) lG=LG/(LR+LG+LB)
Figure 5. Colour-colour diagram of the all-sky camera data (measurements in Figure 4).
A) The colour of the symbols given by the standard dsu colour scaler. B) The colour of the symbols represents the real colour of the light.
Figure 5A displays the correlation between the colour indices. The colours of the symbols are selected according to the G band-averaged spectral radiance (LG) on the standard colour scale. There is a clear band of colour pars repre- senting the darkest data. The increase in sky brightness is the result of clouds or humidity accumulation above the area. The clouds reflect the light from the neighbouring settlements. The figure indicates that the reflected light is more
reddish, as the red colour index is increased. There are some extra dark dots on the redder section of the diagram, caused by a very thick cloud layer which blocks the light. The typical dark measurements (with blue symbols) provide a clear connection between the colours. This relation can be an essential input for the modelling and interpretation of the natural sky brightness variations.
The dependence of sky radiance on sky colour is another crucial relation which provides useful information. Figure 5B displays the green band-averaged radiance as a function of the red colour index. The colour of the dots represents the real colours of the sky. There is a definite lower boundary of data points in the left part of the figure. The minimum of this boundary occurs at lR=0.38. The minimum band averaged radiance at this part (LG=2.7dsu) represents the best night at the location. A possible interpretation of the diagram: Moving to the left from the minimum point, the green airglow increases, thus a radiance also increases. At the redder part, the increased level of clouds makes the colour redder and also makes the sky brighter.
Conclusion
In this paper, we demonstrated that multicolour imaging radiometry provides an essential tool for the qualification of night sky quality and light pollution.
Mobile measurements provide a sufficient spatial resolution in a given national park or protected area, however continuous monitoring with station- ary all-sky cameras is essential to obtain the variations and the dynamics of skyglow.
The colour-colour and colour-radiance diagrams provide a new and essential diagnostic tool for understanding the mechanism of light propagation and the origin of natural changes in sky brightness. These diagrams, besides, provide the fingerprints of a given national park or dark sky place.
The survey continues in the Hungarian nature protected network, and the results will be published in a forthcoming paper.
Acknowledgement
The project is supported by the European Union and co-financed by the European Social Fund (Grant no. EFOP-3.6.2- 16-2017-00014; Development of international research environment for light pollution studies).
References
auBé, M., RoBy, J., kociFaJ, M. (2013). Evaluating potential spectral impacts of various artificial lights on melatonin suppression, photosynthesis, and star visibility. PloS One, 8(7). DOI: https://doi.org/10.1371/journal.pone.0067798 JecHoW, a., HölkeR, F., kollátH, z., gessneR, M. o., kyBa, c. c. M. (2016). Evaluating
the summer night sky brightness at a research field site on Lake Stechlin in northeastern Germany. Journal of Quantitative Spectroscopy & Radiative Transfer, 181, 24–32. DOI: https://doi.org/10.1016/j.jqsrt.2016.02.005
JecHoW, a., RiBas, s. J., doMingo, R. c., HölkeR, F., kollátH, z., kyBa, c. c. M. (2018).
Tracking the dynamics of skyglow with differential photometry using a digital camera with fisheye lens. Journal of Quantitative Spectroscopy & Radiative Transfer, 209, 212–223. DOI: https://doi.org/10.1016/j.jqsrt.2018.01.032
kollátH, z. (2010). Measuring and modelling light pollution at the Zselic Starry Sky Park. Journal of Physics. Conference Series, 218(1), 012001. DOI: https://doi.
org/10.1088/1742-6596/218/1/012001
kollátH, z., cool, a., JecHoW, a., kollátH, k., száz, d., tong, k. P. (2020). Introducing the Dark Sky Unit for multi-spectral measurement of the night sky quality with commercial digital cameras. Journal of Quantitative Spectroscopy & Radiative Transfer, 253, 107162. DOI: https://doi.org/10.1016/j.jqsrt.2020.107162
kollátH, z., döMény, a. (2017). Night sky quality monitoring in existing and planned dark sky parks by digital cameras. International Journal of Sustainable Lighting, 19(1), 61–68. DOI: https://doi.org/10.26607/ijsl.v19i1.70
kollátH, z., döMény, a., kollátH, k., nagy, B. (2016). Qualifying lighting remodelling in a Hungarian city based on light pollution effects. Journal of Quantitative Spectroscopy & Radiative Transfer, 181, 46–51. DOI: https://doi.org/10.1016/j.
jqsrt.2016.02.025
kyBa, c., BouRoussis, c., canal-doMingo, R., FalcHi, F., giacoMelli, a., Hänel, a., kollátH, z., Massetti, l., s. RiBas, H. s., tong, k. P., WucHteRl, g. (2015). Report of the 2015 LoNNe Intercomparison Campaign. http://www.cost-lonne.eu/wp-content/
uploads/2015/04/2015_LoNNe_IC_Report.pdf
kyBa, c. c. M., RuHtz, t., FiscHeR, J., HölkeR, F. (2012). Red is the new black: how the colour of urban skyglow varies with cloud cover: Red is the new black.
Monthly Notices of the Royal Astronomical Society, 425(1), 701–708. DOI: https://
doi.org/10.1111/j.1365-2966.2012.21559.x
longcoRe, t., RicH, c. (2004). Ecological light pollution. Frontiers in Ecology and the Environment, 2(4), 191–198. DOI: https://doi.org/10.1890/1540- 9295(2004)002[0191:ELP]2.0.CO;2
National Landsape Stategy: https://www.kormany.hu/download/f/8f/11000/
Hungarian%20National%20Landscape%20Strategy_2017-2026_webre.pdf