0139–3006 © 2018 Akadémiai Kiadó, Budapest DOI: 10.1556/066.2018.0007
POLYSACCHARIDES AND POLYPHENOLS IN SEA BUCKTHORN LEAF TEA HAVE SYNERGISTIC IMPACT ON STUDIED COLONIC
STRAINS IN VITRO AND BACTERIA IN VIVO
W.M. DU*, F.H. WANG, H.Y. ZHANG, B.Z. JIANG, X.Y. CHEN, W. ZHANG, Y. XIE
and Z.T. SHENG
Department of Food Science and Engineering, College of Biological Sciences and Technology, Beijing Key Laboratory of Forest Food Process and Safety, Beijing Forestry University, Beijing. China
(Received: 1 November 2017; accepted: 12 May 2018)
Present research on prebiotics focuses on either polysaccharides or polyphenols. This study compared the individual and combined impact of polysaccharide, quercetin, and gallic acid (GA) treatment on three human faecal strains. In vitro pure culturing and correlation analysis confi rmed that the growth of both benefi cial microbe B. longum subsp.
longum (0.695, 0.205: R2, slope, respectively) and pathogenic C. perfringens (0.712, 0.085: R2, slope, respectively) increased due to polysaccharide treatment, and only GA treatment would inhibit C. perfringens (0.789, –0.165: R2, slope, respectively) growth. In vivo studies also revealed that genome copies of Bifi dobacterium increased and C.
perfringens decreased in the faeces, when a blend of the three nutrients rather than single polysaccharide or polyphenols were fed to rats. These data suggested that combined prebiotic treatment improved human faecal strain composition better than single treatment.
Keywords: polysaccharide, quercetin, gallic acid, synergic regulation, three colonic strains and bacteria
Plant cell wall polysaccharides have been shown to be the primary prebiotics. However , growth of both Lactobacillus species and Escherichia coli could be stimulated with pectin (BARRY et al., 2010), revealing that polysaccharides could enhance the growth of probiotic and conditioned pathogenic strains simultaneously.
Moreover, fl avonoids may have the ability to modify the gut microbial balance by their biotransformation products (PARKARA et al., 2013). LEE and co-workers (2006) reported that some pathogens could be repressed by gallic acid (GA), while probiotics are less severely affected.
Present research on prebiotics focuses on either polysaccharides or polyphenols, although both polysaccharides and polyphenols modify human faecal microbiota.
A leaf tea processed from a drought-resistant plant, sea buckthorn (Hippophae rhamnoides Linn.), has high polyphenol content. However, its main functional effect is on defecation rather than improving antioxidant activity (DAI et al., 2011). The research available has shown that the fl avonoids in sea buckthorn leaf exist primarily in the conjugated form, linked with a sugar moiety by a C-3 bond (KIM et al., 2011), and that 85% of its total phenolic acid, GA (ARIMBOOR et al., 2008), is absorbed via the paracellular route (KONISHI et al., 2003).
Accordingly, for sea buckthorn tea there is an increased polyphenol uptake by the colon in contrast to other types of leaf teas. Moreover, polysaccharides from sea buckthorn leaf would
* To whom correspondence should be addressed.
Phone: +86 10 62336700; fax: +86 10 62338221; e-mail: weimindu@bjfu.edu.cn
inhibit the growth of E. coli, which also adds to its benefi cial function on colon microbiota (GUAN et al., 2005).
Polysaccharides improve the growth of benefi cial microbes, but polyphenols repress pathogens much better than polysaccharides. This study in vitro compared the promoting and inhibiting effects of the digestate of polysaccharides, quercetin, and GA on the growth of Bifi dobacterium longum subsp. longum, E. coli K12, and Clostridium perfringens populations and revealed the change in the genome copies of B. longum, E. coli, and C. perfringens in mouse faeces after feeding the mice the cell wall polysaccharide extract, gallic acid lauryl alcohol ester, and quercetin-3-O-glucoside, both individually and in combinations.
1. Materials and methods
1.1. Materials
The fresh male leaves of sea buckthorn were collected in wild sea buckthorn forests in Shanxi Guangling, China in August 2015. Sea buckthorn green tea and its tea water freeze-dried powder were prepared according to our previous study (LI et al., 2016).
1.2. Preparation of sea buckthorn cell wall polysaccharide digestate
Briefl y, 10.0 g of tea water powder was extracted by Soxhlet extraction with 150 ml of petroleum ether for 1 h at 70 °C, and then ultrasonic water extraction was used for 1 h with solid to liquid ratio of 1:20 (g ml–1) at 80 °C. After centrifugation, the supernatant was mixed with 10% trichloroacetic acid and left for 24 h to remove protein. Centrifuged again, and the supernatant was mixed with anhydrous alcohol, and was let stand at 4 °C overnight. The residue was washed twice using anhydrous ethanol, acetone, anhydrous diethyl ether, then freeze-dried. Subsequently, the extracted polysaccharide was processed using an in vitro digestion model (SUN et al., 2011). Finally, the sea buckthorn polysaccharide digestate was freeze-dried. The monosaccharide composition of sea buckthorn polysaccharide digestate was published in our earlier research (LI et al., 2016).
1.3. In vitro research
1.3.1. Individual treatment of bacterial strains with the tested compounds in vitro. The three strains : B. longum subsp. longum (ATCC 15707, American Type Culture Collection, Manassas, USA), an aerobic bacterium E. coli K12 (CGMCC 1.1771, the China General Microbiological Culture Collection Center, Beijing, China), and a strict anaerobic pathogenic bacterium C. perfringens (ATCC 13124) were chosen to represent strains existing in human faeces.
A single colony of E. coli was picked and subcultured twice in sterile Luria–Bertani broth (all media in this study were obtained from Beijing Land Bridge Technology, Beijing, China) for 12 h at 37 °C with shaking (148 r.p.m.) to prepare E. coli inoculum. Similarly, a single colony of B. longum subsp. longum was mixed with BBL broth, and a single colony of C. perfringens was introduced to brain heart infusion medium, both incubated at 37 °C under anaerobic conditions for 24 h to make B. longum subsp. longum and C. perfringens cultures.
The concentrations of these cultures were 108–109 CFU ml–1.
Ten millilitres of the culture of the three representative strains were mixed with 0.5, 1.0, 2.0, 3.0, 4.0, 5.0, and 6.0 mg of polysaccharide digestate or 0. 8, 1.6, 3.2, 6.4, 12.8, 25.6, and
51.2 μg of quercetin and GA, after their OD600 values had been adjusted to 0.2 (the concentrations of these cultures were 107–108 CFU ml–1). Sterile water with no nutrient additives was used as control. After that, the mixture was cultured under the same conditions as above. The number of colony-forming units (CFU) was determined by counting colonies after plating onto BBL agar medium base and culturing at 37 °C under anaerobic conditions for 24 h for B. longum subsp. longum, and plating onto sulfadiazine agar base for 48 h to detect C. perfringens. In terms of E. coli, the culture was plated onto Luria–Bertani agar and cultured for 18 h.
1.3.2. Effects of combined treatments with the tested compounds on bacterial growth in vitro. With polysaccharide, quercetin, and GA solutions were made with concentrations of 20, 0.2, and 2 mg ml–1, respectively. To investigate their individual and combined effects on the growth of the representative strains, a multiple linear regression model was applied. To 1.0 ml of active bacterial culture of OD600 = 0.2 (containing approximately 107–108 CFU ml–1) polysaccharide, quercetin, and GA solutions were added in amounts of 32, 50, and 5 μl, respectively, in 6 parallels, individually and in combinations, fi lled up to 87 μl with sterile water. Forty-four additional samples were prepared by randomly adding to the bacterial culture from the three solutions fi lled up to 400 μl. Next, 300 μl of the obtained mixtures were poured into 100-well microplates in triplicate and incubated at 37 °C for 24 h under aerobic conditions for E. coli, or anaerobically for B. longum subsp. longum and C.
perfringens.
The optical densities at 600 nm were recorded at 30-min intervals using a Bioscreen CMBR Reader (Oy Growth Curves Ab Ltd., Helsinki, Finland). The measurements of the optical densities of the strains were fi tted with the three-phase linear model. Two growth parameters, μmax (maximum growth rate, slope of the linear exponential phase) and λ (time of lasting lag phase) were recorded. Tlog (predicted lasting time of the tested bacteria), with the formula Tlog=λ+1/μmax used by TANG and co-workers (2013), was chosen instead of the traditional index N0 (log10 of initial bacterium population) and Nmax (log10 of fi nal population density), since the assay could not distinguish living or dead bacteria.
1.4. In vivo research
1.4.1. Animals. Twenty-fi ve female kunming mice (6–8 weeks old), weighing 31±3 g, were obtained from the Beijing Vital River Laboratories of China. After an acclimatisation period of 1 week, animals were divided into fi ve dietary groups, each of which was comprised of fi ve animals. Animals were kept at 24±1 °C with 12 h light-dark cycles, and were given free access to basal feed, which was obtained from Beijing Keaoxieli Fodder Co., Ltd (Beijing, China).
1.4.2. Diets. Unlike the in vitro research, in this in vivo study, tested nutrients were changed from polysaccharide digestate, quercetin, and GA to non-digested polysaccharide, quercetin-3-O-glucoside, and propyl gallate.
The experimental group was fed by gavage with tested nutrients diluted with sterile water, whereas the control group was fed with the same volume of sterile water. The treatment was carried out once per day for 30 days. Group 1 was treated with 1800 mg kg–1 of polysaccharide only, whereas group 2 and group 3 received 34 mg kg–1 of quercetin-3-O- glucoside and propyl gallate, respectively. Group 4 was treated with the mixture of all three tested compounds.
1.4.3. Real-time PCR. DNA of fresh rat faeces was extracted from each faecal sample using a TIANamp stool DNA kit (DP328, Tiangen Biotec h Co., Ltd. Beijing, China) following the manufacturer’s instructions.
The bacterial groups were targeted using specifi c primers for PCR. The primers for E.
coli (5′GTTAATACCTTTGCTCATTGA ACCAGGGTATCTAATCCTGTT3′), Bifi do bacte- rium (5′GGGTGGTAATGCCGGATGTAAGCCATGGACTTTCACACC3′), and C. perfrin- gens (5CCGTTGATAGCGCAGGACACCCAACTATGACTCATGCTAGCA3′) (ZHAO et al., 2011) were synthesised by Invitrogen Trading Co., Ltd. Shanghai, China.
All PCR reactions were performed in 20 μl reaction solutions using Ultra SYBR Mixture (CW0957, Beijing Com Win Biotech Co., Ltd. Beijing, China) including DNA templates (1 μl), primers (1 μl), Mix (10 μl), and RNase-Free water (8 μl). Reactions were run in a Line Gene 9600 Sequence Detection System device (FQD-96A, Hangzhou Bioer Technology Co., Ltd. Zhejiang, China) according to the following PCR program to detect the Bifi dobacterium group and the C. perfringens group: 10 min at 95 °C, 40 cycles of 10 s at 95 °C, and 30 s at 62 °C. They were run according to the following PCR program to detect the E. coli group: 10 min at 95 °C, 40 cycles of 15 s at 95 °C, and 60 s at 60 °C. All reactions were performed in triplicate. The number of genome copies was calculated using a standard regression curve of Ct values generated from DNA samples of known genome copies. The base-pairs numbers of Bifi dobacterium, E. coli, and C. perfringens were 437 bp, 340 bp, and 219 bp, respectively.
1.5. Statistical analysis
Data were reported as means ± standard deviations (SDs). Data of individual effect of the tested compounds on the tested strains in vitro were analysed using linear regression analysis.
Real-time PCR data were analysed using group mean comparisons with LSD means. All statistical analyses were performed using the IBM SPSS 20 (IBM Corp. New York, USA).
2. Results and discussion
2.1. Individual effect of the tested compounds on the tested strains in vitro
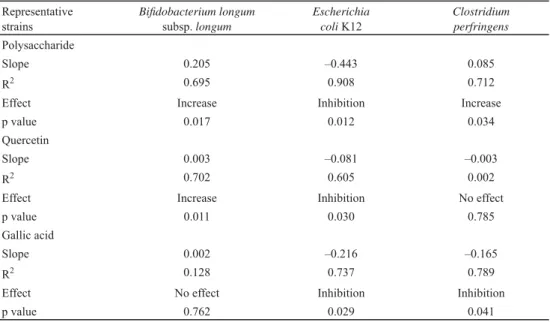
The regulating effects of single nutrients or all three nutrients on the three tested strains in vitro are shown in Table 1.
Correlation analysis demonstrated that an increased amount of polysaccharide led to increased growth of both B. longum subsp. longum and C. perfringens and to decrease in growth of E. coli. Moreover, the 0.205 slope of the B. longum subsp. longum curve was greater than the 0.085 slope for C. perfringens, indicating that the response of B. longum subsp. longum to increased polysaccharide levels was even greater than that of C. perfringens.
Notably, E. coli K12 showed the most obvious response to polysaccharide treatment among the three tested strains, with a slope of –0.443. Quercetin had no effect on C. perfringens, and had little effect on the growth of B. longum subsp. longum and E. coli, which slopes of 0.003 and –0.081, respectively.
GA treatment did not affect the growth of B. longum subsp. longum, as no signifi cant linear correlation was found (coeffi cient of 0.128).
Furthermore, the –0.216 slope of E. coli was greater than the –0.165 slope for C.
perfringens, indicating that GA had a stronger inhibitory effect on E. coli K12 than on C.
perfringens. LEE and co-workers (2006) also found that cert ain pathogenic bacteria such as
C. perfringens and Clostridium diffi cile were signifi cantly repressed by GA, while probiotics such as Bifi dobacterium sp. and Lactobacillus sp. were less severely affected.
Table 1. Impact of single nutrients treatment on three representative strains Representative
strains
Bifi dobacterium longum subsp. longum
Escherichia coli K12
Clostridium perfringens Polysaccharide
Slope 0.205 –0.443 0.085
R2 0.695 0.908 0.712
Effect Increase Inhibition Increase
p value 0.017 0.012 0.034
Quercetin
Slope 0.003 –0.081 –0.003
R2 0.702 0.605 0.002
Effect Increase Inhibition No effect
p value 0.011 0.030 0.785
Gallic acid
Slope 0.002 –0.216 –0.165
R2 0.128 0.737 0.789
Effect No effect Inhibition Inhibition
p value 0.762 0.029 0.041
Comparison of results (p value) within different treatments from Student’s t-test.
2.2. Combined effect of the tested compounds on bacterial growth in vitro
The linear regression models of growth for the three tested strains with three combined nutrients are represented as follows: Y=AX1+BX2+CX3, where X1, X2, and X3 represent the amount of polysaccharide, quercetin, and GA added, respectively. A, B, and C represent the impact on the strains’ growth under each condition. Higher values of A, B, and C correspond to a stronger impact on strain growth.
For B. longum subsp. longum, the linear regression was Y=0.675X1+0.393X2, indicating that both polysaccharides and quercetin increased the growth and that the effect of polysaccharide treatment was greater than that of quercetin treatment. No value is shown for C, because the validity threshold of P>0.05 for the regression coeffi cients was not reached, which indicates that there was no signifi cant correlation between GA treatment and B. longum subsp. longum growth. Similarly, the linear regression was Y= –0.96X1–0.19X3 for E. coli K12, demonstrating that polysaccharides and GA have an inhibitory effect on E. coli K12, and that the inhibitory effect of polysaccharides is greater than that of GA. Quercetin treatment did not have any effect on growth. The linear regression for C. perfringens was Y=0.979X1+0.353X2–0.435X3, indicating that adding polysaccharides and quercetin increased C. perfringens growth, and that polysaccharides had greater effect than quercetin.
Conversely, GA treatment caused growth inhibition.
2.3. In vivo batch fermentation
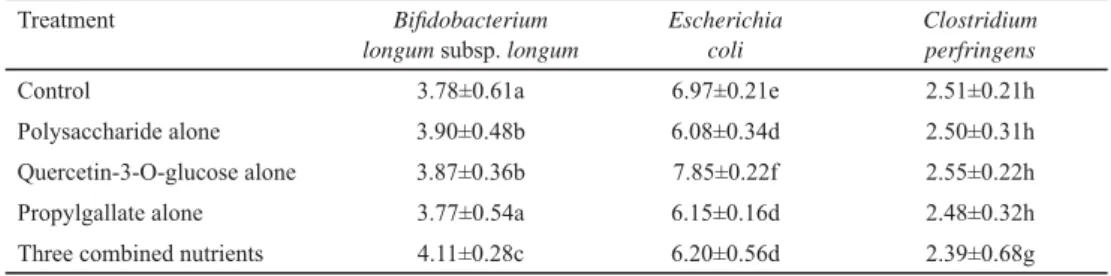
The regulating effects of single nutrients or all three nutrients on the three tested bacteria in mouse faeces are shown in Table 2.
Table 2. Real-time PCR quantifi cation of genome copies in three representative species from the faeces of mice fed individual and combined nutrients
Treatment Bifi dobacterium
longum subsp. longum
Escherichia coli
Clostridium perfringens
Control 3.78±0.61a 6.97±0.21e 2.51±0.21h
Polysaccharide alone 3.90±0.48b 6.08±0.34d 2.50±0.31h
Quercetin-3-O-glucose alone 3.87±0.36b 7.85±0.22f 2.55±0.22h
Propylgallate alone 3.77±0.54a 6.15±0.16d 2.48±0.32h
Three combined nutrients 4.11±0.28c 6.20±0.56d 2.39±0.68g
Values (log10 genome copies/g-wet weight faeces) are reported as means ± standard deviation (n=5). Within a given column, treatments with different letters are statistically different from each other (overall α=0.05, Tukey’s correction).
The number of genome copies of the Bifi dobacterium group increased (P<0.05) compared with the control after feeding polysaccharide or quercetin-3-O-glucoside alone to mice. As a result, feeding the mice a blend of three nutrients further promoted the Bifi dobacterium group compared with feeding them polysaccharide or quercetin-3-O- glucoside alone. E. coli genome copies decreased signifi cantly after feeding the mice polysaccharide, propylgallate, and the three combined nutrients, although there were no signifi cant differences (P>0.05) among the latter. In contrast, the number of E. coli genome copies in mouse faeces increased signifi cantly after feeding quercetin-3-O-glucoside alone, which failed to support our earlier conclusion. This is possibly because the sample was contaminated by E. coli during faeces collection or DNA extraction.
However, no signifi cant impact was found on the number of C. perfringens genome copies compared with the control after feeding any single nutrients. A slight decrease in the number of C. perfringens genome copies (P<0.05) was observed only in the group fed a blend of three nutrients compared with the control.
Although a single quercetin treatment had little effect on the growth of all tested bacteria in vitro and C. perfringens was not impacted by all tested compounds in vivo, both in vitro and in vivo research showed a single polysaccharide treatment could enhance Bifi dobacterium growth, suppress E. coli growth, and a single GA treatment could inhibit C. perfringens growth. These data revealed that feeding rats a blend of the three nutrients is better than feeding any single prebio tics. These fi ndings are similar to the very recent report that feruloylated xylooligosaccharides showed even higher prebiotic activity than xylooligosaccharides obtained by detecting microbiota profi les in rat faeces through 16S rRNA sequencing (OU et al., 2016).
According to the traditional concept, after the intake of polysaccharides, short-chain fatty acids could be produced by polysaccharide fermentation inhibiting pathogens. However, the latest report showed that the concentration of butyric acid in faeces of laying hens was higher (5.48 μmol g–1) with a basal diet + tea polyphenols than with a basal diet only (3.04
μmol g–1), and the ratio of Lactobacillus spp./E. coli decreased from 3.10 to 2.83 with adding tea polyphenols and no tea polyphenols administration, respectively, which revealed that adding tea polyphenols could save butyric acid and further enhance the prebiotic effect of single polysaccharides (YUAN et al., 2016).
3. Conclusions
Both in vitro and in vivo study indicated that a single polysaccharide treatment could increase the growth of Bifi dobacterium spp. as well as C. perfringens. Otherwise, although a single GA treatment could inhibit the growth of E. coli and C. perfringens, the Bifi dobacterium spp.
growth was not stimulated. Only treatment by polysaccharide combined with quercetin and GA, increased Bifi dobacterium growth while decreasing growth of C. perfringens.
*
This study was fi nancially supported by the student training program of Beijing Forestry University (S201410022038).
References
ARIMBOOR, R., KUMAR, S.K. & ARUMUGHAN, C. (2008): Simultaneous estimation of phenolic acids in sea buckthorn (Hippophae rhamnoides) using RP-HPLC with DAD. J. Pharmaceut. Biomed. Anal., 47, 31–38.
BARRY, K.A., WOJCICKI, B.J., MIDDELBOS, I.S., VESTER, B.M., SWANSON, K.S. & FAHEY, G.C. JR. (2010): Dietary cellulose: Fructo-oligosaccharides, and pectin modify fecal protein catabolites and microbial populations in adult cats. J. Anim. Sci., 88, 2978–2987.
DAI, L.F., ZHAO, Y.X., TIAN, M. & FU, Y.H. (2011): Study of impacts of sea buckthorn leaf extract on mice’s intestine peristalsis and defecation. Heilongjiang Medicine Journal, 24, 703–704. (in Chinese)
GUAN, Q., YANG, W.Z. & WEN, Z.P. (2005): Extraction of polysaccharide from sea buckthorn pericarp and leaves and its bacteriostasis research. The Global Seabuckthorn Research and Development, 3, 17–20. (in Chinese) KIM, J.S., KWON, Y.S., SA, Y.J. & KIM, M.J. (2011): Isolation and identifi cation of sea buckthorn (Hippophae
rhamnoides Linn.) phenolics with antioxidant activity and α-glucosidase inhibitory effect. J. Agr. Food Chem., 59, 138–144.
KONISHI, Y., KOBAYASHI, S. & SHIMIZU, M. (2003): Transepithelial transport of p-coumaric acid and gallic acid in Caco-2 cell on layers. Biosci. Biotech. Bioch., 67, 2317–2324.
LEE, H.C., JENNER, A.M., LOW, C.S. & LEE, Y.K. (2006): Effect of tea phenolics and their aromatic fecal bacterial metabolites on intestinal microbiota. Res. Microbiol., 157, 876–884.
LI, G.P, ZHANG, J.C., LIU, E.C., WANG, F.H., QI S.L., XIANG, X.X. & DU, W.M. (2016): Process affects the function of improving fecal microfl ora in sea buckthorn leaf tea via changing levels of phytochemicals. J. Food Nutr.
Res., 55, 205 –213.
OU, J.Y., HUANG, J.Q., SONG, Y., YAO, S.W., PENG, X.C., WANG, M.F. & OU, S.Y. (2016): Feruloylated oligosaccharides from maize bran modulated the gut microbiota in rats. Plant Food Hum. Nutr., 71, 123–128.
PARKARA, S.G., TROWERA, T.M. & STEVENSON, D.E. (2013): Fecal microbial metabolism of polyphenols and its effects on human gut microbiota. Anaerobe, 23, 1 2–19.
SUN, J.H., LIM, B.O., DECKER, E.A. & MCCLEMENTS, J. (2011): In vitro human digestion models for food applications.
Food Chem., 125, 1–12.
TANG, S.L., STASIEWICZ, M.J., WIEDMANN, M., BOOR, K.J. & BERGHOLZ, T.M. (2013): Effi cacy of different antimicrobials on inhibition of Listeria monocytogenes growth in laboratory medium and on cold-smoked salmon. Int. J. Food Microbiol., 165, 265–275.
YUAN, Z.H., WANG, J.P., ZHANG, K.Y., DING, X.M., BAI, S.P., ZENG, Q.F., XUAN, Y. & SU, Z.W. (2 016): Effect of vanadium and tea polyphenols on intestinal morphology, microfl ora and short-chain fatty acid profi le of laying hens. Biol. Trace Elem Res., 174, 419–427.
ZHAO, L., XU, W., IBRAHIM, S.A., JIN, J., FENG, J., JIANG, J.L., MENG, J.J. & REN, F.Z. (2011): Effect of age and region on fecal microfl ora in elderly subjects living in Bama Guangxi, China. Curr. Microbiol., 62, 64–70.