Title Page
Title: Longitudinal analysis of aEEG for outcome prediction in hypoxic-ischemic encephalopathy
Short title: Longitudinal analysis of aEEG in asphyxiated infants
Authors: Unoke Meder1 MD, Anna J Cseko1 MD, Laszlo Szakacs1, Csenge D Balogh1 MD, Eniko Szakmar1 MD, PhD, Csilla Andorka1 MD, Kata Kovacs1 MD, PhD, Marianna Dobi1 MD, Ferenc A Brandt1 MD, Miklos Szabo1 MD, PhD, Attila J Szabo1,2 MD, PhD, DSc, Agnes Jermendy1 MD, PhD
Affiliations:
1 1st Department of Pediatrics, Semmelweis University, Budapest, Hungary
2 1st Department of Pediatrics, Semmelweis University, Budapest, Hungary; MTA-SE Pediatric and Nephrology Research Group, Budapest, Hungary
Address correspondence to: Agnes Jermendy, MD, PhD, MPH
E-mail: jermendy.agnes@med.semmelweis-univ.hu Business telephone: +36-204600798
Fax number: +36-13138212
Work address: 53 Bokay ut, Budapest, 1083 Hungary Reprints: We do not request any reprints.
List of key words not in the title: amplitude-integrated electroencephalography, asphyxia, newborn, brain function, seizure, therapeutic hypothermia, score
Funding Source: U.M. and A.J. were supported by the Higher Education Institutional Excellence Program of the Ministry for Innovation and Technology in Hungary, within the framework of the Neurology thematic program of the Semmelweis University.
*Manuscript (pgs numbered), including title pg and abstract Click here to view linked References
Potential Conflicts of Interest: The authors have no conflicts of interest relevant to this article to disclose.
Abbrevations: aEEG amplitude-integrated electroencephalogram, HIE hypoxic- ischemic encephalopathic, TH therapeutic hypothermia, MDI mental development index, PDI psychomotor development index, AUC ROC area under receiver operator characteristic curve MRI magnetic resonance imaging, CNV continuous normal voltage, DNV discontinuous normal voltage, BS burst suppression, LV low voltage, FT flat trace, SD standard deviation, IQR interquartile ranges
ABSTRACT
Objective: To investigate the prognostic accuracy of longitudinal analysis of amplitude- integrated electroencephalogram (aEEG) background and seizure activity to predict long-term neurodevelopmental outcome in hypoxic-ischemic encephalopathic (HIE) neonates receiving therapeutic hypothermia (TH).
Study design: Prospective single-center cohort study of 149 neonates with moderate-to-severe HIE, gestational age ≥ 35 weeks at a tertiary Neonatal Intensive Care Unit. Single-channel aEEG background and seizure activity was monitored over 84 hours during TH and rewarming, then scored for every 6-hour interval. Neurodevelopmental outcome was assessed using Bayley Scales of Infant Development (Second Edition). Good outcome was defined as having both mental development index (MDI) and psychomotor development index (PDI) scores ≥ 70 while poor outcome was defined as either MDI or PDI < 70 or death. Regression modelling for longitudinal analysis of repeatedly measured data with 5-fold cross validation was applied, and area under receiver operator characteristic curve (AUC) was calculated.
Results: Ninety-three (62%) patients had good and 56 (38%) had poor outcome. Longitudinal aEEG background analysis combined with the information on both electrographic and clinical seizures had excellent predictive value (AUC: 0.90 (95% CI 0.85-0.95), better than single aEEG scores at any time point. The reclassification rate of this model compared to the conventional analysis of aEEG background at 48 hours was 19% (26 patients), of which 14% (19 patients) were reclassified correctly. An online outcome prediction tool was developed based on our data.
Conclusions: Longitudinal analysis of aEEG background and seizure activity is a valuable and accurate prognostic tool.
INTRODUCTION
Amplitude-integrated electroencephalogram (aEEG) is a bed-side tool that allows real- time monitoring of cerebral activity in neonates, primarily during hypoxic-ischemic encephalopathy (HIE).
The three key prognostic features of aEEG monitoring are background pattern, the emergence of sleep-wake cycling and seizure activity during the first days of life. Several studies and meta-analyses concluded that a persistently abnormal background aEEG pattern at 48 hours or beyond during hypothermia treatment1,2,3,4 or the lack of sleep-wake cycles by 96 hours of life are strong predictors of adverse neurodevelopmental outcome. 5,6,7 Less data is available regarding early seizures, but seizure activity is generally related to poor outcome,8,9 and high seizure burden was described as an independent predictor of brain injury on magnetic resonance imaging (MRI).10
Although it may seem to be an attractive approach to analyze a single cross-sectional segment, it will not take into consideration fluctuations of generalized trends, and may lead to information loss in individual patients. We hypothesized that a longitudinal analysis of aEEG background activity during TH and the subsequent rewarming period would better reflect the evolution pattern of brain injury. We analyzed the aEEG and seizure activity over the first 84 hours of life in 6-hour intervals in a large cohort of neonates diagnosed with HIE treated with TH. Our aim was to determine the predictive power of aEEG longitudinal analysis on long- term neurodevelopmental outcomes and evaluate the effect of electrographic and/or clinical seizures, sedation or anticonvulsive treatment and blood gas values.
METHODS Study design
This was a prospective single-center cohort study conducted in the Neonatal Intensive Care Unit of the 1st Department of Pediatrics, Semmelweis University Budapest, Hungary. The study was approved by the Ethics Committee of the National Medical Research Council (ETT- TUKEB 11790-2/2016/EKU).
Participants
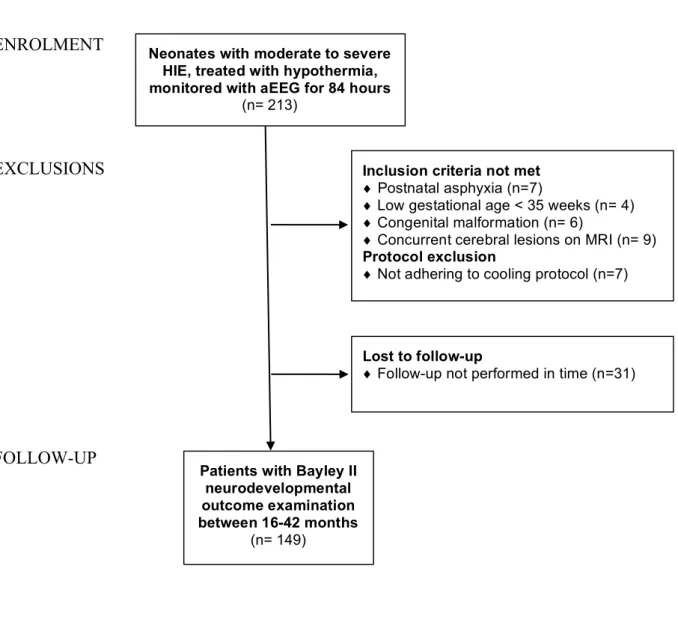
We enrolled 213 consecutive neonates born between January 2013 and July 2018, diagnosed with moderate-to-severe HIE.11 Whole-body cooling was induced as described in the TOBY trial; initiated within the first 6 hours of life, maintained for 72-hours, followed by gradual rewarming.12 Exclusion criteria were gestational age of <35 weeks, postpartum asphyxia, congenital malformation or concurrent cerebral lesions. Patients where the cooling protocol or follow-up requirements were not adhered to were excluded. The CONSORT flow- diagram of enrolment is shown in Figure 1 (online).
Equipment
Cerebral activity was recorded using continuous single channel (biparietal, P3-P4) aEEG monitoring (Olympic CFMTM 6000 Monitor, Olympic Medical, Natus Medical Incorporated, EEG-1200K Nihon Kohden Corporation). The signal was filtered to exclude frequencies lower than 2 Hz and higher than 20 Hz, rectified and displayed in microvolts on a semi-logarithmic scale at a speed of 6 cm per hour. Recording was started as soon as possible, but always before 6 hours of age, continued for the duration of therapeutic hypothermia and rewarming period for a total of 84 hours of study period.
Scoring
The aEEG background activity was scored for every 6-hour interval, converting the Hellström-Westas criteria13 to a numeric value: continuous normal voltage (CNV: score 1),
discontinuous normal voltage (DNV: score 2), burst suppression (BS: score 3), continuous low voltage (LV: score 4) and flat trace (FT: score 5).
The frequency and duration of electrographic and clinical seizures in each interval was documented (0: no seizure, 1: seizure with duration less than 15 minutes, 2: repetitive seizures or lasting longer than 15 minutes or status epilepticus). The first appearance of sustained CNV or DNV (lasting over a 3-hour period) on the aEEG was defined as aEEG recovery.
Clinical care
All patients were mechanically ventilated during the hypothermia treatment as per our protocol. First line sedation was morphine sulphate infusion (loading dose of 100 µg/kg, followed by continuous infusion of 10 µg/kg/hour) adjusted based on response. Second line sedation was midazolam (boluses of 100 µg/kg or continuous infusion of 100 µg/kg/hour as required). Our first line anticonvulsive treatment was phenobarbital sodium (loading dose of 20 mg/kg, maintenance dose: 5 mg/kg/day). Repetitive seizures / status were treated with either a second loading dose of phenobarbital or phenytoin sodium (loading dose of 20 mg/kg, maintenance: 4 mg/kg/day) or levetiracetam (loading dose: 30 mg/kg, maintenance dose: 20 mg/kg 12 hourly).
MRI was performed on 136 (91%) infants at a median age of 4.7 days at the Medical Imaging Center, Semmelweis University, Budapest, on a 3 Tesla Philips Achieva scanner (Philips Medical System, Best, The Netherlands). T1 and T2 diffusion-weighted images with apparent diffusion coefficient measurement were performed and were scored according to the grading system developed by Barkovich et al.14,15 MRI scans were classified as either no injury, mild injury (score of 1 in the deep nuclear grey matter or a score of 1-3 in a watershed pattern) or moderate-severe brain injury (score of >1 of in the deep nuclear grey matter or a score of ≥3
in a watershed pattern).
Neurodevelopmental outcome
Bayley Scales of Infant Development (Second Edition) score was used to assess neurodevelopmental outcome.16 The follow-up appointment was at 16-42 months of age undertaken by a trained pediatrician or psychologist blinded to the clinical history. Good outcome was defined as having both mental development index (MDI) and psychomotor development index (PDI) scores ≥ 70 while poor outcome was defined as either MDI or PDI <
70 or death.
Statistical analysis
Descriptive statistics are presented as mean standard deviation (SD) or median with interquartile ranges (IQR) for continuous variables and as percentage (%) for categorical variables. Student’s t test or Mann-Whitney test was used to compare continuous variables, as appropriate, while Fisher’s exact test was used for categorical variables. Interrater reliability of aEEG scoring was analyzed using intraclass correlation coefficient (ICC) in 100 randomly selected 6-hour periods.
To calculate the predictive power of aEEG background activity, as a reference, we first analyzed the predictive power of numerical scores for each individual 6-hour period using the area under receiver operator characteristic curve (AUC-ROC). Next, we used seven different regression methods17 to handle a repeatedly measured predictor over time (aEEG background pattern in 6-hour intervals). Specific details of the mathematical models can be found online (Prediction model development). The best model, that was based on the linear regression slope- coefficient and the mean of aEEG scores in each patient, was then validated with 5-fold cross validation repeated 1000 times to ensure the generalizability of our results (our dataset was partitioned for 5 rounds into complementary subsets, the analysis was performed on the training subsets and then validated on the other subset before the averaged validation results were
reported). We accepted p<0.05 as a level of significance. R Statistical Software, Version 4.0.3 (R Foundation for Statistical Computing, Vienna, Austria) and GraphPad Prism, Version 9.0.2.
(GraphPad Software, San Diego, CA, USA) were used for data analysis and plotting.
RESULTS
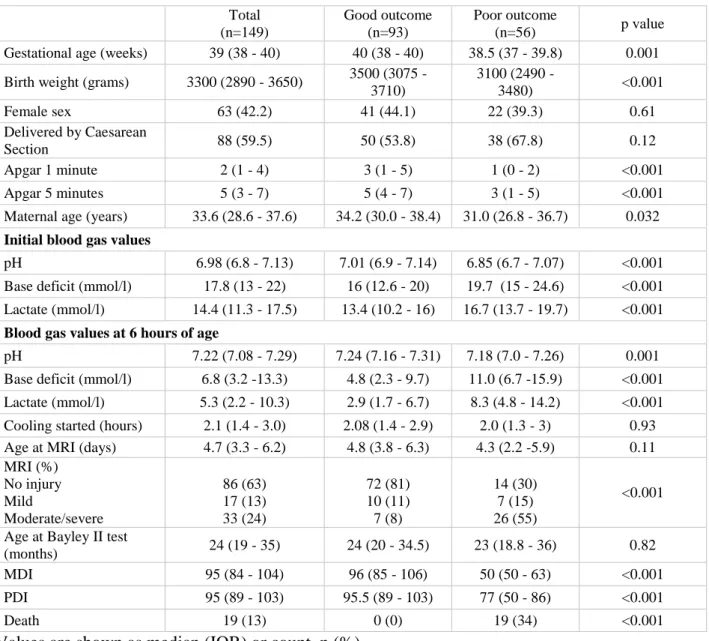
A total of 149 infants were included in our study after exclusions. Demographic and clinical characteristics of the population are shown in Table 1. Neurodevelopmental outcome assessment was performed at a median age of 24 months (IQR 19-35) with 93 (62%) patients classed as having good and 56 (38%) as poor outcome. Patients with poor outcome had a lower mean gestational age, birth weight, worse Apgar scores and initial blood gas values. A total of 19 (13%) infants deceased, 10 of whom died within the 84-hour study period.
aEEG background pattern
The aEEG background pattern for each interval was assessed by two neonatologists blinded to the participants’ clinical history. Interrater reliability was high (ICC=0.915 (95% CI:
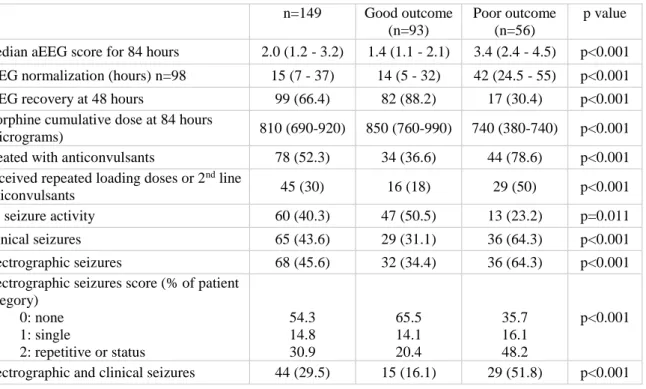
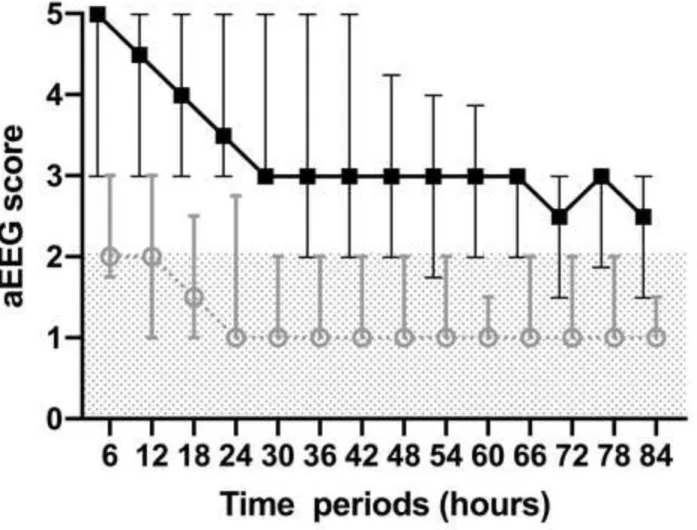
0.865, 0.946, Cohen's =0.92). Median aEEG scores were analyzed in 6-hour intervals and improved with time in both outcome groups (Figure 2). There was a significant difference in the median aEEG scores calculated for 84 hours between the good and poor outcome groups (3.4 vs. 1.4 respectively, p<0.0001, Table 2).
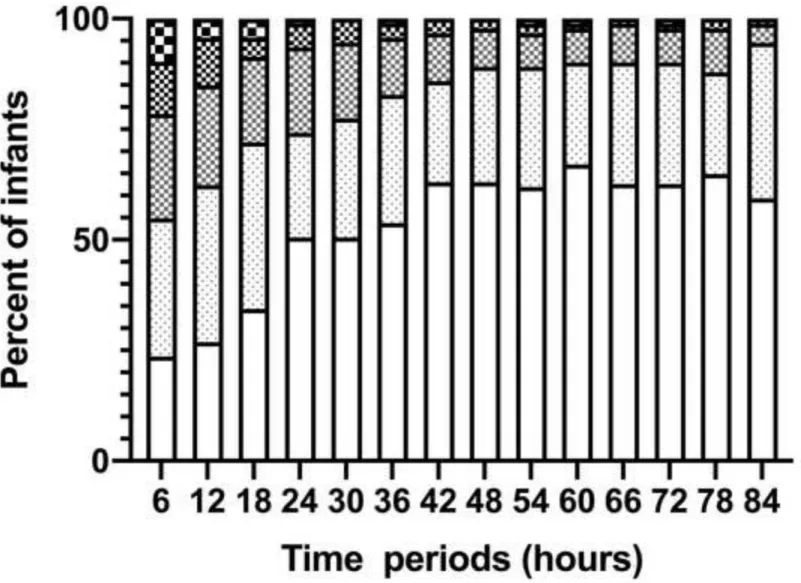
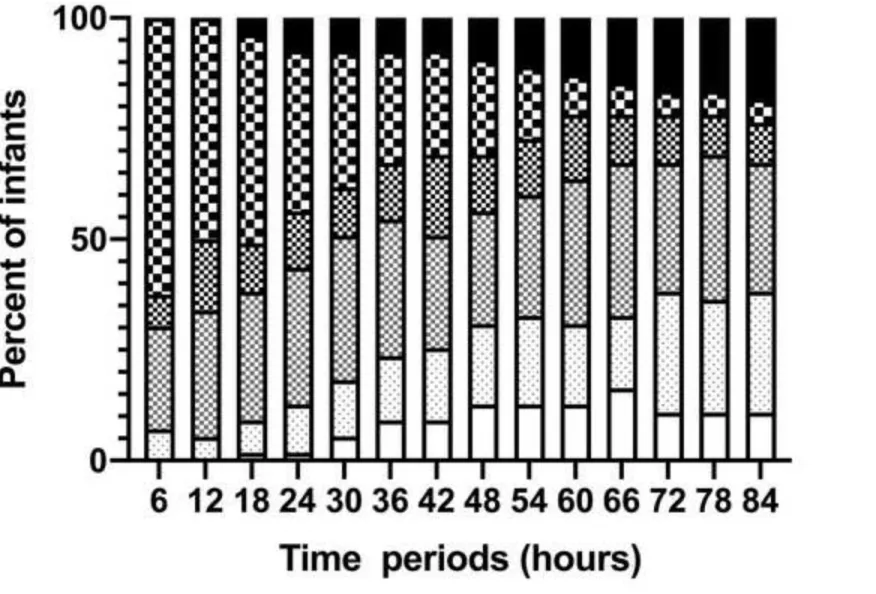
Further analysis of the aEEG background pattern in the two outcome groups is shown in Figure 3. CNV was observed in 22 infants (24%) at 6 hours, 58 (63%) at 48 hours and 54 (59%) at 84 hours in the good outcome group, while in the poor outcome group, no infant had CNV at 6 hours, 7 (13%) at 48 hours and 6 (11%) at 84 hours.
At 84 hours, aEEG recovery was attained in 86 (95%) patients in the good outcome group, and 21 (38%) in the poor outcome group.
Seizures
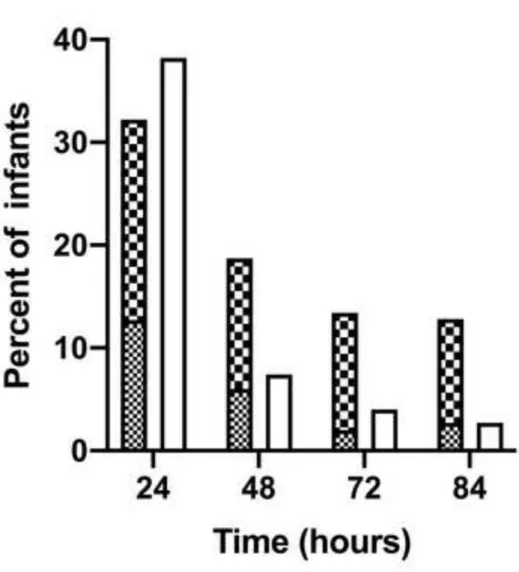
During the 84 hours of the study period, clinical seizures were observed in 65 infants (44%), while electrographic seizures occurred in 68 (46%) both of which were more frequent in the poor outcome group (Table 2). The majority (70.5%) of the first electrographic seizures appeared within the first 24 hours. Electrographic and clinical seizures were detected in 44 (29%) infants. There were 60 infants (40%) who had neither clinical nor electrographic seizures. The distribution of seizure activity over time is shown in Figure 4 (online).
Prediction
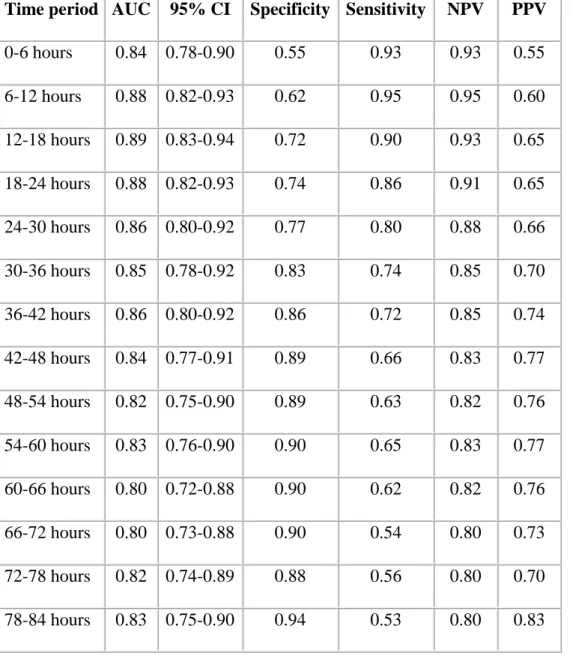
The predictive power of longitudinal aEEG analysis on neurodevelopmental outcome was evaluated using a three-step approach. First, we tested the performance of numerical aEEG scores for each 6-hour period in classifying infants to good and poor outcome groups using AUC-ROC analysis. The specificity for outcome prediction increased from 0.55 at 6 hours to 0.94 at 84 hours, while the sensitivity decreased from 0.93 at 6 hours to 0.53 at 84 hours (Table 3. online). There were 5 patients with abnormal aEEG background activity at 84 hours who had a good outcome.
Secondly, we applied several different mathematical models17 to incorporate longitudinal predictor informationfrom repeatedly measured aEEG background activity (Table 4. online, and Prediction model development online). We used a statistically rigorous approach to avoid over fitting, and the best regression model yielded an AUC of 0.90 (95% CI 0.85-0.95).
Next, we tested the effect of further covariates on outcome prediction. The presence of both electrographic and clinical seizures during the study period was found to slightly increase the predictive power (AUC: 0.91 (95% CI 0.86-0.96), sensitivity: 0.78, specificity: 0.88) (Figure
5.). Other variables including blood gas values (pH, BE, lactate), cumulative sedative or anticonvulsive treatment did not significantly improve outcome prediction.
Finally, we performed a 5-fold cross validation repeated 1000 times, to ensure generalizability, which yielded an AUC of 0.90 (95% CI 0.85-0.95). The reclassification rate of this model compared to the conventional analysis of aEEG background at 48 hours was 19%
(26 patients), of which 14% (19 patients) were reclassified correctly (17 patients from poor to good outcome).
Based on these results, we developed an online outcome prediction tool and made it available at https://suneonatalgroup.shinyapps.io/aeegpredictiontool/ to be trialed for clinical use.
DISCUSSION
Our results suggest that in HIE patients treated with TH longitudinal analysis of aEEG background and seizure activity over 84 hours in 6-hour intervals had a higher predictive value for neurodevelopmental outcome than analyzing the aEEG at distinct time points. When compared with a conventional prediction model, our results have led to correct reclassification in 14% of the neonates, the majority of whom were reclassified from poor to good outcome groups.
The prognostic performance of aEEG monitoring in infants with HIE has been studied extensively before on smaller patient populations 3-6,18 and in combination with near infrared spectroscopy.19,20 As therapeutic hypothermia became standard practice in HIE, the pattern of changes in aEEG has been shifted in time, most likely due to the neuroprotective effects of cooling.6
A large meta-analysis based on a population extracted from three small studies assessed the role of aEEG as a prognostic tool on long-term development. When stratified for patients
receiving hypothermia, they found an AUC of 0.86, 0.85 and 0.91 at 24, 48 and 72 hours, respectively, with a maximum predictive reliability achieved at 72 hours of life.1 These data are comparable to our results based on aEEG scores in respective single time periods. The most comprehensive meta-analysis to date included 187 patients and reported pooled sensitivity and specificity values to describe the predictive value of abnormal aEEG background activity in cooled encephalopathic neonates.2 They calculated a sensitivity of 0.95, 0.85 and 0.67, and specificity of 0.75, 0.93 and 0.97 at 24, 48 and 72 hours of life, respectively. Of note, in this analysis, only CNV background activity was considered as normal. These results are again similar to our findings in the pre-defined time points. Finally, a recently published review based on nine studies analyzed the long-term predictive power of various clinical tests in encephalopathic neonates.21 Their prediction of an unfavorable neurodevelopmental outcome using aEEG background activity during the immediate postnatal period had an AUC 0.78, which is considerably lower than that of the longitudinal analysis proposed by our group.
Seizure activity in HIE infants is reported in several publications, however, there seems to be a lack of consistency in the categories used. The association between seizure activity and short term (MRI) outcome, independent of aEEG background, was described in a study of 85 HIE infants treated with TH.10 It was found that 52% of the patients had seizures detectable on aEEG, 35% of which were repetitive or status epilepticus. This was confirmed by our findings.
Multimodal cross-sectional evaluation was used by another group, where they combined aEEG background pattern, seizure activity and near-infrared spectroscopy data for short-term outcome prediction by MRI.19 Their combined AUC of 0.80, 0.84 and 0.67 at 24, 48 and 72 hours, respectively represents a considerably lower prognostic performance compared to our results.
Clearly, there are other factors that are worth taking into account that may influence long-term outcome, including the level of ongoing developmental care, the presence of a
supportive family background and socio-economic status or possibly unreported decision- making processes that a poor aEEG may have on redirecting the focus of care. In our cohort there were 5 infants with abnormal aEEG background activity at 84 hours who went on to have a good outcome. These findings are in line with previous publications and suggest that additional variables should be considered to refine the accuracy of prognosis.
The novelty of our approach is that instead of the conventional intermittent analysis, we propose a continuous evaluation of aEEG background activity. Using mathematical modelling, we were able to harness information about the variable’s trajectory or development over time, providing us with more accurate predictions than just single measurements.17
We recognized, that complex regression models are difficult to apply in everyday use and a simple model may be more appealing to clinicians. Therefore, we developed an open- access, online, user-friendly outcome prediction tool that makes our results easily applicable in clinical practice and presents results in the form of a subject specific probability of outcome.
As the concept of precision medicine becomes embedded in neonatology, individual risk assessment of neonates increasingly relies on continuous neurointensive monitoring.22,23 To the best of our knowledge, ours is the first online tool used for longitudinal aEEG data assessment, which has the potential to benefit both clinical and research purposes.
Admittedly, there are potential limitations to our study. Firstly, sleep-wake cycling were not consistently recorded when our study was commenced, so we could not include this data in our analysis. Secondly, 31 patients unfortunately had to be excluded as their neurodevelopmental follow-up was not performed within the required time, although an analysis of their demographic parameters did not show any significant difference from those included in the study. The results of internal validation are reassuring, but as the aEEG prediction tool is now available online, we hope that prospective external validation will become possible.
We believe however, that our study also has numerous strengths. Our 149 HIE infants receiving TH with continuous aEEG monitoring over 84 hours is one of the largest cohort reported to date. While most studies focus on early MRI findings as short term clinical outcome, our use of the Bailey II test performed at a median of 24-month age represented functional long- term neurodevelopmental outcome. Finally, the application of seven different mathematical models for longitudinal analysis of aEEG background activity is a novel approach and provided us with a robust process for determining the best outcome prediction method.
We conclude that longitudinal analysis of aEEG background and seizure activity is a valuable and accurate prognostic tool, which may assist clinicians in their discussion with families, help initiate early interventions and individualized treatment plans that are necessary to optimize outcomes for infants diagnosed with HIE. We hope our free online aEEG assessment tool will provide an accessible platform for our findings to be applied in daily clinical practice.
ACKNOWLEDGEMENT
We thank Dr Gusztav Belteki for his advice and comments on the manuscript. We also wish to thank our medical and nursing NICU team at the 1st Department of Pediatrics for the professional care and support in facilitating this study.
REFERENCES
1 Del Río R, Ochoa C, Alarcon A, Arnáez J, Blanco D, García-Alix A. Amplitude Integrated Electroencephalogram as a Prognostic Tool in Neonates with Hypoxic-Ischemic Encephalopathy: A Systematic Review. PLoS One. 2016;11(11):e0165744.
2 Chandrasekaran M, Chaban B, Montaldo P, Thayyil S . Predictive value of amplitude integrated EEG (aEEG) after rescue hypothermic neuroprotection for hypoxic ischemic encephalopathy: a meta- analysis. J Perinatol. 2017;37(6):684-9.
3 Csekő AJ, Bangó M, Lakatos P, Kárdási J, Pusztai L, Szabó M. Accuracy of amplitude-integrated electroencephalography in the prediction of neurodevelopmental outcome in asphyxiated infants receiving hypothermia treatment. Acta Paediatrica. 2013;102(7):707-11.
4 Skranes JH, Løhaugen G, Schumacher EM, Osredkar D, Server A, Cowan FM et al.
Amplitude-Integrated Electroencephalography Improves the Identification of Infants with Encephalopathy for Therapeutic Hypothermia and Predicts Neurodevelopmental Outcomes at 2 Years of Age. J Pediatr. 2017;187:34-42.
5 Massaro AN, Tsuchida T, Kadom N, El-Dib M, Glass P, Baumgart S et al. aEEG evolution during therapeutic hypothermia and prediction of NICU outcome in encephalopathic neonates.
Neonatology. 2012;102(3):197-202.
6 Thoresen M, Hellström-Westas L, Liu X, De Vries LS. Effect of hypothermia on amplitude-integrated electroencephalogram in infants with asphyxia. Pediatrics. 2010;126(1):e131-e9.
7 Osredkar D, Toet MC, van Rooij LG, van Huffelen AC, Groenendaal F, de Vries LS. Sleep- wake cycling on amplitude-integrated electroencephalography in term newborns with hypoxic- ischemic encephalopathy. Pediatrics. 2005 Feb;115(2):327-32.
8 Basti C, Maranella E, Cimini N, Catalucci A, Ciccarelli S, Del Torto M et al. Seizure burden and neurodevelopmental outcome in newborns with hypoxic-ischemic encephalopathy treated with therapeutic hypothermia: A single center observational study. Seizure. 2020;83:154-159.
9 Gluckman PD, Wyatt JS, Azzopardi D, Ballard R, Edwards AD, Ferriero DM et al. Selective head cooling with mild systemic hypothermia after neonatal encephalopathy: multicentre randomised trial. Lancet. 2005; 365(9460), 663–670.
10 Shah DK, Wusthoff CJ, Clarke P, Wyatt JS, Ramaiah SM, Dias RJ et al. Electrographic seizures are associated with brain injury in newborns undergoing therapeutic hypothermia. Arch Dis Child Fetal Neonatal Ed. 2014;99(3):F219-F24.
11 Sarnat HB, Sarnat MS. Neonatal encephalopathy following fetal distress. A clinical and electroencephalographic study. Arch Neurol. 1976;33(10):696-705.
12 Azzopardi DV, Strohm B, Edwards AD, Dyet L, Halliday HL, Juszczak E et al. Moderate hypothermia to treat perinatal asphyxial encephalopathy. N Engl J Med. 2009; 361(14): 1349- 1358.
13 Hellström-Westas L, Rosén I, Svenningsen NW. Predictive value of early continuous amplitude integrated EEG recordings on outcome after severe birth asphyxia in full term infants. Arch Dis Child Fetal Neonatal Ed. 1995;72(1).
14 Barkovich AJ, Hajnal BL, Vigneron D, Sola A, Partridge JC, Allen F et al. Prediction of neuromotor outcome in perinatal asphyxia: evaluation of MR scoring systems. AJNR Am J Neuroradiol. 1998;19(1):143-149.
15 Walsh BH, Neil J, Morey J, Yang E, Silvera MV, Inder TE et al. The Frequency and Severity of Magnetic Resonance Imaging Abnormalities in Infants with Mild Neonatal Encephalopathy. J Pediatr, 2017;187, 26–33.e1.
16 Bayley N. Bayley Scales of Infant Development, 2nd edition. San Antonio: The Physiological Corporation, 1993.
17 Welten M, de Kroon M, Renders CM, Steyerberg EW, Raat H, Twisk J et al. Repeatedly measured predictors: a comparison of methods for prediction modeling. Diagn Progn Res.
18 Hallberg B, Grossmann K, Bartocci M, Blennow M. The prognostic value of early aEEG in asphyxiated infants undergoing systemic hypothermia treatment. Acta Paediatr.
2010;99(4):531-6.
19 Goeral K, Urlesberger B, Giordano V, Kasprian G, Wagner M, Schmidt L et al. Prediction of Outcome in Neonates with Hypoxic-Ischemic Encephalopathy II: Role of Amplitude-Integrated Electroencephalography and Cerebral Oxygen Saturation Measured by Near-Infrared Spectroscopy.
Neonatology. 2017;112(3):193-202.
20 Lemmers PM, Zwanenburg RJ, Benders MJ, de Vries LS, Groenendaal F, van Bel F et al.
Cerebral oxygenation and brain activity after perinatal asphyxia: does hypothermia change their prognostic value? Pediatr Res. 2013;74(2):180-5.
21 Liu W, Yang Q, Wei H, Dong W, Fan Y, Hua Z. Prognostic Value of Clinical Tests in Neonates With Hypoxic-Ischemic Encephalopathy Treated With Therapeutic Hypothermia: A Systematic Review and Meta-Analysis. Front Neurol. 2020;11:133.
22 Bonifacio SL, Van Meurs K. Neonatal Neurocritical Care: Providing Brain-Focused Care for All at Risk Neonates. Semin Pediatr Neurol. 2019;32:100774.
23 Glass HC, Rowitch DH. The Role of the Neurointensive Care Nursery for Neonatal Encephalopathy. Clin Perinatol. 2016;43(3):547-57.
FIGURE LEGENDS:
Figure 1. (online) CONSORT flow-diagram of patient selection for the study.
Figure 2. Median aEEG score with interquartile ranges in the good and poor outcome groups over time. Scores are based on the Hellström-Westas criteria. The shaded area represents aEEG scores considered as normal (continuous normal voltage (CNV) and discontinuous normal voltage (DNV)).
Figure 3a. Proportion of different aEEG background patterns over time in good outcome group.
Figure 3b. Proportion of different aEEG background patterns over time in poor outcome group.
Figure 4. (online) Electrographic (single, repetitive seizures, status epilepticus) and clinical seizures noted during the study period in the full cohort.
Figure 5. AUC-ROC analysis of aEEG score at 48 hours (red line) and longitudinally analyzed aEEG background scores plus electrographic and clinical seizures (blue line) for classifying infants to good and poor outcome groups.
Table 1. Clinical characteristics of the 149 study participants.
Total (n=149)
Good outcome (n=93)
Poor outcome
(n=56) p value
Gestational age (weeks) 39 (38 - 40) 40 (38 - 40) 38.5 (37 - 39.8) 0.001 Birth weight (grams) 3300 (2890 - 3650) 3500 (3075 -
3710)
3100 (2490 -
3480) <0.001
Female sex 63 (42.2) 41 (44.1) 22 (39.3) 0.61
Delivered by Caesarean
Section 88 (59.5) 50 (53.8) 38 (67.8) 0.12
Apgar 1 minute 2 (1 - 4) 3 (1 - 5) 1 (0 - 2) <0.001
Apgar 5 minutes 5 (3 - 7) 5 (4 - 7) 3 (1 - 5) <0.001
Maternal age (years) 33.6 (28.6 - 37.6) 34.2 (30.0 - 38.4) 31.0 (26.8 - 36.7) 0.032 Initial blood gas values
pH 6.98 (6.8 - 7.13) 7.01 (6.9 - 7.14) 6.85 (6.7 - 7.07) <0.001
Base deficit (mmol/l) 17.8 (13 - 22) 16 (12.6 - 20) 19.7 (15 - 24.6) <0.001 Lactate (mmol/l) 14.4 (11.3 - 17.5) 13.4 (10.2 - 16) 16.7 (13.7 - 19.7) <0.001 Blood gas values at 6 hours of age
pH 7.22 (7.08 - 7.29) 7.24 (7.16 - 7.31) 7.18 (7.0 - 7.26) 0.001
Base deficit (mmol/l) 6.8 (3.2 -13.3) 4.8 (2.3 - 9.7) 11.0 (6.7 -15.9) <0.001 Lactate (mmol/l) 5.3 (2.2 - 10.3) 2.9 (1.7 - 6.7) 8.3 (4.8 - 14.2) <0.001 Cooling started (hours) 2.1 (1.4 - 3.0) 2.08 (1.4 - 2.9) 2.0 (1.3 - 3) 0.93 Age at MRI (days) 4.7 (3.3 - 6.2) 4.8 (3.8 - 6.3) 4.3 (2.2 -5.9) 0.11 MRI (%)
No injury Mild
Moderate/severe
86 (63) 17 (13) 33 (24)
72 (81) 10 (11) 7 (8)
14 (30) 7 (15) 26 (55)
<0.001 Age at Bayley II test
(months) 24 (19 - 35) 24 (20 - 34.5) 23 (18.8 - 36) 0.82
MDI 95 (84 - 104) 96 (85 - 106) 50 (50 - 63) <0.001
PDI 95 (89 - 103) 95.5 (89 - 103) 77 (50 - 86) <0.001
Death 19 (13) 0 (0) 19 (34) <0.001
Values are shown as median (IQR) or count, n (%).
Abbreviations: BE: Base Excess, MRI: magnetic resonance imaging, MDI: Mental development Index, PDI: Psychomotor Development Index on Bayley Scales of Infant Development, Second Edition (Bayley II test).
Table
Table 2. aEEG features, drugs affecting aEEG patterns and seizure activity during the study period.
n=149 Good outcome (n=93)
Poor outcome (n=56)
p value Median aEEG score for 84 hours 2.0 (1.2 - 3.2) 1.4 (1.1 - 2.1) 3.4 (2.4 - 4.5) p<0.001 aEEG normalization (hours) n=98 15 (7 - 37) 14 (5 - 32) 42 (24.5 - 55) p<0.001
aEEG recovery at 48 hours 99 (66.4) 82 (88.2) 17 (30.4) p<0.001
Morphine cumulative dose at 84 hours
(micrograms) 810 (690-920) 850 (760-990) 740 (380-740) p<0.001
Treated with anticonvulsants 78 (52.3) 34 (36.6) 44 (78.6) p<0.001 Received repeated loading doses or 2nd line
anticonvulsants 45 (30) 16 (18) 29 (50) p<0.001
No seizure activity 60 (40.3) 47 (50.5) 13 (23.2) p=0.011
Clinical seizures 65 (43.6) 29 (31.1) 36 (64.3) p<0.001
Electrographic seizures 68 (45.6) 32 (34.4) 36 (64.3) p<0.001
Electrographic seizures score (% of patient category)
0: none 1: single
2: repetitive or status
54.3 14.8 30.9
65.5 14.1 20.4
35.7 16.1 48.2
p<0.001
Electrographic and clinical seizures 44 (29.5) 15 (16.1) 29 (51.8) p<0.001
Values are shown as median (IQR) or count, n (%).
Table 3. (online) Neurodevelopmental outcome prediction based on the appearance of CNV or DNV in the aEEG background activity during each 6-hour period.
Time period AUC 95% CI Specificity Sensitivity NPV PPV 0-6 hours 0.84 0.78-0.90 0.55 0.93 0.93 0.55 6-12 hours 0.88 0.82-0.93 0.62 0.95 0.95 0.60 12-18 hours 0.89 0.83-0.94 0.72 0.90 0.93 0.65 18-24 hours 0.88 0.82-0.93 0.74 0.86 0.91 0.65 24-30 hours 0.86 0.80-0.92 0.77 0.80 0.88 0.66 30-36 hours 0.85 0.78-0.92 0.83 0.74 0.85 0.70 36-42 hours 0.86 0.80-0.92 0.86 0.72 0.85 0.74 42-48 hours 0.84 0.77-0.91 0.89 0.66 0.83 0.77 48-54 hours 0.82 0.75-0.90 0.89 0.63 0.82 0.76 54-60 hours 0.83 0.76-0.90 0.90 0.65 0.83 0.77 60-66 hours 0.80 0.72-0.88 0.90 0.62 0.82 0.76 66-72 hours 0.80 0.73-0.88 0.90 0.54 0.80 0.73 72-78 hours 0.82 0.74-0.89 0.88 0.56 0.80 0.70 78-84 hours 0.83 0.75-0.90 0.94 0.53 0.80 0.83
Abbreviations: CNV: continuous normal voltage; DNV: discontinuous normal voltage; AUC:
area under the receiver operator characteristic curve; CI: confidence interval; NPV: negative predictive value, PPV: positive predictive value.
Table 4. (online) Comparison of methods for outcome prediction modeling using repeatedly measured aEEG background activity scores. (Results before cross-validation)
Methods Description AUC 95% CI Sensitivity Specificity
All
measurements model
all 14 aEEG scores were used as separate
predictors
0.92 0.87-0.96 0.73 0.97
Best
measurement model
in our case the best aEEG score was found at 18 hours
0.89 0.83-0.94 0.90 0.72
Summary measurement (mean) method
mean aEEG score of the 14 periods
0.89 0.84-0.94 0.73 0.88
Summary measurement (maximum) method
worst aEEG score for each individual summarised
0.84 0.78-0.91 0.73 0.79
Changes between subsequent measurements method
calculation is based on the difference between the consecutive aEEG scores
0.92 0.87-0.96 0.73 0.97
Conditional measurements method
calculation is based on the difference between the measured and estimated aEEG scores using regression from the previous
measurements
0.92 0.87-0.96 0.73 0.97
Growth curve method
calculation is based on the mean and the slope coefficient of aEEG scores using a linear regression curve for each individual
0.90 0.85-0.95 0.71 0.90
ENROLMENT
EXCLUSIONS
FOLLOW-UP
Neonates with moderate to severe HIE, treated with hypothermia, monitored with aEEG for 84 hours
(n= 213)
Inclusion criteria not met
♦ Postnatal asphyxia (n=7)
♦ Low gestational age < 35 weeks (n= 4)
♦ Congenital malformation (n= 6)
♦ Concurrent cerebral lesions on MRI (n= 9)
Protocol exclusion
♦ Not adhering to cooling protocol (n=7)
Patients with Bayley II neurodevelopmental outcome examination between 16-42 months
(n= 149)
Lost to follow-up
♦ Follow-up not performed in time (n=31)
Figure Click here to access/download;Figure;Figure 1..pdf
Figure Click here to access/download;Figure;Figure_2.jpg
Figure Click here to access/download;Figure;Figure_3a.jpg
Figure Click here to access/download;Figure;Figure_3b.jpg
Figure Click here to access/download;Figure;Figure_4.jpg
Figure Click here to access/download;Figure;Figure_5.jpg
Prediction model development
Models were developed for the prediction of neurodevelopmental outcome (good/poor) using 14 repeatedly measured aEEG background activity scores taken at 6-hour intervals. In all the investigated prediction models, linear relationships between the predictor variables and the outcome were assumed. The models were applied to patients who survived the TH period and had no missing aEEG data in the 14 time intervals. Based on the prediction methods using repeatedly measured data by Welten et al.1 the following seven methods were applied:
1. All measurements method. In this method, all the 14 aEEG background readings were used as separate predictors in a multivariable regression analysis.
2. Changes between subsequent measurements method. In this method, the first aEEG background record and all the 13 subsequent changes between readings were used to calculate the aEEG trajectory for each individual. Mathematically, the equation yielded identical results to the all measurements regression method.
3. Conditional measurements method. In this method, the first aEEG background record and all the 13 subsequent conditional records were used to calculate the aEEG trajectory for each individual. The conditional measurement of a certain time point is obtained by taking the aEEG record of that specific time point and all previous records were regressed on it. Again, mathematically, the equation yielded identical results to the all measurements regression method.
4. Best measurement method. This method used a univariable analysis in which one of the 14 aEEG records was used as the single “best” predictor. This method is similar to that used currently in clinical practice, when a single cross-sectional 6-hour aEEG interval is used to determine neurological outcome. This method does not take into consideration longitudinal data and its trajectory when providing outcome estimates.
Appendix
5. Summary measurement (mean) method. This method used a univariable analysis in which the mean value of all 14 aEEG recordings was used as a single variable representing the predictor in the model. This method does not take into consideration data trajectory when providing outcome estimates.
6. Summary measurement (maximum) method. This method used a univariable analysis in which the maximum value of all 14 aEEG recordings was used as the single variable representing the predictor in the model. Again, the method does not take into consideration data trajectory when providing outcome estimates.
7. Growth curve method. This method uses information from a two-step analysis. First, a linear regression is performed to provide patient specific aEEG trajectories. Second, the mean of all measurements and the patient-specific slope coefficient are entered in a model to predict the neurodevelopmental outcome.
The following considerations were used when choosing the final regression model. We intended to take advantage of longitudinal data collection and tried to avoid single, cross-sectional data analysis that may lead to information loss in individual patients. Therefore, the “best” and
“summary measurements” methods were ruled out. We also aimed for a statistically parsimonious approach to avoid overfitting. Therefore, the “all measurements” and the mathematically similar other two methods were also excluded, leaving us with the “growth curve” method (see Supplemental Table 2). Overall, the growth curve method seems to be the most flexible method capable of incorporating longitudinal predictor information without loss in predictive quality.
Subsequently, to address the question of internal validity, we performed a 5-fold cross- validation using the growth-curve method, and repeated it a 1000 times. We also tested if
prediction power could be enhanced by adding further covariates, including the presence of both clinical and electrographic seizures, initial and subsequent blood gas values (pH, base excess, lactate), cumulative sedative or anticonvulsive treatment. After establishing the model with the best predictive quality for longitudinal aEEG data, we compared it with the regular approach of a single 6-hour aEEG background analysis at 48 hours of age and reported the reclassification rate for the newly developed method in determining neurological outcome.
The analysis script written in R Statistical Software, Version 4.0.3 (R Foundation for Statistical Computing, Vienna, Austria) is available online at GitHub (https://github.com/suneonatalgroup/aeegpredictiontool). A user friendly, outcome prediction tool was also developed for clinicians and made available at https://suneonatalgroup.shinyapps.io/aeegpredictiontool/ .
References
1 Welten M, de Kroon M, Renders CM, et al. Repeatedly measured predictors: a comparison of methods for prediction modeling. Diagn Progn Res. 2018;2:5.