© 2016, Eszterházy Károly University, Hungary Department of Botany and Plant Physiology
SHORT-TERM CHANGES IN HEIGHT–DIAMETER RELATION OF TWO MAPLE SPECIES AND EUROPEAN CORNEL OF UNDERSTORY IN AN OAK FOREST IN HUNGARY ON THE BASIS
OF TWO-PARAMETERS MODEL Tamás Misik1*&Károly Antal2
1Department of Environmental Science and Landscape Ecology, Eszterházy Károly University Eger, Hungary, 3300 Eger, Leányka u. 6;
2Department of Zoology, Eszterházy Károly University Eger, Hungary, 3300 Eger, Leányka u. 6;*E-mail: misiktom@gmail.com
Abstract: Forest understory species such as shrub and herbaceous layer, have received little attention in long-term studies. Knowledge of the diameter and the height of trees are fundamental for developing growth and yield models in forest stands. Overstory composition of the Síkfőkút Project site was dominated by sessile oak–Turkey-oak forest (Quercetum petraeae-cerris Soó 1963). Similarly to other European countries an oak decline occurred in Hungary oak woodlands at the end of 1970’s and about 63% of the oak trees perished in our site. The potential for oak species regeneration was a very low over the period of 1982-2012. Four nonlinear height-diameter functions were fitted and evaluated for Síkfőkút site based on a data set consisting of 2025 individuals for three dominant woody species (Acer campestre L., Acer tataricum L. and Cornus mas L.) and detected any short-term changes in these equations following dieback of oak canopies. These height–
diameter equations increase our knowledge of the growth of these species;
therefore will enable us to improve management planning in oak forests.
Keywords: oak decline, Acer campestre, shrub layer, size, growth model
INTRODUCTION
Knowledge of the diameter and the height of trees are fundamental for developing growth and yield models in forest stands (Lynch and Murphy 1995; Calama and Montero 2004). Many growth and yield systems use height and diameter as the two basic input variables, with all or part of the tree heights predicted from measured diameters (Arney 1985; Huang et al. 2000). The relation between the diameter of individuals and its height varies from one stand to another. Within the same forest stand, this relation is not constant
62
over time (Curtis 1967). Numerous generalized and region-wide equations have been developed recently for many tree species (e.g.
Temesgen and Gadow 2004; Castedo Dorado et al. 2005). Equations for the height and the diameter relation of understory species are not typically in the international papers.
The height–diameter relationship has been calibrated following random-parameter models, using both repeated measurements from permanent plots (Lappi 1997) as well as cross-temporal measurements taken simultaneously in different temporary plots (Jayaraman and Lappi 2001). Linear mixed models were used by Mehtätalo (2004) for Norway spruce (Picea abies (L.) Karst.), Jayaraman and Zakrzewski (2001) for sugar maple (Acer saccharum Marsh.), and by Lynch et al. (2005) for cherrybark oak (Quercus pagoda Raf.). A number of height–diameter equations have been developed using only DBH of trees as the predictor variable for estimating total height (e.g. Larsen and Hann 1987; Fang and Bailey 1998; Peng 1999; Robinson and Wykoff 2004). Relation between the diameter of a tree and its height varies among stands (Calama and Montero 2004) and depends on the growing environment and stand conditions (Sharma and Zhang 2004). When actual height measurements are not available and difficult, height–diameter functions can also be used to indirectly predict height growth of individuals (Larsen and Hann 1987).
An increase in the death of oak forests has been observed in many regions of Hungary since 1978 (Igmándy 1987). The species composition of the canopy layer was stable until 1979 and the healthy Q. petraea and Quercus cerris L. (Turkey oak) also remained constant in the mixed-species forest stand (Quercetum petraeae- cerris Soó 1963) of Síkfőkút. Serious oak decline was first reported in 1979–80 and by 2012, 62.4% of the oaks had died; this decline resulted in an opening of the canopy and lead to changes in canopy and in understory dynamics.
The possible response of understory cover, basal area and diversity indices to stand density in our site has shown in the study of Misik et al. (2013). Diameter of a woody individuals can be measured quickly, easily, and accurately, but the measurement of height is relatively complex, time consuming, and difficult because of a big size of these individuals in our site. The dynamics increasing of height and diameter of woody species and the structure of new subcanopy layer were showed in the result of Misik et al. (2014).
63
The purposes of this study were (1) to fit and evaluate four height-diameter functions on a short-term data set covering Acer campestre L. (field maple), Acer tataricum L. (Tatar maple) and Cornus mas L. (European cornel) dominant woody species; (2) to identify the most appropriate height-diameter functions for three woody species, and (3) to detect some possible difference between these species on the basis of height-diameter functions during a 4-5 year periods.
MATERIALS AND METHODS Study site
The 27 ha reserve research site is located in the Bükk Mountains of northeast Hungary (47°55’ N, 20°46’ E) at a distance of 6 km from the city of Eger at an altitude of 320–340 m a.s.l.. The site was established in 1972 by Jakucs (1985) for the long-term study of forest ecosystems. Mean annual temperature is 9.9 °C and mean annual precipitation ranges typically from 500 to 600 mm.
Description of the geographic, climatic, soil conditions and vegetation of the forest was undertaken in detail by Jakucs (1985, 1988). The most common forest association in this region is Quercetum petraeae-cerris with a dominant canopy of Q. petraea and Q. cerris. Both oak species are important dominant native deciduous tree species of the Hungarian natural woodlands. The plot under study is made up of evenly-aged trees, is at least 100 years old temperate deciduous forest and has not been harvested for more than 50 years.
Sampling and statistical analysis
Shoot analysis data of three dominant woody species (A. campestre, A. tataricum and C. mas are on the basis of the biggest mean size parameters in the shrub community) were obtained from a 27 ha study site at regular intervals. Monitoring activities started in 1982 and repeated shrub layer inventories took place in 1993, 1997, 2002, 2007 and 2012. The investigations were performed during the growing seasons.
Collected over the last 3 decades, the 2025 individuals were randomly selected throughout the study site to provide representative information for a variety of densities and heights of
64
dominant woody species. Summary statistics including the mean, minimum, maximum, and standard deviation (SD) for total shoot height and diameter of shoot by woody species are shown in Table 1, 2 and 3.
Table 1. Acer campestre shoot summary statistics based on dominant woody species.
Year No. of sample specimens
Diameter (cm) Total shoot height (m) Mean Min. Max. SD Mean Min. Max. SD 1982 195 4.38 1.23 13.32 2.46 4.02 1.00 10.20 2.19 1993 151 6.70 1.40 18.00 3.55 5.17 1.30 15.00 3.05 1997 207 6.79 1.00 21.00 4.21 5.22 1.00 13.00 3.00 2002 160 8.49 0.82 35.00 6.54 6.06 1.10 17.00 3.54 2007 133 10.84 0.95 31.50 6.68 8.01 1.10 19.20 4.47 2012 125 10.63 0.85 37.92 6.02 7.60 1.18 16.50 3.76
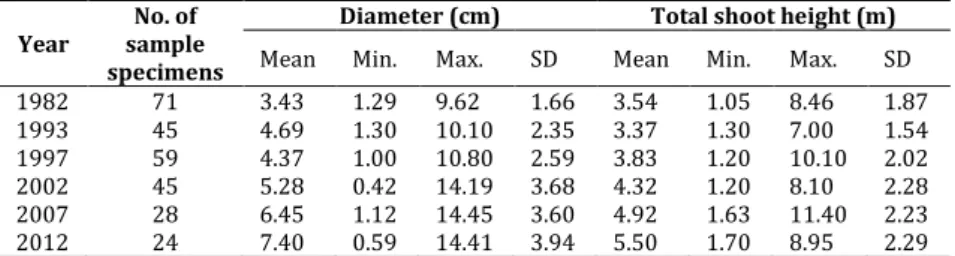
Table 2. Acer tataricum shoot summary statistics based on dominant woody species.
Year No. of sample specimens
Diameter (cm) Total shoot height (m) Mean Min. Max. SD Mean Min. Max. SD 1982 71 3.43 1.29 9.62 1.66 3.54 1.05 8.46 1.87 1993 45 4.69 1.30 10.10 2.35 3.37 1.30 7.00 1.54 1997 59 4.37 1.00 10.80 2.59 3.83 1.20 10.10 2.02 2002 45 5.28 0.42 14.19 3.68 4.32 1.20 8.10 2.28 2007 28 6.45 1.12 14.45 3.60 4.92 1.63 11.40 2.23 2012 24 7.40 0.59 14.41 3.94 5.50 1.70 8.95 2.29
Table 3. Cornus mas shoot summary statistics based on dominant woody species.
Year
No. of sample specimens
Diameter (cm) Total shoot height (m) Mean Min. Max. SD Mean Min. Max. SD 1982 155 3.93 1.28 8.92 1.64 3.52 1.05 13.00 1.74 1993 108 5.68 1.60 13.00 2.23 3.81 1.20 9.00 1.21 1997 193 4.97 1.10 13.40 2.58 3.97 1.00 9.60 1.82 2002 117 6.50 0.60 25.00 3.97 4.64 1.10 9.00 1.98 2007 116 7.36 0.80 29.63 5.39 4.63 1.10 8.40 2.04 2012 93 7.59 0.70 15.07 3.08 5.37 1.17 8.80 1.80
Four biparametric nonlinear equations were fitted and evaluated based on a data set consisting from a plot (Table 4). Radial and height growth are characterized for specimens of dominant woody species.
Height and diameter of all living Acer spp. and C. mas in the high shrub layer (shrub individuals height ≥ 1.0 m were categorized as high shrubs) were measured with a scaled pole and at 5.0 cm above
65
the ground with a digital caliper and the measurement results were averaged.
Table 4. Nonlinear height-diameter functions selected for comparison.
Function No. and form* References [1] H = 0.05 + ea+b / (D + 1) Wykoff et al. 1982
[2] H = 0.05 + aD / (b + D) Bates and Watts 1980; Ratkowsky 1990
[3] H = 0.05 + 10a × Db Larson 1986 [4] H = 0.05 + aD / (D + 1) + bD Watts 1983
* H = total tree height (m); D = diameter of shoot height (cm); a, b = parameters to be estimated; e = base of the natural logarithm (= 2.718 28); 0.05 is a constant used to account that diameter is measured at 0.05 m above the ground.
For each year of monitoring we fitted four nonlinear equations with two parameters (Table 4) describing the dependence of height on diameter. Height and diameter relationships of trees are generally described using nonlinear mathematical models. We replaced 1.3 with 0.05 m in the different height–diameter models, because we measured diameter of woody species in the understory at 0.05 m. When diameter approaches 0, H approaches 0.05 (e.g. if we use logistic type of function). The asymptotic t-statistics for the parameters and the plots of studentized residuals against the predicted height show that many concave and sigmoidal functions can be used to describe the height–diameter relationships. R Core Team (2014) and R package (Grothendieck 2013) were used to model the different nonlinear height-diameter functions. It was determined the most fitting nonlinear equations for each woody species on the basis of residual standard error values.
RESULTS
Tables 5, 6 and 7 show the least squares estimates of the parameters.
Coefficient of determination (R2) values ranged from 0.40 to 0.82, with the average being 0.70 of A. campestre, 0.59 of A. tataricum and 0.51 of C. mas during last three decades, and not reported here.
Results in Table 5, 6 and 7 show that for the two-parameter models, [2], [3] and [4] the t-statistics for the parameters of the functions are not significant at the 0.01 level of A. campestre and 0.05 level of the other two species in some studies.
66
Table 5. Parameter estimations for two-parameter height-diameter functions.
Function Parameter
Estimates for Acer campestre in monitoring years
1982 1993 1997 2002 2007 2012
[1] a 2.635 2.819 2.752 2.678 3.018 2.846
b -6.349 -8.691 -7.856 -6.763 -9.793 -8.346 [2] a 44.650 90.350* 37.067 19.014 35.621 23.305 b 43.770 111.070* 39.855 15.115 34.661 19.767
[3] a 0.040* -0.043* 0.041* 0.257 0.166 0.260
b 0.882 0.913 0.824 0.600 0.728 0.623
[4] a 0.763 0.702* 1.219 3.498 2.627 3.600
b 0.772 0.675 0.615 0.376 0.524 0.416
Note: *The asymptotic t-statistic for the parameter is not significant at the 0.01 level.
The residual standard errors (RSE) of three woody species are summarized in Table 8. The most fitted height-diameter function values for woody species showed in bold. Function of Wykoff et al.
(1982) generally giving the most suitable results, except of A.
campestre.
Table 6. Parameter estimations for two-parameter height-diameter functions.
Function Parameter
Estimates for Acer tataricum in monitoring years
1982 1993 1997 2002 2007 2012
[1] a 2.639 1.986 2.239 2.302 2.280 2.355
b -5.959 -4.057 -4.355 -4.420 -4.436 -4.814 [2] a 47.180* 8.969 12.775 12.139 11.500 11.971 b 42.120* 7.287 9.430 8.048 7.553 7.714*
[3] a 0.056* 0.129* 0.173 0.227 0.257 0.309
b 0.917 0.604 0.658 0.601 0.557 0.514
[4] a 0.462* 2.040 2.096 2.688 3.113 3.700
b 0.916 0.364 0.498 0.427 0.365 0.320
Note: *The asymptotic t-statistic for the parameter is not significant at the 0.05 level.
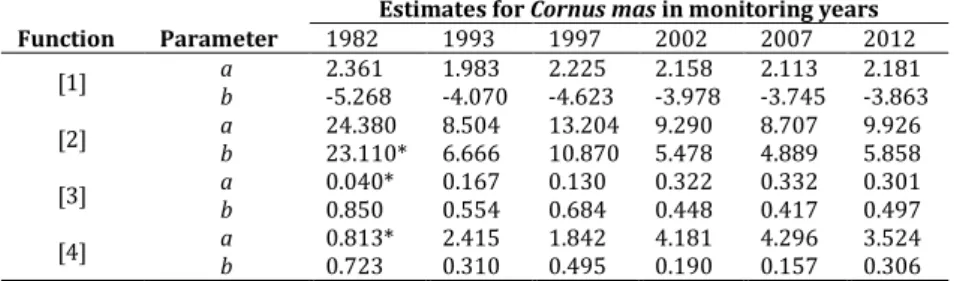
Table 7. Parameter estimations for two-parameter height-diameter functions.
Function Parameter Estimates for Cornus mas in monitoring years
1982 1993 1997 2002 2007 2012
[1] a 2.361 1.983 2.225 2.158 2.113 2.181
b -5.268 -4.070 -4.623 -3.978 -3.745 -3.863
[2] a 24.380 8.504 13.204 9.290 8.707 9.926
b 23.110* 6.666 10.870 5.478 4.889 5.858
[3] a 0.040* 0.167 0.130 0.322 0.332 0.301
b 0.850 0.554 0.684 0.448 0.417 0.497
[4] a 0.813* 2.415 1.842 4.181 4.296 3.524
b 0.723 0.310 0.495 0.190 0.157 0.306 Note: *The asymptotic t-statistic for the parameter is not significant at the 0.05 level.
Function of Watts (1983) has very poor convenience and large RSE values; this function was fitted for A. campestre only in two different times. The lower error values were measured in 1982 and in 1993,
67
later these values increased in line with increasing average size of dominant woody species.
Table 8. Comparison of nonlinear height-diameter function: residual standard errors.
Function Species
Residual standard errors
1982 1993 1997 2002 2007 2012 [1] Acer campestre 1.021 1.965 1.347 1.684 2.496 2.189
Acer tataricum 1.029 1.134 1.362 1.003 1.359 1.510 Cornus mas 1.205 0.828 1.091 1.245 1.104 1.251 [2] Acer campestre 0.972 1.869 1.262 1.678 2.404 2.207 Acer tataricum 1.028* 1.131 1.348 1.008 1.360 1.513 Cornus mas 1.202* 0.827 1.079 1.256 1.117 1.247 [3] Acer campestre 0.972 1.866 1.267 1.784 2.423 2.318 Acer tataricum 1.033 1.133 1.347 1.055 1.405 1.546 Cornus mas 1.204* 0.836 1.078 1.354 1.249 1.256 [4] Acer campestre 0.973 1.862 1.277 1.906 2.461 2.437 Acer tataricum 1.036 1.137 1.351 1.096 1.438 1.576 Cornus mas 1.205* 0.844 1.082 1.399 1.286 1.265 Note: The most fitted height-diameter function values shown in bold.
*The RSE values are not compared because of insignificant t-statistics.
The most fitted function for Acer species and C. mas are shown in Figure 1, 2 and 3. Standard error values for the fitted functions, although not reported here, ranged from 0.03 to 116.21, with the average being 7.76 of A. campestre, 3.00 of A. tataricum and finally 1.16 of C. mas during monitoring investigations.
Figure 1. Plot of total tree height against diameter for Acer campestre in 1982. The curve was produced by [2] function.
diameter (cm)
height (m)
68
Figure 2. Plot of total tree height against diameter for Acer tataricum in 2002. The curve was produced by [1] function.
Figure 3. Plot of total tree height against diameter for Cornus mas in 1993. The curve was produced by [2] function.
diameter (cm)
height (m) height (m)
diameter (cm)
69 DISCUSSION
The aim of this study was to develop a model capable of predicting the oak death pattern in Síkfőkút oak forest for height–diameter relation of dominant woody species and basic calculation of forest inventories. Woody shoot height is an important variable which is used for estimating stand volume, site quality and for describing understory structure following serious oak decline.
It’s known that due to competition, trees with the same diameter are taller in denser forest stands. Density and diameter are not only necessary, but may be sufficient for determining tree height because other factors affecting height are reflected by diameter and density.
In the process of developing the proposed model it was found that height increases monotonically with density and that this increase is not bounded by an asymptote (Zeide and Vanderschaaf 2002). Our study is in agreement with this statement of previous finding because A. campestre increased in density (from 56 to 204 specimen’s ha-1); density of A. tataricum and C. mas did not changed in importance in the subcanopy layer over the past 3 decades (Misik et al. 2014).
Kenefic and Nyland (1999) explored sugar maple height diameter and age diameter relationship in a balanced uneven-aged northern hardwood in USA. They results suggest that regressions show a clear relationship between tree diameter and height in the studied stand.
When interpreted in light of the correlation between tree diameter and age, these results suggest a relationship between tree age and height as well. The height parameters vary considerably with diameter; this relationship can be described by statistically valid equation.
Conclusions to be derived from the site are as follows: (1) it was fitted and evaluated four height-diameter functions on a long-term data set covering dominant woody species. (2) The most appropriate height-diameter functions were Wykoff et al. (1982) for A. tataricum and C. mas and Bates and Watts (1980) and Ratkowsky (1990) for A.
campestre. (3) After the oak decline in the study site was detected remarkably increasing of residual standard errors for these species.
This increasing was the lowest by C. mas species. These fitted and evaluated equations increase our knowledge of the growth of this species and therefore will enable us to improve management planning in oak forests.
70 REFERENCES
ARNEY,J.D. (1985). A modeling strategy for the growth projection of managed stands.
Canadian Journal of Forest Research 15: 511–518.
CALAMA,R.&MONTERO,G.(2004). Interregional nonlinear height–diameter model with random coefficients for stone pine in Spain. Canadian Journal of Forest Research 34: 150–163.
CASTEDO DORADO,F.,BARRIO ANTA,M.,PARRESOL,B.R.,&ÁLVAREZ GONZÁLEZ,J.G.(2005). A stochastic height-diameter model for maritime pine ecoregions in Galicia (northwestern Spain). Annals of Forest Science 62: 455–465.
CURTIS, R.O. (1967). Height–diameter and height–diameter–age equations for second-growth Douglas-fir. Forest Science 13: 365–375.
FANG,Z.&BAILEY,R.L. (1998). Height–diameter models for tropical forests on Hainan Island in southern China. Forest Ecology and Management 110: 315–327.
GROTHENDIECK,G. (2013). Non-linear regression with brute force. R package version 0.2.
HUANG,S.,PRICE,D.,&TITUS,S.J.(2000). Development of ecoregion-based height–
diameter models for white spruce in boreal forests. Forest Ecology and Management 129: 125–141.
IGMÁNDY,Z. (1987). Die Welkeepidemie von Quercus petraea (Matt.) Lieb. in Ungarn (1978 bis 1986). Österreichische Forstzeitung 98: 48–50.
JAKUCS,P. (ed., 1985). Ecology of an oak forest in Hungary. Akadémia Kiadó, Budapest, 545 pp.
JAKUCS,P. (1988). Ecological approach to forest decline in Hungary. Ambio 17: 267–
274.
JAYARAMAN,K. & LAPPI,J. (2001). Estimation of height–diameter curves through multilevel models with special reference to even-aged teak stands. Forest Ecology and Management 142: 155–162.
JAYARAMAN,K. & ZAKRZEWSKI,W.T. (2001). Practical approaches to calibrating height–
diameter relationships for natural maple stand in Ontario. Forest Ecology and Management 148: 169–177.
KENEFIC,L.S. & NYLAND,R.D. (1999). Sugar maple height-diameter and age-diameter relationships in an uneven-aged northern hardwood stand. Northern Journal of Applied Forestry 16: 43–47.
LAPPI,J. (1997). A longitudinal analysis of height/diameter curves. Forest Science 43:
555–570.
LARSEN,D.R.&HANN,D.W. (1987). Height–diameter equations for seventeen tree species in southwest Oregon. Oregon State University, Forest Research Laboratory, Corvallis, Research Paper 49. pp.
LYNCH,T.&MURPHY,P. (1995). A compatible height prediction and projection system for individual trees in natural, even-aged shortleaf pine stands. Forest Science 41: 194–209.
LYNCH,T.B.,HOLLEY,A.G.,&STEVENSON,D.J. (2005). A random-parameter height-dbh model for cherrybark oak. Southern Journal of Applied Forestry 29: 22–26.
MEHTÄTALO,L. (2004). A longitudinal height–diameter model for Norway spruce in Finland. Canadian Journal of Forest Research 34: 131–140.
71
MISIK,T.,VARGA,K.,VERES,ZS.,KÁRÁSZ,I.,&TÓTHMÉRÉSZ,B. (2013). Long-term response of understorey cover, basal area and diversity to stand density in a mixed oak forest on the Síkfőkút plot in Hungary. Journal of Forest Science 59: 319–327.
MISIK,T.,KÁRÁSZ,I.,&TÓTHMÉRÉSZ,B. (2014). Understory development in an oak forest in northern-Hungary: the subcanopy layer. Acta Silvatica et Lignaria Hungarica 10: 9–21.
PENG,C.H. (1999). Nonlinear height–diameter models for nine tree species in Ontario boreal forests. Ontario Forest Research Institute, Ministry of Natural Resources, Sault Ste Marie, Ontario, Forest research report No. 155. pp. 28.
RCORE TEAM (2014). R: A language and environment for statistical computing. R Foundation for Statistical Computing, Vienna, Austria.
ROBINSON,A.P.&WYKOFF,W.R. (2004). Imputing missing height measures using a mixed-effects modeling strategy. Canadian Journal of Forest Research 34: 2492–
2500.
SHARMA,M.&ZHANG,S.Y. (2004). Height–diameter models using stand characteristics for Pinus banksiana and Picea mariana. Scandinavian Journal of Forest Research 19: 442–451.
TEMESGEN, H. & GADOW, K.V. (2004). Generalized height-diameter models an application for major tree species in c omplex stands of interior British Columbia. European Journal of Forest Research 123: 45–51.
ZEIDE,B.&VANDERSCHAAF,C. (2002). The effect of density on the height-diameter relationship. In: Gen. Tech. Rep. SRS-48. Asheville, NC: U.S. Department of Agriculture, Forest Service, Southern Research Station. pp. 463–466.
(submitted: 29.10.2015, accepted: 16.07.2016)
![Figure 1. Plot of total tree height against diameter for Acer campestre in 1982. The curve was produced by [2] function](https://thumb-eu.123doks.com/thumbv2/9dokorg/1205619.89952/7.688.157.515.561.832/figure-plot-total-height-diameter-campestre-produced-function.webp)
![Figure 2. Plot of total tree height against diameter for Acer tataricum in 2002. The curve was produced by [1] function](https://thumb-eu.123doks.com/thumbv2/9dokorg/1205619.89952/8.688.155.519.117.395/figure-plot-total-height-diameter-tataricum-produced-function.webp)
