DOI: 10.1556/606.2019.14.3.14 Vol. 14, No. 3, pp. 141–152 (2019) www.akademiai.com
FUTURE CHANGES IN SHORT-TERM RAINFALL INTENSITIES IN ZÁHORSKÁ NÍŽINA LOWLANDS,
SLOVAKIA
1 Gabriel FÖLDES*, 2 Silvia KOHNOVÁ, 3 Marija Mihaela LABAT
1,2,3
Department of Land and Water Resources Management, Faculty of Civil Engineering Slovak University of Technology Bratislava, Radlinského 11, 810 05 Bratislava e-mail: 1gabriel.foldes@stuba.sk, 2silvia.kohnova@stuba.sk, 3marija.labat@stuba.sk
Received 20 December 2018; accepted 10 April 2019
Abstract: The paper focuses on future changes in the short-term rainfall intensities in the western region of Slovakia. The analysis was performed for 4 climatological stations, namely:
Malacky, Myjava, Vrbovce and Šaštín. The short-term rainfall intensity data from the community land model that is a regional climate model were used in durations of 60 to 1440 minutes for a warm period. The focus was aimed at comparing changes in rainfall characteristics, especially changes in the seasonality and trends and changes in the scaling exponents and design values.
Keywords: Short-term rainfall, Trend analysis, Scaling, Design values, Regional climate scenarios
1. Introduction
The western part of Slovakia is often affected in the summer time by short-term rainfall; these rainfall events have short durations and high intensities, causing great economic damage and damage to human property. The rainfall is also a threat to human life. The largest problem in the region is soil erosion caused by water. The flash floods caused by intensive rainfall transport a lot of sediment into urban areas. To deal with this problem the design of measures for soil erosion control and an assessment of their effect on the reduction of peak flows [1] study was addressed. In recent decades flash floods caused by intensive rainfall have become one of the most frequent natural hazards in Europe. This is reflected in the huge numbers of studies that deal with
* Corresponding Author
extreme precipitation, flash floods, and flood protection, e.g. an investigation of the hydraulic regime in the middle part of the Loire River within the context of floods and low flow events [2], a case study in the region of Calabria (Italy), flash floods in urban areas [3], a regional frequency analysis of sub-daily extreme precipitation in the UK along with an assessment of their seasonality [4], and the impact of extreme rainfall and flash floods on the flood risk management process and geomorphological changes in the small Carpathian catchments that involved a case study of the Kasiniczanka river (Outer Carpathians, Poland) [5].
Assessing the changes in seasonality is the first part of this study. These changes belong among the main characteristics of short-term rainfall and describe the occurrence of maximal rainfall events. For this reason it is necessary to know in which part of the year or season maximal events occur and what could be future changes in the seasonality of short-term rainfall. There are several studies analyzing seasonality, e.g.
the detection of future changes in seasonality in extreme short-term rainfall in selected stations of Slovakia [6], and an analysis of changes in the magnitude, frequency, and seasonality of heavy precipitation over the contiguous USA [7]. Attention has also been paid to trend testing in time series. Trends are showing changes in the future, which have recently attracted attention; this is reflected in the huge number of studies that deal with assessments of the types and significance of changes in trends in variations in natural time series, i.e. temperature, precipitation, flow, evaporation etc. Examples of the studies include analyses of rainfall intensities in Slovakia [8] and analyses of future changes in the trends and scaling coefficients for short-term rainfall in southwestern Slovakia [9]. An evaluation of the design values of rainfall intensities is also one of the most important parts of the assessment of future changes. The design values of rainfall are derived by a scaling exponent that uses a simple scaling method. The method is used in order to derive the characteristics for rainfall events with a shorter duration than one day from the usual daily time series. The scaling exponents and properties have also been examined in several studies, e.g. on the use of the simple scaling of heavy rainfall in a regional estimation of Intensity, Duration and Frequency (IDF) curves in Slovakia [10], and the scaling of short-term rainfall intensities in Slovakia [11]. Predicting changes in rainfall characteristics is important for the future in order to prevent damage to human property and lives.
2. SRES scenarios
The Special Report on Emissions Scenarios (SRES) contained scenarios that have been developed for a description of the relationships between emission driving forces and their evolution to climate change at the end of the 21st century. The report was created by the Intergovernmental Panel on Climate Change (IPCC) [12]. The driving forces of emission are demographic developments, socio-economic developments, technological change, and environmental development. The development of these driving forces is very uncertain. For this reason, the IPCC created four narrative storylines. Each storyline represents different developments in driving forces. The developments may be viewed as positive or negative. These four narrative sets or families are called the A1, A2, B1 and B2 storylines are presented in Fig. 1. The A1
storyline describes a world with very rapid economic growth; the peak of the global population will be reached by the middle of the century, and new and efficient technologies will be rapidly introduced. The A1 scenarios have three subgroups that describe the alternative technological changes in the energy system. The subgroups are A1FI: fossil intensive energy sources, A1T: non-fossil energy sources, and A1B: a balance across all the sources. The A2 storyline describes a very heterogeneous world.
The global population is growing continuously; economic development is regionally oriented; and technological change is fragmented and slower than in the other storylines. The B1 storyline describes the same population growth as in the A1 storylines. The difference is in rapid economic growth with reductions in materials and the introduction of clean and resource-efficient technologies. The emphasis is on global solutions in the economy and social and environmental sustainability but without any initiatives in the climatic field. The B2 storylines describe a world with an emphasis on local solutions for economic, social, and environmental sustainability. The rate of increase of the global population is lower than in the A2 storyline, but it has intermediate economic development levels and more diverse technological changes than in the A1 and B1 storylines. The storylines are also oriented towards environmental protection and social justness with a focus on the local and regional levels [12].
Fig. 1. Storyline Schemes of the SRES Scenarios
3. Methodology
Several methods have been used in this paper for the detection of changes in rainfall characteristics. For estimating seasonality changes, the Burn’s vector method was used.
For estimating trends, the Mann-Kendall trend test was applied. The scaling exponents were derived using the simple scaling method.
3.1. Seasonality changes using the Burn’s vector method
Burn’s vector method [13] is used to estimate seasonality; the method is often used to estimate the occurrence of extreme seasonal phenomena. This method describes the variability of the date when the maximum rainfall occurs, so that the direction of the vector corresponds to the expected day of the occurrence during the year, while its length describes the variability around the expected date of the occurrence. The date of occurrence (D) represents the average position of an event that is plotted in polar coordinates per unit circle. First, the vector orientation to indicate when the maximum value for the given year occurred was calculated. The position of the event’s occurrence is shown in a unit circle by an angle we define as:
The date of occurrence Di of the extreme event in the angular value θi:
365 2π
θi=Di . (1)
The abscissa x and ordinate y of the Burn’s vector are calculated as:
( )
= ∑
= n
i i
x n 1
1 cosθ , (2)
( )
= ∑
= n
i i
y n 1
1 sinθ . (3)
The orientation of the Burn’s vector θ is calculated as:
= − y 1 x
θ tan . (4)
The seasonal concentration index r can be calculated as:
2
2 y
x
r= + . (5)
The orientation of the vector can have a value from 0, which corresponds with the 1st of January to 2π, which corresponds with the 31st of December. The seasonal concentration index can have a value between 0 and 1; 0 means that the occurrences are uniformly distributed throughout the year, while the 1 means that the occurrence happens every year on the same date. The results are interpreted in the Burn´s diagrams.
3.2. Mann-Kendall trend test
The purpose of the Mann-Kendall test is to statistically assess the statistical significance of an ascending or descending trend in a selected value over time. The
significance of the rising or decreasing trend means that the variable constantly increases or decreases over time, but the trend may or may not be linear. The Mann- Kendall test examines the rejection of the zero hypothesis (H0) and the acceptance of an alternative hypothesis (Ha), where H0 equals a non-monotonous trend, and Ha is a monotonous trend [14], [15].
The initial assumption for a Mann-Kendall trend is that H0 is correct or that the data must be valid before H0 is rejected and Ha received. The calculation is determined by the formula:
( )
∑ ∑ −
= −
= = + 1
1 1
n sgn k
n k j
k j x x
S , (6)
where S is the testing statistic; xj is the sequential data value; and n is the length of the time series. The Mann-Kendall ZMK standardized test statistics can be given by:
( )
( )
, if 0,1
, 0 if ,
0
, 0 if 1 ,
+ <
=
=
=
− >
=
S S VAR Z S
S Z
S S VAR Z S
MK MK MK
(7)
where ZMK = 0 represents the not-existing trend, while ZMK > 0 means the increasing and ZMK < 0 the decreasing trend.
3.3. Simple scaling
A simple scaling method is used to process rainfall data for a period of time shorter than one day. Simple scaling determines the design values for duration shorter than one day and for a selected time period by using daily rainfall records that are commonly available. Applying simple scaling to the relationship between the IDF properties of the precipitation is possible. Determining the scaling properties of precipitation is based on the general shape of the following IDF formula [16]:
( ) ( )
db T
i=a , (8)
where i is the rainfall intensity; a(T) is the return period function T; and b(d) is the duration function of the rain given by the formula:
( ) (
d = d+θ)
ηb , (9)
where θ, η are parameters (determined by the estimation θ > 0, 0 < η < 1).
Simple scaling for the scaling of the statistical moments was applied in this paper.
The scaling exponents could be estimated with a linear regression from the slope between the logarithmic moment values and the scaling parameters for the different order of the moments. If there is a linear dependence between the scaling exponent and the moment order, it is a scaling exponent of the first order. This property is referred to as ‘wide sense simple scaling’. The following formula is used for deriving the scaling coefficients [17]:
[ ]
Ind E[ ]
IdnE βn
λ =λ , (10)
where Id is the maximal mean precipitation intensity with d return period; λ is scaling parameter; βn = nβ represents the scaling exponent of the n-th order.
4. Data analysis
The data used in the analysis was created by Climate Land Model (CLM) simulation and were provided by Dr. Martin Gera of Comenius University, Bratislava. The Regional Climate Scenario (RCM) used consists of rainfall intensities for two time periods for the past period (1960-2000) and for the future period (2070-2100). The analysis was made for durations from 60 minutes up to 1440 minutes. The RCM scenario selected for the simulation of the climate was the SRES A1B scenario, which is a semi-pessimistic scenario with an increase in the global temperature of about 2.9°C by the year 2100. This scenario relates well to the current processes in the atmosphere. The boundary conditions were from European Centre Hamburg Model 5/Max Planck Institute Ocean Model (ECHAM5/MPIOM) with 6-hour intervals.
The area of interest is located in the western part of Slovakia in the region of the Záhorská nížina Lowlands (Fig. 2).
Fig. 2. Location of the selected climatological station in the Climatological Station Network of Slovakia
5. Results
The first step in the study was to analyze the seasonality changes as described in the methodology for the analysis of future changes in the occurrence of rainfall maxima.
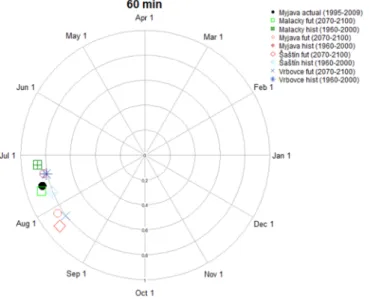
The results were presented in the Burn’s diagrams (Fig. 3). The extremes occurred in July and August. The actual measured data showed the occurrence of the maximal events at the Myjava station in the first half of July for precipitation duration of 60 minutes. The scenario shows the occurrence in the second half of July and the first half of August for the historical period. In a comparison of the stations, the scenario shows movement for the future at an earlier time in the year, especially in the first half of July.
In the durations of 120, 180, and 240 minutes, the actual measured data showed the occurrence at the Myjava station for the second half of July. The CLM simulation shows similar results as in the 60-minute duration in the first half of August. For the future period the simulation shows the same tendency of the occurrence of the maxima as the actual observation shows at the Myjava station. In the duration of 1440 minutes, the simulation has the lowest differences between the simulated historical and future periods, i.e. the occurrence of the rainfall maximal events was found in the second half of July and at the beginning of August. For the future period there is a small change in the maxima of the 1440-minute rainfall occurrence. The results are shown in Fig. 3.
Fig. 3. Burn’s diagram for 60 min. duration
The next step was to analyze the changes in the precipitation trends at the stations for the historical and future periods. The analysis does not show significant trends at the 90% level of significance. For the Myjava station, the results were compared with the actual measured data. The results show that in the historical period, the increasing
predominant trend was only in the 1440-minute precipitation duration, which is the opposite of what the actual measured data shows. In the other durations the decreasing trend is prevailing for the station. The results are presented in Table I.
Table I
Behavior of trends for the historical period at all the stations
Hist 60 min. 120 min. 180 min. 240 min. 1440 min.
Myjava (actual) - - - + -
Myjava - - + + +
Malacky - - - - +
Šaštín - + - - +
Vrbovce - - - - +
For the future period the increasing trends are prevailing in the durations of 60 to 180 minutes. The increasing trends prevail for all the stations in the duration of 60 minutes. For the durations of 240 and 1440 minutes, the decreasing trend is prevailing for most of the stations. The results are presented in Table II.
Table II
Behavior of trends for the future period at all the stations
Future 60 120 180 240 1440
Myjava (actual) - - - + -
Myjava + - + - -
Malacky + + + + +
Šaštín + - - - -
Vrbovce + + + - -
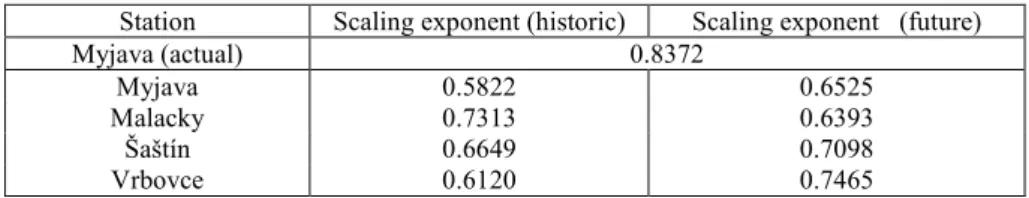
The final step was to evaluate the changes in the values of the design rainfall. To derive the design values of the rainfall, the scaling exponents were used. The results from the simple scaling are shown in Table III. The scaling exponent values have increasing tendency for the future at all the stations, except for the Malacky station, where the scaling exponent has a lower value for the future.
Table III
Scaling exponents for the stations analyzed for the historical and future periods Station Scaling exponent (historic) Scaling exponent (future)
Myjava (actual) 0.8372
Myjava 0.5822 0.6525
Malacky 0.7313 0.6393
Šaštín 0.6649 0.7098
Vrbovce 0.6120 0.7465
From the design rainfall values derived, the increasing tendency in the values is visible. The largest difference between the historical and future periods is at the Šaštín
and Myjava stations. The lowest difference is at the Malacky station. The results are presented in Fig. 4-Fig. 7 by the IDF curves.
Fig. 4. Intensity - duration curves of precipitation for the Šaštín station analyzed for historical and future periods for a return period of 100 years
Fig. 5. Intensity - duration curves of precipitation for the Malacky station analyzed for historical and future periods for a return period of 100 years
Fig. 6. Intensity - duration curves of precipitation for the Vrbovce station analyzed for historical and future periods for a return period of 100 years
Fig. 7. Intensity - duration curves of precipitation for Myjava station analyzed for historical, actual and future periods for a return period of 100 years
6. Conclusion
This study presents the results of an analysis of the future changes in the short-term rainfall characteristics in the Záhorská nížina Lowland. The analysis was performed using the CLM regional climate scenario data. The main focus was on the changes in the seasonality, trend and design values of the short-term rainfall. The Záhorská nížina Lowland are situated in the western part of Slovakia; four stations were selected, namely, Malacky, Šaštín, Vrbovce and Myjava for the analysis.
The analysis begins with an evaluation of the changes in the seasonality of the occurrence of maximal rainfall events. For the actual measurements for the Myjava station, they occur in the second half of July in all the durations. The scenario shows that for the historical period, the occurrence was in the first half of August for all the stations. For the future period, the scenario predicts the occurrence of the rainfall maxima events similarly to the actual measured data at the Myjava station for the second half of July. In the comparison with the historical period, it is a shift to an earlier date.
The trend analysis showed that in the historical period, the decreasing trend prevails for most of the stations. Also, for the historical period, the increasing trend was found in the 1440-minute duration for all the stations. However, for the future period, the increasing trend prevails for the climatological stations for short durations of rainfall.
For the 1440-minute duration, decreasing trends were found in the majority of the climatological stations at a 90 % level of significance.
The scaling exponents derived also showed an increasing tendency for the future period, which was reflected in the design rainfall values. The largest differences between the historical and future periods were at the Šaštín and Myjava stations, and the lowest differences were at the Vrbovce and Malacky stations. For the Myjava climatological station, the actual measured data were available; in this case the scenario shows lower values than the actual measurements show. That is caused by the short period of measurement, with the occurrence of extreme precipitation events during the measurement, but for the duration longer than 200 minutes, the values of the actual measurements and scenario values are close to each other. The findings show the necessity of recalculating the design values of short-term rainfall intensities for the design of the water management and water structures in the area.
Acknowledgements
This work was supported by the Slovak Research and Development Agency under Contracts No. APVV-15-0497 and the VEGA Grant Agency No1/0710/17.
References
[1] Labat M. M., Korbelová L., Kohnová S., Hlavčová K. Design of measures for soil erosion control and assessment of their effect on the reduction of peak flows, Pollack Periodica, Vol. 13, No. 3, 2018, pp. 209‒219.
[2] Kuriqi A., Ardiçlioğlu M. Investigation of hydraulic regime at middle part of the Loire River in context of floods and low flow events, Pollack Periodica, Vol. 13, No. 1, 2018, pp. 145‒156.
[3] De Franco M., Minniti M., Versaci R., Foti G., Canale C., Puntorieri P. Flash floods in urban areas: Case studies in Reggio Calabria (Italy), in: Mannina G. (Ed) New trends in urban drainage modeling, Springer, 2018, pp. 441‒446.
[4] Darwish M. M., Fowler H. J., Blenkinsop S., Tye M. R. A regional frequency analysis of UK sub‐daily extreme precipitation and assessment of their seasonality, Int. J. Climatol, Vol. 38, No. 13, 2018, pp. 4758–4776.
[5] Bryndal T., Franczak P., Kroczak R., Cabaj W., Kołodziej A. The impact of extreme rainfall and flash floods on the flood risk management process and geomorphological changes in small Carpathian catchments: A case study of the Kasiniczanka river (Outer Carpathians, Poland), Natural Hazards, Vol. 88, No. 1, 2017, pp. 95–120.
[6] Vasilaki M., Kohnová S., Hanel M., Szolgay J., Hlavčová K., Loukas A., Rončák P.
Detection of future changes in seasonality in extreme short-term rainfall in selected stations of Slovakia, Contributions to Geophysics and Geodesy, Vol. 47, No. 2, 2017, pp. 133‒148.
[7] Mallakpour I., Villarini G. Analysis of changes in the magnitude, frequency, and seasonality of heavy precipitation over the contiguous USA, Theoretical and Applied Climatology, Vol. 130, No. 1-2, 2017, pp. 345‒363.
[8] Bara M. An analysis of rainfall intensities in Slovakia (in Slovak), PhD Thesis, Slovak University of Technology, Bratislava, 2010.
[9] Földes G., Kohnová S., Hlavčová K. Analysis of future changes in the trends and scaling coefficients for short-term rainfall in southwestern Slovakia, Pollack Periodica, Vol. 13, No. 3, 2018, pp. 163‒174.
[10] Bara M., Gaál L., Kohnová S., Szolgay J., Hlavčová K. On the use of the simple scaling of heavy rainfall in a regional estimation of IDF curves in Slovakia, Journal of Hydrology and Hydromechanics, Vol. 58, No. 1, pp. 49‒63, 2010.
[11] Bara M., Kohnová S., Gaál L., Szolgay J., Hlavčová K. Scaling of short term rainfall intensities in Slovakia (in Slovak), Key Publishing, Ostrava, 2010.
[12] Nakicenovic N., Swart R. Special report on emission scenarios, A special report of Working Group III of the Intergovernmental Panel on climate change, Special Report on Emissions Scenarios, Cambridge University Press, Cambridge, UK, 2000.
[13] Burn D. H. Catchments similarity for regional flood frequency analysis using seasonality measures, J. Hydrology, Vol. 202, No. 1-4, 1997, pp. 212–230.
[14] Mann B. H. Nonparametric tests against trend, Econometrica, Vol. 13, No. 3, 1945, pp. 245‒259.
[15] Kendall M. G. Rank correlation methods, British Journal of Mathematical and Statistical Psychology, Vol. 9, No. 1, 1956, pp. 68-68.
[16] Koutsoyiannis D., Foufoula-Georgiu E. A scaling model of storm hyetograph, Water Resources Research, Vol. 29, No. 7, 1993, pp. 2345–2361.
[17] Menabde M., Seed A., Pegram G. A simple scaling model for extreme rainfall, Water Resources Research, Vol. 35, No. 1, 1999, pp. 335−339.