János Amrik – Gusztáv G. Hittig – Zsolt Gál – Judit Bárczi – Zoltán Zéman
Investing in the Future 1
Summary
The purpose of this study is to investigate empirically the role of innovation activity in 16+1 cooperation, within the Central and Eastern Europe (CEE). We also identified those internal and external factors, which might cause improvements in innovation performance of CEE companies. Our main focus was on technology-based research and innovations. We applied qualitative research methods. Our findings demonstrate that CEE companies have significant contribution to performance. We found that key success factors of these organisations are based on four elements: knowledge manage- ment, access to financial resources, managing formal and informal networks, as well as achieving synergies between technological and non-technological innovations. The preparation of the analytical study was facilitated by being part of a Slovenian-Hun- garian MASH European Grouping of Territorial Cooperation and thus, through our cross-border relations, we have more information, we are deeper into the functioning and / or non-functioning EU systems.
Journal of Economic (JEL) codes: B22, B27, C15, F02, O31, O32, 033, O57
Keywords: innovation management, R&D, technology, Central and Eastern Europe, OBOR, China
János Amrik, Executive Director, MASH European Grouping of Territorial Coop- eration, Hungary (janos.amrik@gmail.com); Gusztáv G. Hittig, President, Quan- tum Information Lab (QIL), Director, MASH European Grouping of Territorial Cooperation, Hungary, Associate Professor of Computer Science with Cyber Secu- rity, Szent István University (gusztavhittig@yahoo.com); Zsolt Gál, PhD student, University of Pécs (gzs@ccprint.hu); Judit Bárczi, Associate Professor, Szent István University (barczi.judit@gtk.szie.hu); Zoltán Zéman, Full Professor, director of in- stitute of Szent István University (zeman.zoltan@gtk.szie.hu).
The myth of the European paradox
We attempt to provide an overview on the questions raised by the current trends and changes in research and development, innovation and the approaches towards them.
In Europe and in Hungary, the debate around research and development (R&D) mainly caused by the re-proposed targets of EU’s Lisbon Strategy, which puts the edu- cation, the research and the innovation, as the “triangle of knowledge” to the focus as the vault of European competitiveness. The rhetoric of the “European dream” built around society is overshadowed by statistical data showing that position of the conti- nent is deteriorating in the global competitiveness.
The permanent restructuring and shifting preferences of the R&D sector cannot be always explained by the traditional concepts of social sciences. Although the trend setting school of economics is still the neoclassic, the economics based innovation man- agement started to focus on economic-evolution theory. The latter seems to be more ap- plicable to the “new economy” deeply founded in society, as it has non-linear dynamics.
We would like to put your attention to those changes of R&D, which requires estab- lishing new indicators. As the unintended alteration of paradigm resulted changes and the new types of technology-application based society innovation provided aesthetic developments and new cultural contents require new types of valuation methods.
Today’s change diagnosing studies are not based on technology sectors, but rather on geo-political environment. We could clearly see the globalisation of R&D and the winners of its globalisation are China and India. Europe is loosing out contrary to the developing economies of Asia. The innovation output of the “old continent” is getting compared to the USA, which contrast out the lag of performance and demol- ish the myth of the “European Paradox”. The essence of European Paradox is that number of scientific publications of Europe in par with the USA, what indicates that Europe has the upper hand and if it can exploit this, than Europe can overcome its disadvantage in competitiveness. However, we have to emphasise the misleading na- ture of such a conclusion. When we analyse the usage of these publications, we have to conclude that the USA has the real advantage.
When we narrow down the number of countries and create the “Visegrád Para- dox”, we see that Central and East Europe has an even worse application level of its scientific capacity and performance compare to the EU15. The 4 Visegrád countries have only one way to step forward by creating a European Research Area (ERA) by reconciling their innovation processes and systems.
Brussel tries to push these 4 countries to increase the efficiencies of their innova- tion systems. The Lisbon Strategy is targeting the R&D spending level at 2.5% of GDP at state level and the double of this at the private sector.
The question remains: what model Hungary should use to be able to have knowl- edge based economy. For example, the ”Finnish Miracle” is not only a set of target oriented rules and legislations, but it required an appropriate social-cultural environ- ment too. On the other hand, Singapore or the Silicon Valley are using completely different models for their flourishing innovation spray.
European Innovation Scoreboard
R&D and innovation (R&D+I) are elements of the economic development, which requires target oriented, long term planning without the possibility of instantane- ous measurement most of its impact. The centre of innovation is the mind and thinking, but the successful innovation is also creating applications and products, which are practical, they are able to be used in real life. The costs of R&D become an investment only if the result will be used and than its application will become an achievement. To measure the successfulness of R&D and innovation we need to assess the inputs and outputs to see the appropriateness of money spent and quality of expedient. The expenditures of R&D and innovation could be measured by various ratios to provide information to fine-tune the eco-political targets with expectations.
The European Union, to measure the effectiveness of R&D and innovation, cre- ated a complex indicator system comprising 8 dimensions, within that 25 ratios and the summarized value of all provides an index number, which evaluates the results of R&D and innovation. To be consistent and comparable, it uses a unified, statistic based set of data specific to R&D and innovation activities. The content of each ratio (indicators) is clearly defined. The reliability is ensured by the use of data solely pro- vided by the statistical offices of the Member States of the Union.
Our analysis for 2015 details out the major numbers of performance of R&D and innovation by the EU-indicator system and also provides a comparison of these figures for the period between 2008 and 2015. For specifically Hungary, we provide an over- view of legal framework, organisation of support and the major targets, strategy and performance indicators from 2010 onward.
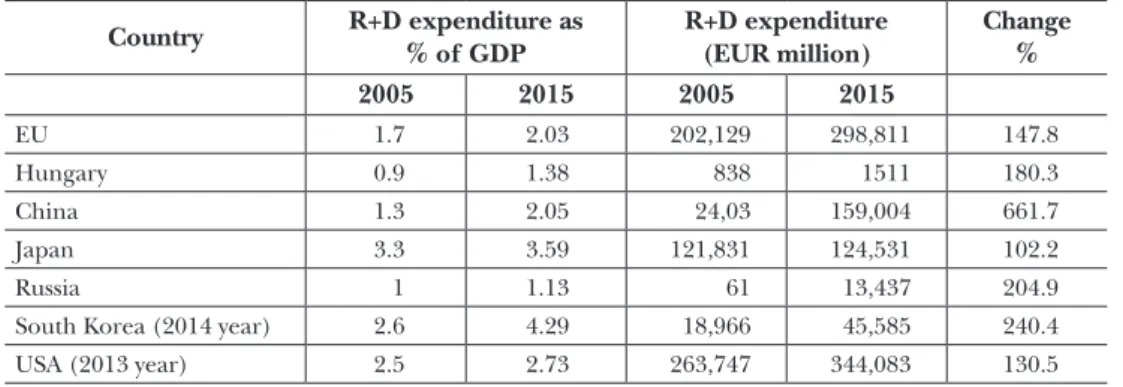
The most commonly used international ratio to express the costs spent on R&D and innovation is to state the total expenses as percentage of the GDP. From 2000 to 2015 the GDP based spending in the EU and in Hungary has increased, but fall a bit short of the original target number. Both the Lisbon Strategy and the later approved Europe 2020 strategy have the explicit target number for R&D and innovation spend- ing level at 3% of the GDP for the EU Member States. In 2010, Hungary had a target figure of 1.8% for 2020 and achieved the level of 1.38% in 2015.
The European Innovation Scoreboard (EIS) shows the relevant data for the given year per country by the combined innovation index and puts the Member States into four different performance category:
1) Leading innovator: states significantly succeeding the EU average innovation performance;
2) Strong innovator: those countries which have at or above innovation perfor- mance compare to the EU average;
3) Moderate innovator: the performance is slightly below the EU average innova- tion performance;
4) Lagging innovator: the ones with considerably lower performance compared to the EU average.
In 2008 Hungary had lower performance than the EU average in innovation, but remained as a moderate innovator and continued as moderate innovator for the pe- riod 2008-2015. Hungary, on the basis of 2015 data, achieved 68% of the EU average innovation performance with a slightly decreasing tendency. Reviewing the details of Hungarian data for 2015, we could see the country has underperformed in all dimen- sions of the EU average. 20 out of the 25 ratios did not reach the EU average and in case of 5 ratios it exceeded it. In case of 11 ratios the performance of the country has improved in 2015 compare to previous years. Compare to EU countries, the Hungar- ian SMS sector’s innovation performance is very weak. Within the Hungarian SMS sector, the companies carrying out innovation activities represents only 10.6% of the sector total, which is about the third of the EU average (28.7%) and only 12.8% of them introduced new products or innovative process into their activities. The R&D and innovation activities are concentrated at the large enterprises in Hungary.
The GDP-based R&D and innovation expenditures were under or about at 1%
in Hungary for the past 2 decades. Such stagnation did not motivated research and development at all. Since 2008 we could see a change of course by an above 1% level of spending in the sector.
The analysis of the EU indicator system shows that those countries at the top of the innovation performance are delivering average exceeding results at almost all dimensions. This fact is also supporting that the innovation as such is a very complex phenomenon and its success requires appropriate contribution form a number of factors parallel. That is why there was no fast pace or significant change in the hier- archy of positions amongst the countries between 2008 and 2015. However, some of the countries managed to improve their performance year by year, hence achieved a considerable result over the period.
We have reviewed the 8 dimensions used for comparison to identify those with the strongest link to innovation performance. On the basis of 2015 data, the strongest cor- relation is between the overall index and “enterprises and relations”. There is also a very strong correlation between overall index and “research systems”. The enterprises and relations dimension measures the innovation at small and medium-sized (SMS) enterprises and the innovative-cooperation amongst them. These are the ratios where Hungary lags behind within the EU. These are also show that the very modest level of R&D and innovation at the SMS sector drags back the overall performance of Hun- gary. Also, there is a very limited number of small enterprises founded for innovation and related activities.
The Lisbon Strategy and the Europe 2020 strategy and furthermore the Horizont 2020 programme are dedicated to set goals and objectives supporting the economic growth, job-creation, R&D and innovation to enhance the competitiveness of the Eu- ropean Union. These targets have to be applied at the Member States’ budgets, eco- policies and strategies to support a sustainable and inclusive expansion priority.
In Hungary, these strategies were the basis of support to R&D and innovation both domestic and international point of view. During the period 2007-2013 the “New Hungary Development Plan”, the “Science, Technology and Innovation Policy”, the
“National Action Programme” and the “New Széchenyi Plan” were those strategic initiatives. For the period 2014-2020 these initiatives are the “Investment into the Fu- ture – National Research, Development and Innovation Strategy”, the “White Books for Research, Development and Innovation”, the “National Smart Specialisation Strat- egy” and the “Széchenyi 2020” are the approved operative programmes of the Hun- garian government on the fields of R&D and innovation.
The framework of the Hungarian R&D and innovation activities are set on the basis of the EU’s budget cycles, relevant policies, performance formatives and strategy framework.
For the period 2007-2013, the strategy of the science, technology and innova- tion policy set the goals of the expansion of research and development activities at enterprise level, creation of research universities, establishment of internationally recognised R&D and innovation centres, strengthening of knowledge based social competitiveness, and capacity expansion of regional R&D and innovation. The “In- vestment into the Future” as the national R&D+I strategy now includes the Science-, Technology- and Innovation Policy Strategy. All of these strategies put emphasis on improvement of R&D and innovation at enterprise level to increase the competitive- ness of the knowledge-based society, the creation of knowledge base, encouraging cooperation between enterprises and research institutions and regional development incorporated in the complex national R&D strategy.
The Hungarian strategies and programmes for R&D and innovation comprise per- formance indicators (with set numbers and ratios). The achievement of those targets, however, cannot be measured by publicly available data.
After 2010 in Hungary the required changes of legislation, supporting organisa- tions and systems are initiated and at some areas are even completed to backing R&D and innovation. The National Research, Development and Innovation Office (NRDI Office) have been established at 1 January 2015. This office replaced all other R&D- oriented sub-organisations and stipulates both horizontal and vertical cooperation and coordination amongst the participants. Such reorganisation of the supporting environment caused some delays in the realisation of R&D strategies.
With the creation of NRDI Office the Hungarian Government intended to set a framework to a more effective coordination of public financing. The increase in available funds require a more advanced level of coordination not only at a national level, but at the level of the Union, which, amongst others, includes supporting pro- grammes, standardised patent and copyright protection, involvement of venture capi- tal, joint programmes of different organisations and different countries in accord- ance with the best practices of EU Member States.
There are two main questions to be answered with regards to the evaluation and assessment of R&D+I performance of activities:
1) The evaluation of performance of the EU Member States indicates that the leading and strong innovators are having a balanced and generally high performance in all dimensions. This means that those countries are able to deliver strong perfor- mance where all the parameters and conditions of successful innovation are present.
What could be the conclusion to those who prepare and execute the Hungarian in- novation strategy?
2) The analysis of correlation between the dimensions and the aggregated innova- tion index show that the most comprehensive relation is between the innovation in- dex and the “enterprises and relations” dimension (0.923). This dimension measures the innovation level of small and medium-sized (SMS) businesses and the coopera- tion/interactions amongst them. The same time, these are the ratios where Hungary lags behind within the EU. How and with what could we increase the innovation per- formance of small and medium-sized businesses?
Conclusion or “rolling dollars”
How could we get to the conclusion even before we have the analysis done? It is really simple! We have already indicated that how many national and EU organisation; of- fice and institutions are busy with the management of R&D+I. Some estimates (these are really just estimates) the number of entities involved in R&D within the European Union is about 100, and the Member States have couple of thousands of additional organisations. One could conclude, in reflection to these numbers, the less would be more!
Now, if 16 other countries hold the mirror to the current structure, than we could say “it is even worse” because in those countries where (compared to GDP or innova- tion level) the R&D+I level is more successful, the number of supervisory or managing entity is inversely proportional. More developed and more successful R&D in a coun- try means fewer supporting and/or supervising entity. This is not due to centralisa- tion, but the recognition of that R&D and innovation could not be effective with too many layers of autocracy.
In certain developed countries the decentralized, over simplified control and man- agement structure could also lead to troubles, like in Germany, where the large car manufacturers under the cover of R&D instead of real innovation just falsified the emission data for their diesel engines.
Naturally, attempts to cheat the system is always be there, but it does not invalidate the original conclusion, namely, the level of economic development is reversely pro- portional to the size of autocracy, the water-head of public services.
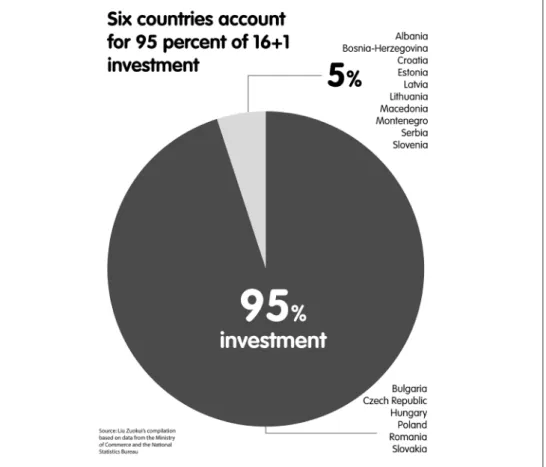
Back to the mirror-example, now 16+1 country holds the mirror, because of China.
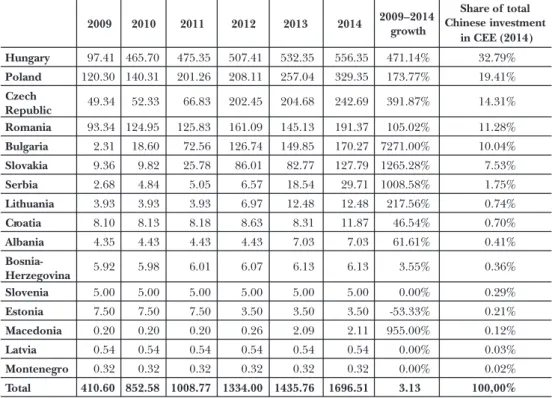
As you could see China made 95 % of its investments in 6 countries with developed economy. The Table 1 shows the relevant numbers and ratios of these investments.
As mathematician and researcher of physics and quantum computing, someone really effected by R&D and innovation, we were puzzled and disturbed. What has hap- pened here? Hungary received 36.79% of the total Chinese investment in the region and what has happened with it? Where is it? In which sectors? And this sum is about the total of investment made in Poland and Czech Republic.
It is not our task to identify responsibility, but we could see that something does not happened the way how it should have been. We are sure it is partly due to the
Figure 1: Six countries account for 95 percent of 16+1 investment
Source: Liu Zuokui's compilation based on data from the Ministry of Commerce and the National Statistics Bureau
overwhelming number of supervisory and management organisations with highly un- productive processes. The invested amount of USD millions should have had direct, measurable effect on the increase of GDP.
We could simply state that, on the basis of our experience and gathered data, but also by a rough estimation that Hungary, including the other 2 developed countries from the 16, did not utilize the economic growth potential provided by the Chinese investments.
But if the +1 country really want to make all its efforts to properly invest the mil- lions and billions of investments outlined in the 16+1 model, the One Belt One Road theory, the expectations of the New Silk Road project, than these resources should be the financial basis of a new dawn of development and not rolling dollars programmes.
We know the 16+1, the OBOR is at an early stage of development, but this is the time, together with our Chinese scientist colleagues to create a “professors’ committee”
(which has to be acknowledged by the 16+1) and this committee would have the
responsibility to prepare and oversee the most effective programme of research, de- velopment and innovation to be able to use the financial resources invested in future scientific work in that most efficient way. Naturally the results and achievements would be shared amongst the 16+1 countries.
Similarly, as described above as “professors’ committee” for R&D and innovation, we have to set up some other, equally important committee, like for traffic and trans- portation, energy policy, etc. Obviously, these committees are forced to cooperate, as there is no clear cut amongst the fields/areas, like the self-driving cars or smart cities programmes. Evidently, as we think about it, the 16+1 countries, or China itself should set up a sort of “Office of Planning” where these committees could work, cooperate and coordinate their work, this could be the “China-CEEC Planning Board”.
Table 1: Chinese investment in 16 CEE countries in 2009 and 2014 (stock/USD m)
2009 2010 2011 2012 2013 2014 2009–2014 growth
Share of total Chinese investment
in CEE (2014) Hungary 97.41 465.70 475.35 507.41 532.35 556.35 471.14% 32.79%
Poland 120.30 140.31 201.26 208.11 257.04 329.35 173.77% 19.41%
Czech
Republic 49.34 52.33 66.83 202.45 204.68 242.69 391.87% 14.31%
Romania 93.34 124.95 125.83 161.09 145.13 191.37 105.02% 11.28%
Bulgaria 2.31 18.60 72.56 126.74 149.85 170.27 7271.00% 10.04%
Slovakia 9.36 9.82 25.78 86.01 82.77 127.79 1265.28% 7.53%
Serbia 2.68 4.84 5.05 6.57 18.54 29.71 1008.58% 1.75%
Lithuania 3.93 3.93 3.93 6.97 12.48 12.48 217.56% 0.74%
Croatia 8.10 8.13 8.18 8.63 8.31 11.87 46.54% 0.70%
Albania 4.35 4.43 4.43 4.43 7.03 7.03 61.61% 0.41%
Bosnia-
Herzegovina 5.92 5.98 6.01 6.07 6.13 6.13 3.55% 0.36%
Slovenia 5.00 5.00 5.00 5.00 5.00 5.00 0.00% 0.29%
Estonia 7.50 7.50 7.50 3.50 3.50 3.50 -53.33% 0.21%
Macedonia 0.20 0.20 0.20 0.26 2.09 2.11 955.00% 0.12%
Latvia 0.54 0.54 0.54 0.54 0.54 0.54 0.00% 0.03%
Montenegro 0.32 0.32 0.32 0.32 0.32 0.32 0.00% 0.02%
Total 410.60 852.58 1008.77 1334.00 1435.76 1696.51 3.13 100,00%
Source: Liu Zuokui's compilation based on data from the Ministry of Commerce and the National Statistics Bureau
In such a case it would not happen a case like the Belgrád-Budapest railway line with spending hundreds of USD millions and at the end to discover that the project could not get the necessary authority approval from the EU. Please review the possibil- ity of such option; otherwise the 16+1 or OBOR could end up like the hundred-legs EU, with many legs and he goes slow.
Measuring the results of R&D activities
The R&D and Innovation are result oriented improvements of economie, requir- ing long term planning and determination, but some or most of the elements of suc- cess are not measurable immediately. There are certain factors playing role on the return or recovery of expenses born by R&D. Innovation and R&D activities are over- lapping and strongly related to each other. Their relation is based on the innovation chain (basic research, applied research, pivotal development, technological applica- tion, mass production, consumption). When the areas of interrelations are successful, the elements create the innovation chain and due to the complexity of the flows and reactions, the elements are not separable. Please note that not all initiatives reach the level to become an innovation chain to be a product or a sale-ready service.
The center of Innovation is the thinking, however, the successful innovation also needs demand from the user, beneficial side. The expenses occurred could become investment only when the result becomes product or service sold, thus make the inno- vation quantifiable. The success of research, development and innovation are gauged differently. In research, the level of success is measured by the scientific level of the re- search. Development is assessed by the application of technology or process to achieve the relevant goal of economy or society. In case of Innovation, the gauge is the result achived by the application of the outcome of research and/or development.
The R&D+I activities are getting more and more determining factor of economic progress, hence there is relevant legislation in place to ensure the proper use of re- sources for such activities in Hungary. The Act of 2014 on Scientific Research, De- velopment and Innovation provides the framework of all and any activity enhancing the competitiveness and income generating capabilities of the society to conclude a sustainable economic growth and job creation.
To be able to gauge the performance of R&D+I activities, we need to evaluate the effectiveness of money spent by reviewing the expenses paid. In practice it means the introduction of a permanent monitoring system of spending, including the constantly updated calculation of various ratios to ensure that we get an early warning in case of significant deviation from the original target, hence providing the possibility of adjust- ment. Such a permanent analysis of research results deliver substatial information to judge whether there is a need of fine-tuning of current activities to be able to meet prior targets set by eco-political directives.
The European Innovation result table
The European Union has created a complex indication system using a calculated sum of individual ratios and dimensions generating one index-value which assess the suc- cessfulness and effects of R&D+I activities. To be able to use such calculation method, it is important to have unified statistical data structure providing the relevant and comparable values for assessment. Comparability is achieved by the pre-defined cal- culation method of the required ratios (indicators) and the reliability and availability
ensured by the Statistical Bureau/Offices of the Members States (Eurostat is one of the Central Directorate of the EU created to provide central statistical figures to the institutions of the EU and to harmonize the applied statistical methodologies by the Member States, the EFTA countries and EU member applicants.
The European innovation performance result summary table, which earlier called
“Innovative Union result summary table”, is a structured set of data about the innova- tion performance of EU Member States comparing it to non-EU member states and to regional neighbours’ performances.
The current layout of the table is made since 2010 (prior to 2010 it was a different table with similar data content, e.g. in 2009, it was called European Innovation Pro- gress Report), therefore it allows the comparison of years and provides the possibility to draw up tendencies. Furthermore, it enables us to set up grading of the countries and to analyse the performance changes of the countries. It also provides the rel- evant breakdown of indicators of the R&D+I by country and per sectors with identical data content. The ratios are calculated regardless to specific circumstances of vari- ous countries, but fulfilling the indicator function via data-reduction to minimize the need of special, area or circumstance related information. The indicators are able to exhibite the current status, but cannot display the reasons, which requires further analysis and collection of additional information.
The performance result summary table of the Union indicates the relative streng- hts and weaknesses of the national innovation structures and helps to determine the areas requiring improvements per country. In recent years, there were slight modifica- tions to the sources of information and the definitions of methodologies to the indica- tors. Any content type change to the ratios are listed next to the result summary table and to enable the comparability of country-performances it also includes the innova- tion values calculated in line with the previous definitions, e.g. the data relating to scientific cooperations is derived from the Centre for Science and Technology Studies (CWTS) web Science, but the figures for 2015 has been calculated on the basis of Sco- pus data. The differences are in e.g. the definition of capital investment (currently we use industry-sector statistics instead of Industrial statistic figures) the latter providing the figure for total capital investment from a country, but the previous one providing the figure of capital investment in the country; the two do not necesserely overlap.
The ranking list of innovation performance of the countries is calculated in a very complex manner called the Summary Innovation Index, which accumulates the R&D+I performances measured by 25 different ratios. The values in the ranking list represent the average value of those ratios, however, if you take the ratios individually, there might be sometimes significant deviation in ranking of a given country per different ratios.
These 25 ratios which examining the varous factors and effects of innovative activi- ties could be categorized into 3 main groups:
1) Elements necessary to innovation activities, such as human resources, research system, financing and financial support;
2) Indexes measuring the innovation activity level of enterprises in the EU, such as ratios on assets, intellectual properties, inter-company transactions and trading activities;
3) Indicators of factors influencing the economy as whole, like economic environ- ment, etc.
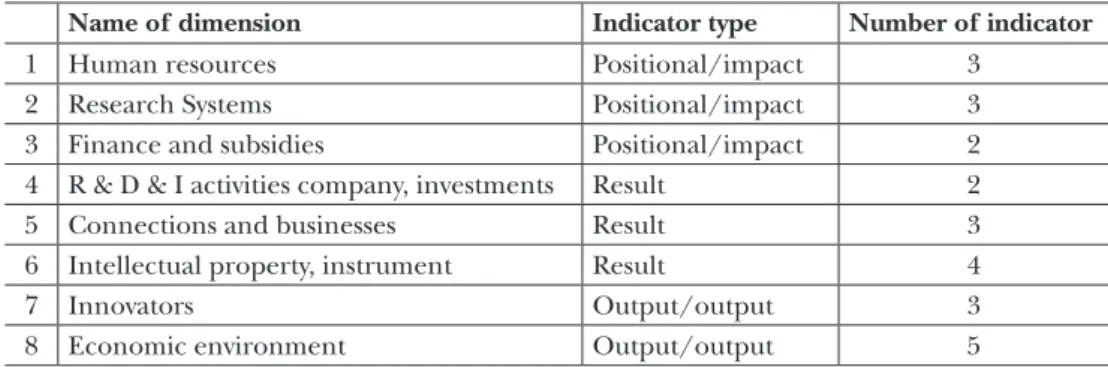
To have a more detailed groupping of the 25 ratios of the indicator system, they are splitted into 8 dimensional main category. Within the dimensions the ratios dedi- cated to certain areas, such as 5 ratio for measuring the economic environment, 4 ratio assessing the intellectual properties and products, furthermore 2-3 ratio to evalu- ate the performance of other areas.
Every ratio is a proportional value, which relates an R&D+I activity to an other value, e.g. GDP, size of population, etc. to partially filter out the deviative effect of absolute values. The assessment of innovation activities made by both of the complex indicator system as an overall evaluation and by the dimensional ratios, as individual parameters. We have summarised the dimensions, types and categories of the ratios in Table 2, the definition of indicator types provided in the glossary.
Table 2: Dimensions of the EU Innovation Scoreboard
Name of dimension Indicator type Number of indicator
1 Human resources Positional/impact 3
2 Research Systems Positional/impact 3
3 Finance and subsidies Positional/impact 2
4 R & D & I activities company, investments Result 2
5 Connections and businesses Result 3
6 Intellectual property, instrument Result 4
7 Innovators Output/output 3
8 Economic environment Output/output 5
Source: Edited by the State Audit Office of Hungary
Evaluation of the indicators only possible via comparison, as in most of the cases there are no generally accepted value levels. The direction and level of connection amongst the ratios could be examined by correlation coefficients. The correlation is measurable to prove or disprove the paralel movement of certain ratios. In case of analysis, we could disregard the top and lowest values (top and lower decile).
The statistically significant changes could be determined, also the tendencies, the averages are measurable, the deviations from the averages are quantifiable. How- ever, the indexes do not filter out the effect of lower innovation level of countries recently joined the EU, therefore these figures are distorting the overall and aver- age values.
The actuality of figures for 2015 (published in 2016) is improved compare to previ- ous years. To push the publishing date somewhat later allowed to have the most recent figures included in the report. The sources of information have also changed, like the copyright and patent data has been provided by EUIPO (European Union Intel- lectual Property Office), venture capital investments’ data are from Invest Europe (Eurostat has only indirect sources about it).
EU country ranking 2015
In 2016, the European Innovation Scoreboard summary has been published on the basis of 2015 results and evaluated the innovation accomplishments by the combined in- novation index (as in previous years) and listed 4 performance group of the Member States.
1) Denmark, Finland, Germany, The Netherlands and Sweden are the leading in- novators with their innovation index substantially exceeding the EU average (innova- tion leaders).
2) Belgium, France, Ireland, Luxemburg, Slovenia and the UK are strong perform- ers, having innovation index values around the average value (strong innovators).
3) Croatia, Cyprus, Czech Republic, Estonia, Greece, Hungary, Italy, Latvia, Lithu- ania, Malta, Poland, Portugal, Slovakia and Spain are having index values somewhat below the EU average and considered as moderate performers (moderate innova- tors).
4) Bulgaria and Romania have innovation index values significantly under the EU average, hence are seen as lagging behind performers (modest innovators).
The summary table show the ranking in accordance with an average innovation performance, but the detailed calculation show a far more fragmented picture with significant deviations in various ratios. The summary table provides a fair ranking, however, it could be used only partially to evaluate efficiency. To spend a higher % of GDP on R&D, or having an elevated ratio of people with higher education of the population, or the increase of the number of small and medium-sized business in the economy do not mean the increase of innovation performance, but there are other factors to be taken into consideration (e.g. number of researchers, renumeration and other incentives, etc.).
The general innovation performance and the country ranking based on the over- all innovation indexes are similar to previous years, there are no significant deviation between the years. The good performers had good performance in every year. Meas- urable deviations had happened, but they are not tendentious.
In 2015, there were two significant change within the performance groups, Latvia became moderate performer (prevously it was lagging behind performer) and the Netherlands stepped up to leading innovator from strong performer.
Hungary has been a moderate performer in 2015, leaving most of its Central Eu- ropean neighbours behind, such as Slovakia, Poland, Latvia, Lithuania, Croatia and also the lagging behind performer Bulgaria and Romania. The Czech Republic and Estonia had better performance, while Slovenia is amongst the strong performers due to its balanced and over the EU average results. In the EU28 ranking, Hungary has the 20th place based on its overall innovation index, which was 0.355 (the EU average is 0.521) in 2015. The ranking is shown in Figure 2, giving different colors to the differ- ent performance groups and to the EU average.
Figure 2: Innovation performance of EU Member States based on the aggregate index for 2015
Source: EC, 2016; edited by the State Audit Office of Hungary
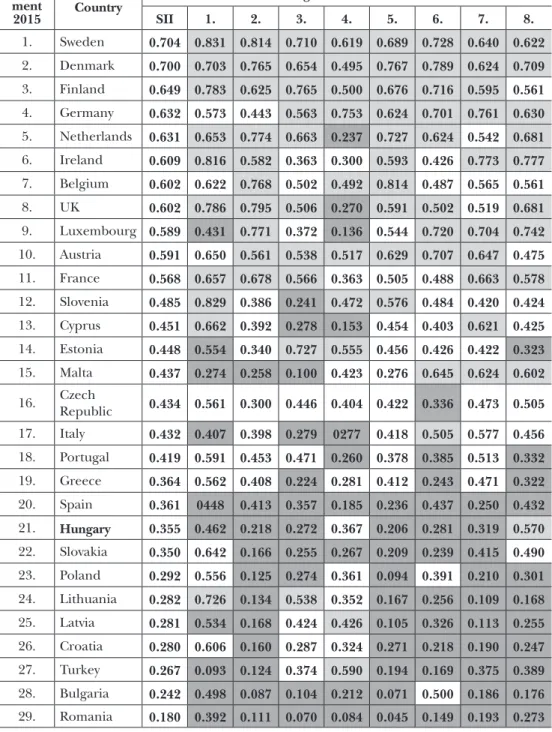
Innovation performance per dimension in the EU in 2015 Table 3 details the overall and the dimensional average index values for the EU coun- tries and Turkey, the values of the top deciles are dark and lower deciles are light (the description/specification of the dimensions contained in Table 2).
Table 3 shows that the leading innovators (countries in row 1 to 5) are in the top deciles in most of the dimensions, in other words, they show an evenly high perfor- mance. Similarly, the countries at the end of the list have results at the lower deciles and some countries have higher performances in certain dimensions, like Lithuania, compare to its category. Even in case of leading innovators, in some dimension, there could be areas where they have a lower value level, like Finland, Germany or Ireland and even some countries have performance level at the lower deciles, in case of the Netherlands and the UK.
From an overall point of view, the highly balanced level of performance in all eight dimensions supports the interpretation of that innovation is a very complex phenomenon influenced by the joint effects of many parameters together. Some of the countries have outstanding results in some of the dimensions, however, they can- not be leading innovators, because the under-performance of the other dimensions weight out the lead.
Out of the 8 dimensions, Hungary is amongst the lower 10 countries in 6 dimen- sions, 1 dimension’s performance is in the middle and an other one in the top 10 countries category.
In 2015, the joint index of enterprises operating in R&D+I activities in Hungary reached the 86.1% of the EU level, however, it is still a significant improvement com- pare to 2014 (almost 16% increase year on year). Regardless to the improvement, this
Table 3: The combined innovation index of EU countries and Turkey and the average index of dimensions in 2015
Place-
ment2015 Country Average Index Dimensions
SII 1. 2. 3. 4. 5. 6. 7. 8.
1. Sweden 0.704 0.831 0.814 0.710 0.619 0.689 0.728 0.640 0.622 2. Denmark 0.700 0.703 0.765 0.654 0.495 0.767 0.789 0.624 0.709 3. Finland 0.649 0.783 0.625 0.765 0.500 0.676 0.716 0.595 0.561 4. Germany 0.632 0.573 0.443 0.563 0.753 0.624 0.701 0.761 0.630 5. Netherlands 0.631 0.653 0.774 0.663 0.237 0.727 0.624 0.542 0.681 6. Ireland 0.609 0.816 0.582 0.363 0.300 0.593 0.426 0.773 0.777 7. Belgium 0.602 0.622 0.768 0.502 0.492 0.814 0.487 0.565 0.561 8. UK 0.602 0.786 0.795 0.506 0.270 0.591 0.502 0.519 0.681 9. Luxembourg 0.589 0.431 0.771 0.372 0.136 0.544 0.720 0.704 0.742 10. Austria 0.591 0.650 0.561 0.538 0.517 0.629 0.707 0.647 0.475 11. France 0.568 0.657 0.678 0.566 0.363 0.505 0.488 0.663 0.578 12. Slovenia 0.485 0.829 0.386 0.241 0.472 0.576 0.484 0.420 0.424 13. Cyprus 0.451 0.662 0.392 0.278 0.153 0.454 0.403 0.621 0.425 14. Estonia 0.448 0.554 0.340 0.727 0.555 0.456 0.426 0.422 0.323 15. Malta 0.437 0.274 0.258 0.100 0.423 0.276 0.645 0.624 0.602 16. Czech
Republic 0.434 0.561 0.300 0.446 0.404 0.422 0.336 0.473 0.505 17. Italy 0.432 0.407 0.398 0.279 0277 0.418 0.505 0.577 0.456 18. Portugal 0.419 0.591 0.453 0.471 0.260 0.378 0.385 0.513 0.332 19. Greece 0.364 0.562 0.408 0.224 0.281 0.412 0.243 0.471 0.322 20. Spain 0.361 0448 0.413 0.357 0.185 0.236 0.437 0.250 0.432 21. Hungary 0.355 0.462 0.218 0.272 0.367 0.206 0.281 0.319 0.570 22. Slovakia 0.350 0.642 0.166 0.255 0.267 0.209 0.239 0.415 0.490 23. Poland 0.292 0.556 0.125 0.274 0.361 0.094 0.391 0.210 0.301 24. Lithuania 0.282 0.726 0.134 0.538 0.352 0.167 0.256 0.109 0.168 25. Latvia 0.281 0.534 0.168 0.424 0.426 0.105 0.326 0.113 0.255 26. Croatia 0.280 0.606 0.160 0.287 0.324 0.271 0.218 0.190 0.247 27. Turkey 0.267 0.093 0.124 0.374 0.590 0.194 0.169 0.375 0.389 28. Bulgaria 0.242 0.498 0.087 0.104 0.212 0.071 0.500 0.186 0.176 29. Romania 0.180 0.392 0.111 0.070 0.084 0.045 0.149 0.193 0.273 Source: EC, 2016; edited by the State Audit Office of Hungary
value puts Hungary to the lower deciles, but you will also find strong performers in the category, like the Netherlands, the UK and Luxemburg. With favourable resource index, we find, amongst the top 10 countries, Lithuania (0.726), Slovenia (0.829) and the Czech Republic (0.561) from the Central European Region.
The financial and supporting indicators worsened in Hungary in 2015. They have fallen to 55.58% of the EU average and also considerably declined (about 4.4% weak- ening) compare to 2014. Interestingly, Ireland, Belgium and Luxemburg who are amongst the strong performers, have lower than EU average indicator value.
In 2015, in the research systems evaluating dimension Hungary has the lowest value (0.218). It is 0.248 lower than the EU average and has about 6% decline com- pare to the previous year. Generally this index has very high value at innovation leader countries, the only exception is Germany (0.443) who is below the EU average in this category.
The Hungarian performance is the worst in small and medium-sized businesses category, the index is continously and considerably under the EU average, which sig- nificantly influences the overall innovation performance of the country.
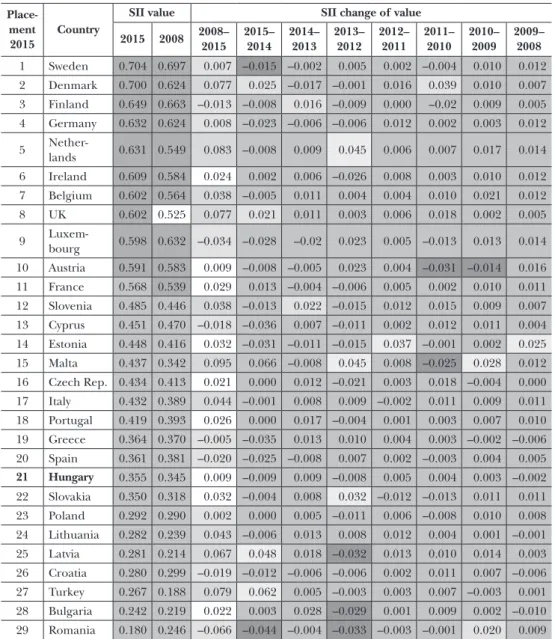
Change of innovation performance from 2008 to 2015 The Table 4 shows the 2015 ranking of the 28 EU countries on the basis of their over- all index values and also provides the index values of previous years (from 2008). This shows the tendencies of the 8 years in accordance with the innovation performance indexes per country. The values of the indexes are presented in appendix 1, the table shows the indication of tendencies only.
Having look at the table, it is clearly identifiable the advantage of Luxemburg in 2008 has been diminished, however, they are still in the group of top performers. On the other hand, the relative poor performance of the UK in 2008 improved so much it got close to the top performes in 2015. Within the moderate performers group, Malta had a declining trend until 2011, but they have managed to turn it around and got up to the average of the group by 2015. Croatia have done the contrary, it had a mixed but continous decline from 2008 to 2015. Meanwhile Hungary has a somewhat stagnating performance over this period.
Few tendencies
Table 5 shows a summary of the changes in the overall indexes of the EU Member States and level of change between 2008 and 2015. The top deciles is highlighted by dark color and the lower deciles is light. The table renders proper observation of changes over the 8-year period. There are 2 countries to be mentioned, the UK was able to manage to rise from the middle to the top deciles and Malta from the lower deciles to the midfield. On the other hand, taking a look of the dynamics of improvement, we find strong and leading performers (Denmark, the Netherlands, UK, Belgium and Slovenia) and moderate performer (Malta, Italy, Latvia, Lithuania
Table 4: Summary Innovation Index (SII) time series Quali fi cation
2015 Country Summary Innovation Index (SII)
2015 2014 2013 2012 2011 2010 2009 2008 Leading Sweden 0.831 0.814 0.710 0.619 0.689 0.728 0.640 0.622 Leading Denmark 0.703 0.765 0.654 0.495 0.767 0.789 0.624 0.709 Leading Finland 0.783 0.625 0.765 0.500 0.676 0.716 0.595 0.561 Leading Germany 0.573 0.443 0.563 0.753 0.624 0.701 0.761 0.630 Leading Netherlands 0.653 0.774 0.663 0.237 0.727 0.624 0.542 0.681 Strong Ireland 0.816 0.582 0.363 0.300 0.593 0.426 0.773 0.777 Strong Belgium 0.622 0.768 0.502 0.492 0.814 0.487 0.565 0.561 Strong UK 0.786 0.795 0.506 0.270 0.591 0.502 0.519 0.681 Strong Luxembourg 0.431 0.771 0.372 0.136 0.544 0.720 0.704 0.742 Strong Austria 0.650 0.561 0.538 0.517 0.629 0.707 0.647 0.475 Strong France 0.657 0.678 0.566 0.363 0.505 0.488 0.663 0.578 Strong Slovenia 0.829 0.386 0.241 0.472 0.576 0.484 0.420 0.424 Moderate Cyprus 0.662 0.392 0.278 0.153 0.454 0.403 0.621 0.425 Moderate Estonia 0.554 0.340 0.727 0.555 0.456 0.426 0.422 0.323 Moderate Malta 0.274 0.258 0.100 0.423 0.276 0.645 0.624 0.602 Moderate Czech
Republic 0.561 0.300 0.446 0.404 0.422 0.336 0.473 0.505 Moderate Italy 0.407 0.398 0.279 0277 0.418 0.505 0.577 0.456 Moderate Portugal 0.591 0.453 0.471 0.260 0.378 0.385 0.513 0.332 Moderate Greece 0.562 0.408 0.224 0.281 0.412 0.243 0.471 0.322 Moderate Spain 0448 0.413 0.357 0.185 0.236 0.437 0.250 0.432 Moderate Hungary 0.462 0.218 0.272 0.367 0.206 0.281 0.319 0.570 Moderate Slovakia 0.642 0.166 0.255 0.267 0.209 0.239 0.415 0.490 Moderate Poland 0.556 0.125 0.274 0.361 0.094 0.391 0.210 0.301 Moderate Lithuania 0.726 0.134 0.538 0.352 0.167 0.256 0.109 0.168 Moderate Latvia 0.534 0.168 0.424 0.426 0.105 0.326 0.113 0.255 Moderate Croatia 0.606 0.160 0.287 0.324 0.271 0.218 0.190 0.247 Moderate Turkey 0.093 0.124 0.374 0.590 0.194 0.169 0.375 0.389 Straggler Bulgaria 0.498 0.087 0.104 0.212 0.071 0.500 0.186 0.176 Straggler Romania 0.392 0.111 0.070 0.084 0.045 0.149 0.193 0.273 Source: EC, 2016; edited by the State Audit Office of Hungary
and Turkey) amongst them. Even the among the top performers you find countries with minimal improvement (Sweden, Germany) or decline (Finland). Despite these movements, the performance differences amongst the EU member countries did not change significantly. Exceptionally large progress is highlighted by light color and sig- nificant regressions with dark color. From 2012 onward the number of countries with worsening overall index values has increased.
Table 5: The aggregate index of innovations per country between 2008 and 2015
Place- ment 2015
Country
SII value SII change of value
2015 2008 2008–
2015 2015–
2014 2014–
2013 2013–
2012 2012–
2011 2011–
2010 2010–
2009 2009–
2008 1 Sweden 0.704 0.697 0.007 –0.015 –0.002 0.005 0.002 –0.004 0.010 0.012 2 Denmark 0.700 0.624 0.077 0.025 –0.017 –0.001 0.016 0.039 0.010 0.007 3 Finland 0.649 0.663 –0.013 –0.008 0.016 –0.009 0.000 –0.02 0.009 0.005 4 Germany 0.632 0.624 0.008 –0.023 –0.006 –0.006 0.012 0.002 0.003 0.012 5 Nether-
lands 0.631 0.549 0.083 –0.008 0.009 0.045 0.006 0.007 0.017 0.014 6 Ireland 0.609 0.584 0.024 0.002 0.006 –0.026 0.008 0.003 0.010 0.012 7 Belgium 0.602 0.564 0.038 –0.005 0.011 0.004 0.004 0.010 0.021 0.012 8 UK 0.602 0.525 0.077 0.021 0.011 0.003 0.006 0.018 0.002 0.005 9 Luxem-
bourg 0.598 0.632 –0.034 –0.028 –0.02 0.023 0.005 –0.013 0.013 0.014 10 Austria 0.591 0.583 0.009 –0.008 –0.005 0.023 0.004 –0.031 –0.014 0.016 11 France 0.568 0.539 0.029 0.013 –0.004 –0.006 0.005 0.002 0.010 0.011 12 Slovenia 0.485 0.446 0.038 –0.013 0.022 –0.015 0.012 0.015 0.009 0.007 13 Cyprus 0.451 0.470 –0.018 –0.036 0.007 –0.011 0.002 0.012 0.011 0.004 14 Estonia 0.448 0.416 0.032 –0.031 –0.011 –0.015 0.037 –0.001 0.002 0.025 15 Malta 0.437 0.342 0.095 0.066 –0.008 0.045 0.008 –0.025 0.028 0.012 16 Czech Rep. 0.434 0.413 0.021 0.000 0.012 –0.021 0.003 0.018 –0.004 0.000 17 Italy 0.432 0.389 0.044 –0.001 0.008 0.009 –0.002 0.011 0.009 0.011 18 Portugal 0.419 0.393 0.026 0.000 0.017 –0.004 0.001 0.003 0.007 0.010 19 Greece 0.364 0.370 –0.005 –0.035 0.013 0.010 0.004 0.003 –0.002 –0.006 20 Spain 0.361 0.381 –0.020 –0.025 –0.008 0.007 0.002 –0.003 0.004 0.005 21 Hungary 0.355 0.345 0.009 –0.009 0.009 –0.008 0.005 0.004 0.003 –0.002 22 Slovakia 0.350 0.318 0.032 –0.004 0.008 0.032 –0.012 –0.013 0.011 0.011 23 Poland 0.292 0.290 0.002 0.000 0.005 –0.011 0.006 –0.008 0.010 0.008 24 Lithuania 0.282 0.239 0.043 –0.006 0.013 0.008 0.012 0.004 0.001 –0.001 25 Latvia 0.281 0.214 0.067 0.048 0.018 –0.032 0.013 0.010 0.014 0.003 26 Croatia 0.280 0.299 –0.019 –0.012 –0.006 –0.006 0.002 0.011 0.007 –0.006 27 Turkey 0.267 0.188 0.079 0.062 0.005 –0.003 0.003 0.007 –0.003 0.001 28 Bulgaria 0.242 0.219 0.022 0.003 0.028 –0.029 0.001 0.009 0.002 –0.010 29 Romania 0.180 0.246 –0.066 –0.044 –0.004 –0.033 –0.003 –0.001 0.020 0.009 Source: EC, 2016; edited by the State Audit Office of Hungary
Hungary have been a very moderate innovator throughout the period between 2008 and 2015 (the performance increased only by 0.009).
Over the 8-year period, 21 of the EU Member States could improve its innovation index, however, Hungary has one of the smallest level of growth. The highest rise is made by Malta (0.095) and the Netherlands (0.083). Significant imrovements were made by some of the strong innovators, such as Denmark (0.077), UK (0.077), Bel- gium (0.038) and by the moderate ones, such as Slovenia (0.038) and Italy (0.044). It is very remarkable that 2 countries from the moderate innovators were able to jump to the top 10 performers, they are Lithuania (0.043) and Latvia (0.067). In case of 7 countries there were long term deterioration of performance, among those Romania had the biggest drop (–0.066) and it was a significant decline in case of Luxemburg (–0.034) who otherwise is considered a strong innovator. From the top countries, the leading Sweden had a minimal progress (0.007), while Finland had decline (–0.0013).
In the last period of 2014-2015 there were 18 member states with negative com- bined innovation index compare to the previous period, which indicates the exhaus- tion of reserves for the permanent growth. The negative change also reached the strong and top performers (Sweden, Finland, Germany, the Netherlands, Belgium, Luxemburg, Austria, Slovenia) and obviously the midfield players (Cyprus, Estonia, Italy, Greece, Spain, Hungary, Slovakia, Lithuania, Croatia).
Performance of Hungary compare to the EU average within the dimensions for the period between
2008 and 2015
The joint index is a calculated average of the separate indexes of the dimensions.
Table 6 presents the ration (in %) of the joint and the 8 dimensional indexes of Hun- gary compare to the EU average. In 2015, on the basis of that year’s data (EU average index value considered as 100%) Hungary has delivered 68% of the EU overall aver- age. Hungary’s performance had its highest level (72% of the EU overall average) in 2008. It is thanked to the fact one of the dimension had an average exceeding level of performance and an other one delivered at about the average (human resources di- mension 101.9%, R&D+I enterprices and investments dimension 100%). Throughout the period, these dimensions had mixed performance, while the rest of the dimen- sions had very little change.
In Table 6, the dark color indicates the areas where the Hungarian results are un- der 50% of the EU average over the 8-year period. These cells of the table in most part of the 8-year period clearly show that the performance of Hungary in R&D+I activities are under the EU average in the following categories: Research systems; Finance and subsidies; Connections and businesses.
The Connections and businesses dimension measures the innovation at small and medium-sized enterprices and the cooperation of such enterprises, where Hungary has a significant deficiency within the EU. In all the years the index was at or below the 50% of the EU average value.
Table 6: Changes in Hungary’s innovation performance by dimension between 2008 and 2015 as % of EU average values
Dimension/Year 2015 2014 2013 2012 2011 2010 2009 2008
Concentrated index 67.99 69.51 68.12 68.35 69.56 69.18 68.23 71.62 Human resources 80.30 80.36 80.72 88.58 79.33 81.74 74.63 101.91 Research systems 46.81 52.75 49.59 51.02 51.84 46.98 49.24 53.76 Finance and subsidies 55.58 61.00 58.16 55.75 42.34 45.41 49.18 51.94 R & D & I company, investment 86.10 70.21 63.47 58.52 78.61 81.30 75.74 99.97 Connections and businesses 43.48 45.82 44.89 42.14 50.32 50.69 50.11 44.28 Knowledge value, instrument 50.63 51.78 52.74 52.96 51.95 54.30 49.63 50.84
Innovators 60.66 56.22 52.97 54.34 52.46 56.28 56.28 55.11
Economic environments 99.43 107.62 108.10 108.58 115.66 109.06 111.38 106.39 Source: EC, 2016; edited by the State Audit Office of Hungary
Finance and subsidies dimension show the GDP rated level of expenditures on research and development in the public sector, where Hungary has about 50% of the EU average value.
In Research systems Hungary has an unfavourable tendency as the number of non- EU MA-s compare to total MA-s has a low ratio.
Hungary has its best performing dimension the Economic environment, where the figures are close or around the EU average. This dimension measures the employ- ment rate in the knowledge-intensive areas, the export of high-tech products, level of export in knowledge intensive services, sales of new innovation, licences and intel- lectual properties.
Human resources dimension was the area where Hungary could constantly deliver an EU average adjacent performance. It was the highest in 2008 (101.91% of the EU aver- age), but it slowly started to decline since 2012. Despite the favourable figures, Hungary is amongst the lower 10 countries in the ranks. The decline has clear correlation to the reducing number of students in the higher education, number of degrees and MA-s from the universities and even falling numbers of pupils graduating from secondary schools.
The index of enterprises with R&D+I companies and investments was 86.1% of the EU average level in Hungary for 2015. After the drop in 2012, the index slowly, but constantly risen. In 2014 it had a substantial gain (almost 16%), however, the 2008 level remained the highest. Hungary is in the lower deciles with these values. The index represents those expenses paid by the business sector for R&D and the ratio of non-R&D innovation expenses compare to turnover generated. It clearly shows that this index could be improved only via change of ratios in financing.
From an overall point of view, the parameters measuring the innovators had a 60.66% level for Hungary compare to the EU average. This index had its highest level in 2013, in spite of this, Hungary was still in the group of the lowest 10 performers.
The Finance and subsidies dimension’s indicators declined in 2015, they were at 55.58% of the EU average (it is a 4.4% decrease compare to the previous period).
The index had a mixed performance throughout the period, after the lowest point in 2011, it had rose for 2 years, than droped again (to 0.272).
The intellectual properties and non-tangible assets index had maintained its about the EU average level (50.63%) during the entire period.
The research systems index had larger scale of movements amongst the years. In 2015 had its most unfavourable level in Hungary, it was 0.248 below the EU average and it was about 6% decline compare to the previous year (currently at 0.218).
This index has high value in case of typically leader and strong innovators, except Germany (0.443), they were the only one from the top countries with such a low figure.
The Hungarian performance in Connections and businesses category shows the worst result. Since 2012, this index is continously and significantly underperforms, hence influencing Hungary’s overall performance negatively.
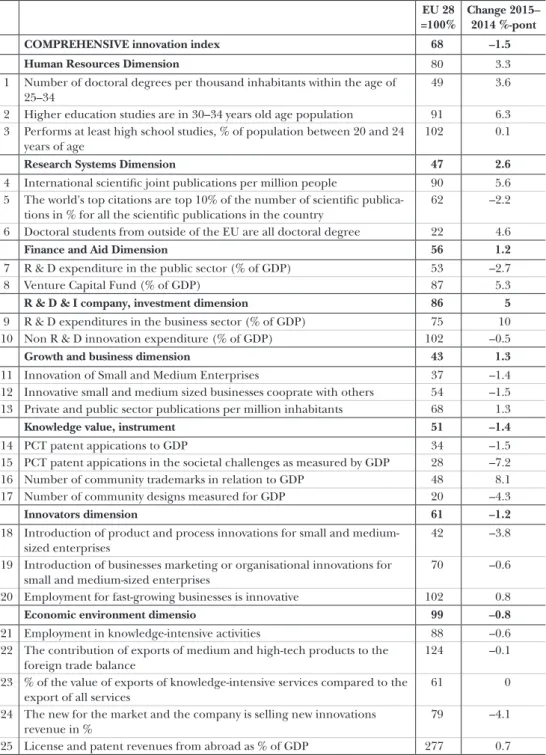
Innovation performance of Hungary on the basis of individual indexes in 2015
In 2015, Hungary had underperformance in all dimensions and indexes relative to the EU average, however, almost at half of the indexes the values were improving com- pare to prior years (see Table 7). From the 25 indexes, in case of 20 it did not reach the EU average level, the other 5 were around or above the average values.
Table 7 indicates clearly that in 2015, Hungary had only one index where it outper- formed the EU average (the licence and patent rights income from outside of Hun- gary in the percentage of the GDP). Compare to 2014, there was a minimal increase, therefore it was not a one-time result.
Furthermore, there are 4 indexes with close EU average values:
1) Middle and high-tech products export participation from the total export;
2) The ratio of completed/graduated from secondary school compare to the total population in the age group of 20-24 years old;
3) Non-R&D innovation expenses (percentage of the GDP);
4) Employment rate in the fast-growing and innovative sectors compare to the total number of employed.
In case of the other 20 index, Hungary is under the statistical EU average.
By assessing the indicators of Hungary, the best performance was made by the Economic environment index, which had an outstanding level at 277. On the other hand, the largest level of drop is in the case of patent registration (7.2%), followed by the sales of new innovation on the market (4.1%) and the small and medium-sized businesses innovation process implementation (3.8%).
The Research systems indexes typical value is very low compare to the EU aver- age, especially in case of non-EU MA graduates level compare to the total number of MA graduates, its value is 22%. Infavorable shortage is also present in case of relations and enterprises dimension due to the innovation level of small and medium-sized enterprises, which is very low (only at 37%) compare to EU average. The index barely exceeded the half of the EU average in 2015.
Table 7: Hungary’s R&D performance by 8 dimensions and 25 indicators as a percentage of the EU average in 2015 and the rate of change between 2014 and 2015 percentage point
EU 28
=100%
Change 2015–
2014 %-pont
COMPREHENSIVE innovation index 68 –1.5
Human Resources Dimension 80 3.3
1 Number of doctoral degrees per thousand inhabitants within the age of 25–34
49 3.6
2 Higher education studies are in 30–34 years old age population 91 6.3 3 Performs at least high school studies, % of population between 20 and 24
years of age
102 0.1
Research Systems Dimension 47 2.6
4 International scientific joint publications per million people 90 5.6 5 The world's top citations are top 10% of the number of scientific publica-
tions in % for all the scientific publications in the country
62 –2.2
6 Doctoral students from outside of the EU are all doctoral degree 22 4.6
Finance and Aid Dimension 56 1.2
7 R & D expenditure in the public sector (% of GDP) 53 –2.7
8 Venture Capital Fund (% of GDP) 87 5.3
R & D & I company, investment dimension 86 5
9 R & D expenditures in the business sector (% of GDP) 75 10
10 Non R & D innovation expenditure (% of GDP) 102 –0.5
Growth and business dimension 43 1.3
11 Innovation of Small and Medium Enterprises 37 –1.4
12 Innovative small and medium sized businesses cooprate with others 54 –1.5 13 Private and public sector publications per million inhabitants 68 1.3
Knowledge value, instrument 51 –1.4
14 PCT patent appications to GDP 34 –1.5
15 PCT patent appications in the societal challenges as measured by GDP 28 –7.2
16 Number of community trademarks in relation to GDP 48 8.1
17 Number of community designs measured for GDP 20 –4.3
Innovators dimension 61 –1.2
18 Introduction of product and process innovations for small and medium- sized enterprises
42 –3.8
19 Introduction of businesses marketing or organisational innovations for small and medium-sized enterprises
70 –0.6
20 Employment for fast-growing businesses is innovative 102 0.8
Economic environment dimensio 99 –0.8
21 Employment in knowledge-intensive activities 88 –0.6
22 The contribution of exports of medium and high-tech products to the foreign trade balance
124 –0.1
23 % of the value of exports of knowledge-intensive services compared to the export of all services
61 0
24 The new for the market and the company is selling new innovations revenue in %
79 –4.1
25 License and patent revenues from abroad as % of GDP 277 0.7 Source: EC, 2016; edited by the State Audit Office of Hungary