Below the EU average participation and employment rates remain the main feature of the Hungarian labor market. The first part of this chapter presents an assessment of the impact of active labor market programs in the period 2001-2006.
Participation, employment, unemployment
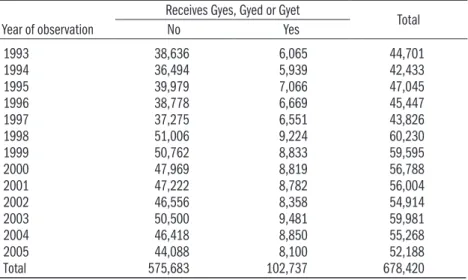
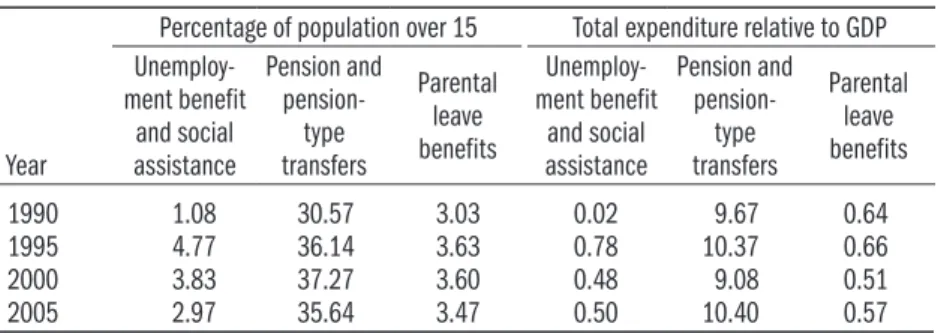
Transfers to childcare in the Hungarian Statistical Office's labor force survey. The Hungarian Statistical Office. The share of the labor market budget in GDP remained approximately one percent. evaluation of active labor market programs.

Labour force participation by different criteria
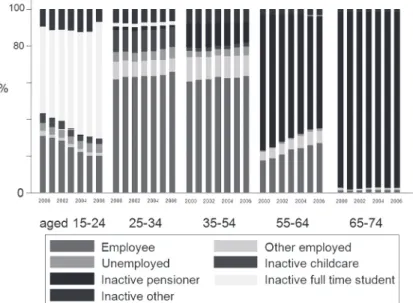
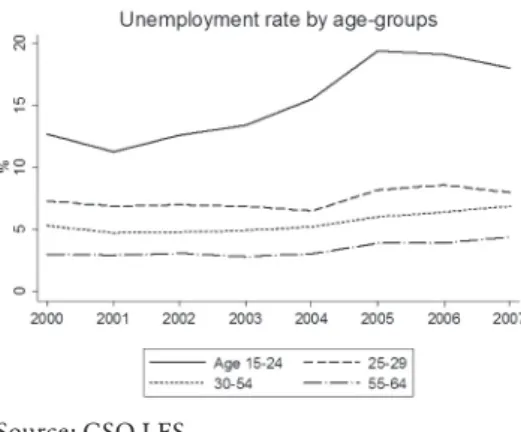
Differences by age group
The unemployment rate of the youngest age groups is strongly influenced by changes in the participation rate among. No significant changes were observed in the unemployment rate of other age groups in 2007.
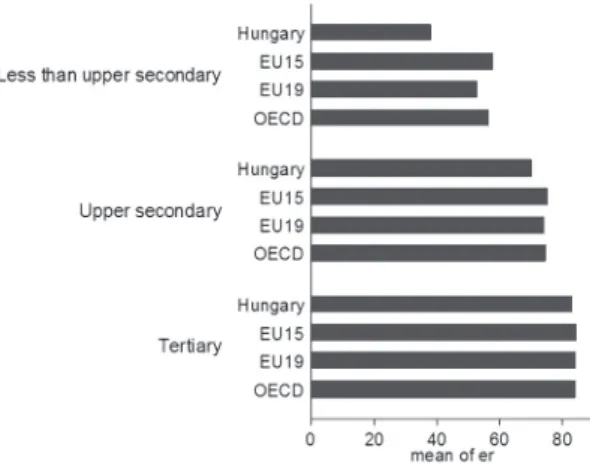
Differences by educational attainment
The activity rate of the Hungarian 15-24 age group lags behind the EU15 and OECD average by 20 percentage points. After 2004 there was a further sharp increase in the unemployment rate of the uneducated, and for those aged 15-29 with less than an upper secondary education, the unemployment rate exceeded 25 percent.
Differences by gender
The unemployment rate among graduates of a young vocational education (szakiskola) and a general secondary school (gimnázium) decreased slightly (by 0.5 and 0.7 percentage points respectively), while the unemployment rate among graduates of a secondary vocational education decreased by 0.2 percentage point has increased. (KSH, 2007b). Until 2004, there was a small increase in unemployment among university and college graduates, but in 2006 the unemployment rate of college graduates fell from 6.3 to 4.9 percent, while the unemployment rate of those with a college education entering college first started a career, increased. further – to about 8 percent.
Sectoral breakdown
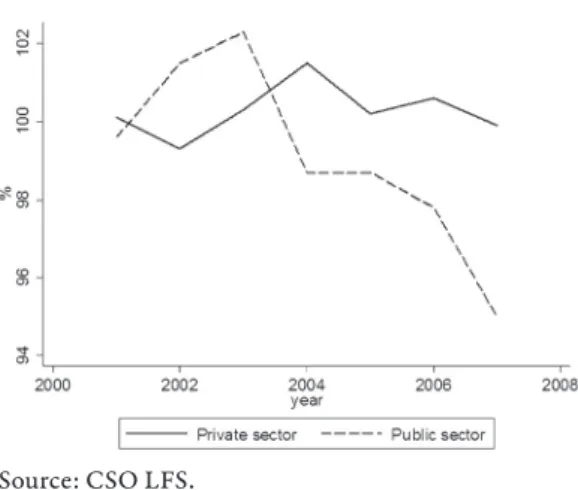
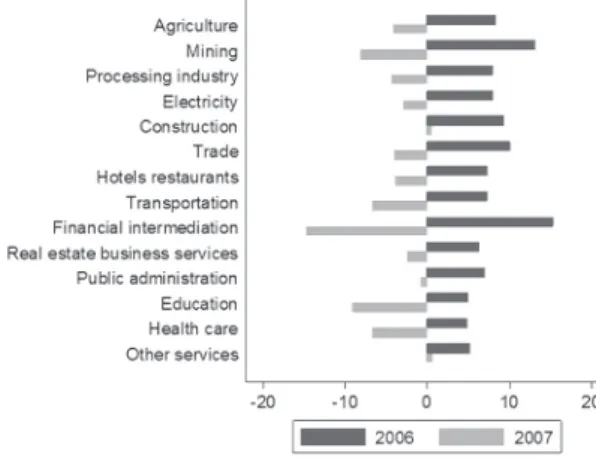
The worsening of women's employment opportunities is related to employment cuts in the public sector. The largest increase in employment occurred in financial intermediation – by 0.7 percentage points while the increase in the real estate business service was by more than 5 percentage points.
Regional differences
In 2007, in central Hungary – the best performer – the unemployment rate fell to 4.7 percent, while in the worst performing region, Northern Hungary, it reached 12.3 percent. Changes in regional disparities show that the strong polarization of the country continued in 2007 and that the government's efforts to even out the disparities have not yet succeeded.
Wages
The Labor Market Fund's decentralized budget did not provide support for job creation.
Social welfare provision, labour supply effects and policy making
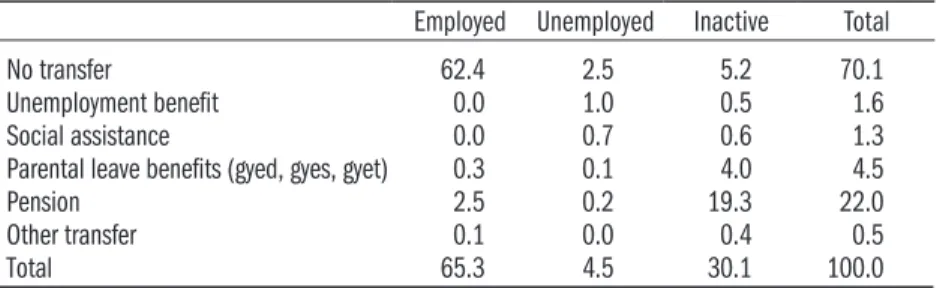
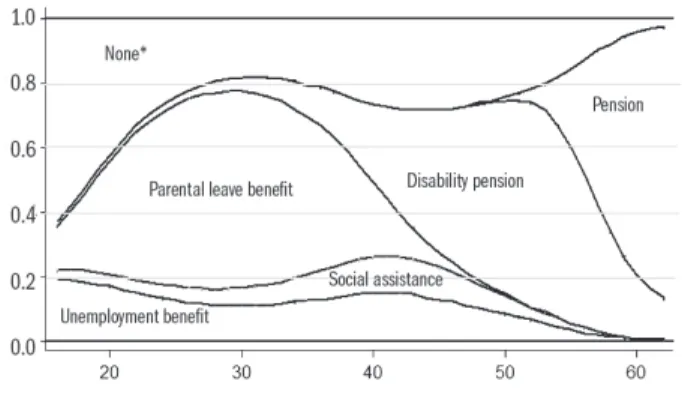
Who is inactive and who receives welfare payments?
The share of job seekers decreases rapidly as people reach the age of 40. The majority of those who receive unemployment benefits but are actually inactive are in this group. Source: Authors' calculations based on data from the CSO Labor Force Survey, weighted by the original CSO weights.
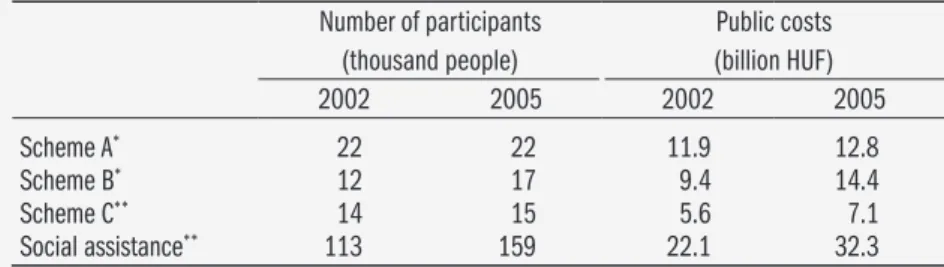
Main welfare programmes
While the clear majority of those leaving unemployed status enter work, almost half of those leaving the social assistance program become inactive without social transfers (none recorded by the LFS). These main welfare programs – with the exception of means-tested social assistance (replacing the previous unemployment assistance scheme from 2000) – are universal or insurance-based – as in the case of unemployment benefits, maternity benefits (Gyed) and pensions.
The effects of welfare programmes on labour supply
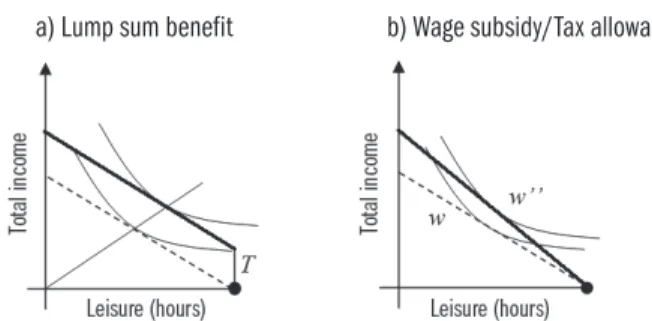
The supply of labor does not necessarily decrease in this case (unless some costs or other income acts as a disincentive), but the level of income obtained from labor may be very low. The above problems, which add up, are not only possible, but actually often observed: an example is uneducated people living in isolated rural communities in disadvantaged geographical regions. In the place where. the worker ceases to be eligible, his/her disposable income suddenly falls, which has the effect of discouraging small increases in labor supply.
The causes of low efficiency in the welfare system and possible
In an attempt to avoid an escalation of political tensions, the Hungarian government during the regime change tried to compensate those on the losing side. Politicians' single-minded focus on increasing gross output is preserved in government practice following the advice of macroeconomists on matters requiring expertise in microeconomics or sociology.
Brief summary of the conclusions of the analysis of labour supply
The labour supply effects of maternity benefits (Mónika Bálint
The effects of family support schemes
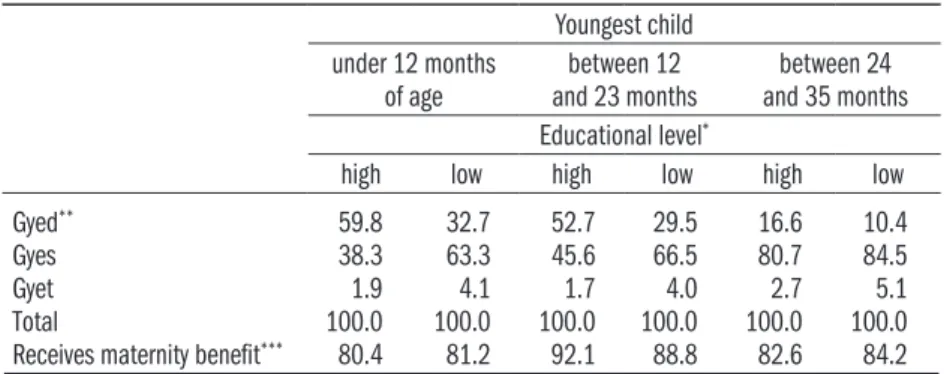
Although there is no unanimous opinion among experts about the "optimal" duration of staying at home with a child (Herczog, 2007), the available data and expert opinions show that there is a positive side effect of the third and fourth years spent at home on development. The analysis presented below is based on labor force survey data from the Hungarian Statistical Office (CSO).
Parental leave benefit as a labour market institution
Recent government administrations have simultaneously tried to ease the tension of the forced choice between employment and staying at home. The period under study is divided into four sub-periods of fundamentally different systems – shown in the last column of the table – which we refer to as regimes.
Childcare transfers in the labour force survey of the
The main indicators of the process of leaving the maternity leave system are summarized in table 2.4. In the absence of the necessary data, our model measures the time period spent among the population at risk by the age of the child.
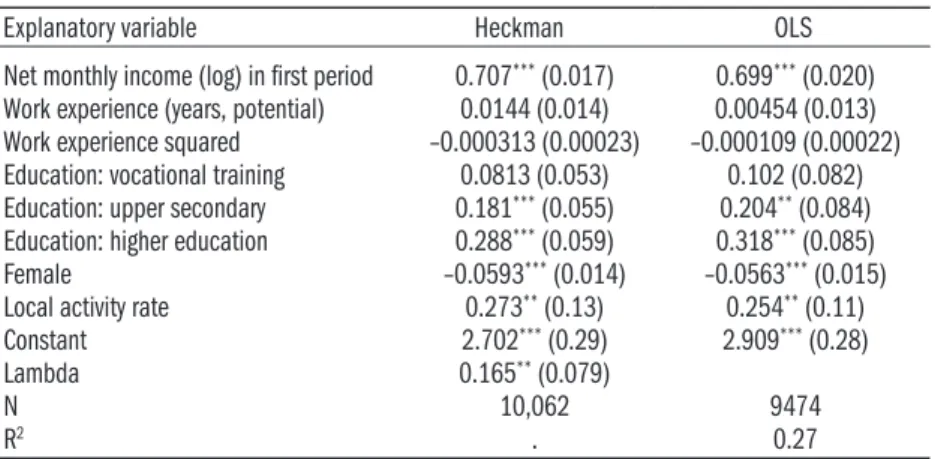
Returning from maternity leave and loss of income
The average exit probability of those who entered the system at the time of the Bokros package was 0.4 percent lower than the chances of those who entered earlier. 26 There is only information about the length of the current spells and not of previous spells.
Conclusions
This section provides an overview of empirical results that shed light on the effects of maternal return to work after childbirth and the effects of day care. In his analysis of the Behavioral Problems Index, Ruhm (2005) finds no long-term negative association between the mother's early return to work and the child's non-cognitive development.
Development of the unemployment assistance programme
The compensation amount is supplemented by an equivalent income of up to 90 percent of the minimum pension rate. One of the goals of the social assistance program is to encourage the return to work.
Labour supply effects of the social assistance programme
Labor supply effects of the social assistance program The effects of the social assistance program on labor supply show a similar. The negative effects of welfare benefits on labor supply are confirmed by analyzes of the labor market effects of the US welfare reform of 1996.
The labour supply effects of social assistance and public works
Public works schemes also had a negative impact on labor supply: among all unemployed men, they reduced the probability of employment in the next quarter by 50 percent, and among all unemployed women by 30 percent. The size of the effect must be interpreted in the context that the average probability of employment in the next quarter is 7.9 percent among men and 6.5 percent among women.

Ways to improve the employment prospects
Assuming that the majority of workers employed in these schemes by local government for long periods consider themselves to be "proper" workers, the above results overestimate the proportion of people who move in and out of the scheme. The 2002 recommendations of the Audit Office regarding the evaluation of program results and the improvement of their efficiency were rejected by the Ministry of Employment on the grounds that "the most important function of public works schemes is to provide employment opportunities as last. resort for unemployed workers who otherwise would not find work.” (ÁSZ, 2002).
A labour market explanation for the rise in disability claims
- Alternative explanations for the increasing trend in disability
- The effect of demographic and labour market factors on
- The relationship between state of health and receipt of
- Alternative approaches to easing labour market tensions
A smaller role is attributed to the quality of health services and the harmful effects of the environment. This chapter presents an assessment of the impact of active labor market programs in the period 2001–2006.

Incentive effects in the pension system of Hungary
Data
Data about people living in the same household can be linked and the details of individual household members can be included in individual attributes. One third of the households in the sample are replaced each year, with the result that (in theory) each household can be followed for three years.
Differences between pensioners and non-pensioners
The results show that the effects of most variables are very similar to those observed previously. A Fuller Assessment of the Retirement Model Our previous models do not detect income effects that may be in- .
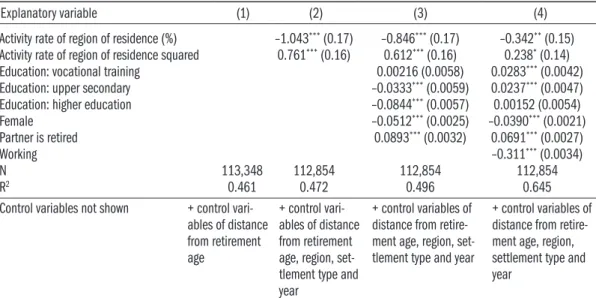
A more complete model estimation of entering retirement
63 The apparent negative effect is due to the fact that the data points are on the increasing part of the function. The results of the analysis indicate that raising the retirement age is an efficient instrument.
Evidence-based social policy: an example of a work incentive
Good governance and evidence based policy making
An effective policy-making process involves regular and systematic evaluation of implementation, identification and dissemination of policy implications, and revisions to existing measures as necessary. Evidence-based policy-making was given a particularly strong emphasis in the British modernization programme.
The British Pathways to Work programme
New clients of the welfare provision are assigned to the same personal adviser for the entire duration of the programme. The evaluations covered each component of the program and various factors that may have influenced outcomes.
Lessons for practices in Hungary
Gábos, András , Gál, Róbert Iván and Kézdi, Gábor (2005) Effects of the pension system and other intergenerational transfers on fertility. Szakolczai György (2005) A rendszerváltás demográfiai hatásai és a rövid távú politikák utódlása Demográfia, Vol.
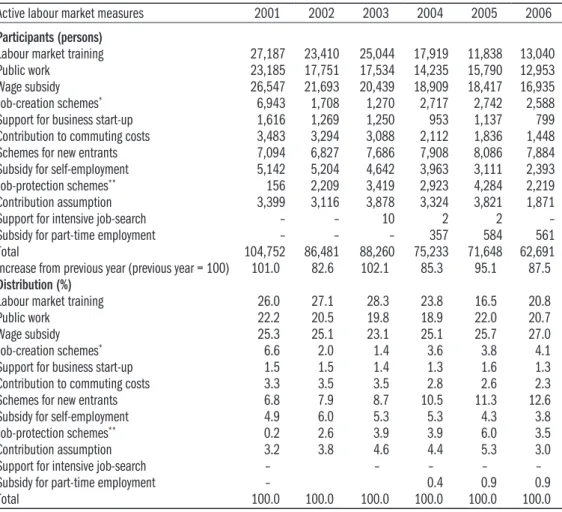
The impact of active labour market programmes (ALMPs),
- Trends in ALMPs spending
- Changes in the total and average number of participants
- Evaluation of main active labour market schemes
- Other labour market measures
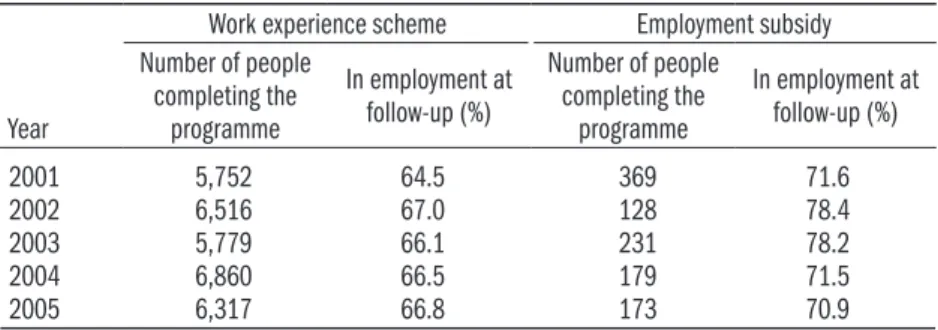
The number of beneficiaries of active labor market measures divided by the sum of the same number and the number of registered unemployed. The share of the average and total number of beneficiaries of this scheme within the total is minimal: it was 3 percent in 2001 and fell to 2 percent in 2006.

Changes in labour market policies and institutions after 2007
- Reform of the system of employment promotion
- Regionalisation of the public employment service
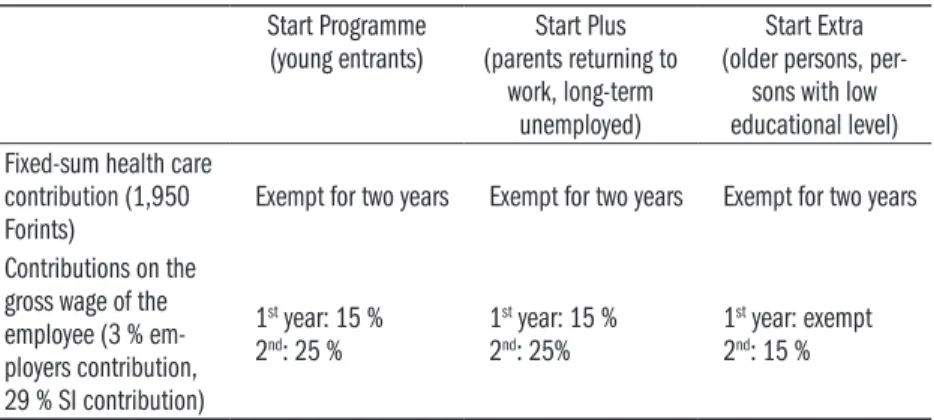
- Reduction of compulsory contributions to promote the
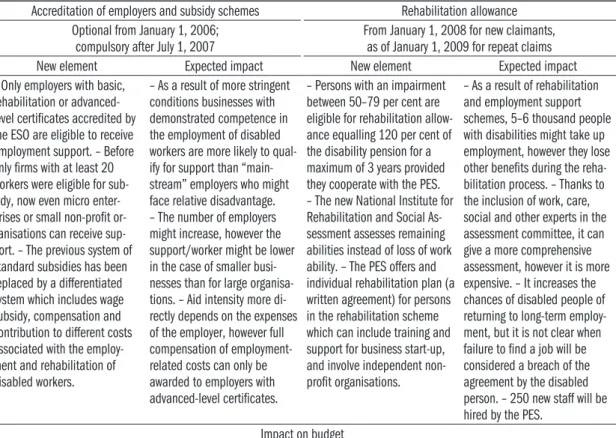
- Introduction of a new rehabilitation system
Employers7 who hire disadvantaged workers from any of the categories defined in the community regulation are eligible for employment support. The annual increase of the rehabilitation allowance is identical to the increase of the old-age pension.
Conclusion
National Institute for Rehabilitation and Social Evaluation On the basis of the National Institute for Medical Evaluation, the National Institute for Rehabilitation and Social Evaluation was established in July 2007. Its duties include assessing the extent of disability, occupational capacity, suitability for rehabilitation, and possible directions and duration of rehabilitation.
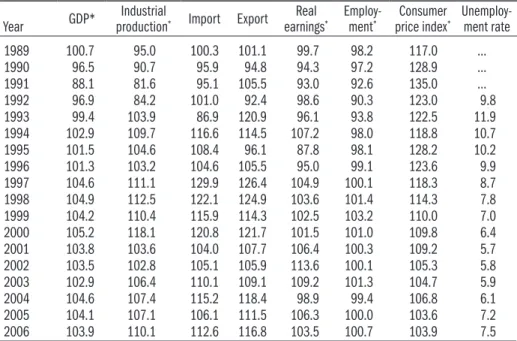
Basic economic indicators
Population
Note: The denominator of the registered unemployment rate is the economically active population on January 1 of the previous year, which comes from KSH MEM.

Labour market status
Employment
Unemployment
Wages
Education
Labour demand indicators
Regional inequalities
Migration
Industrial relations
Social welfare
International comparison
Description of the main data sources