40 50 60 70 80
Percent
1992 1995 1998 2001 2004 2007 2010 2013 2016
Men Women
2 4 6 8 10
Percent
1992 1995 1998 2001 2004 2007 2010 2013 2016
Men Women
20 30 40 50
Percent
1992 1995 1998 2001 2004 2007 2010 2013 2016
Men Women
4 6 8 10 12 14
Percent
1992 1995 1998 2001 2004 2007 2010 2013 2016
Men Women
2 WOMEN IN THE HUNGARIAN LABOUR MARKET – TRENDS IN THE PAST TEN YEARS
2.1 LABOUR FORCE PARTICIPATION, EMPLOYMENT, UNEMPLOYMENT AND WAGES
János Köllő
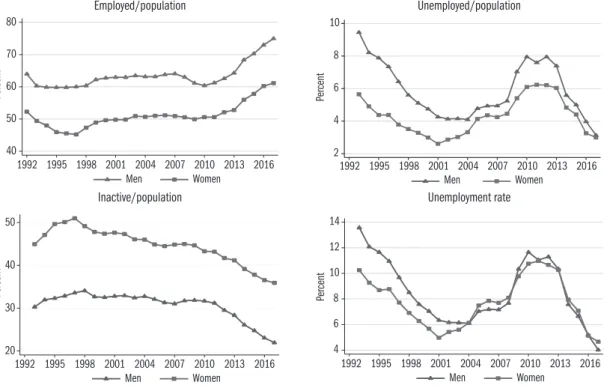
The key time series of male and female labour market participation are pre- sented in Figure 2.1.1, using data and definitions from the Labour Force Sur- vey (LFS) of the Hungarian Central Statistical Office (CSO). The two top panels and the bottom left panel of the Figure show the share of those in employment, unemployment and inactivity in the population aged 15–64, while the bottom right panel shows the evolution of the unemployment rate (i.e. the share of the unemployed in the labour force).
Figure 2.1.1: Selected indicators of employment, unemployment and inactivity in the population aged 15–64, 1992–2016 (percentage)
Employed/population Unemployed/population
Inactive/population Unemployment rate
Note: The categories reflect the CSO classification.
Employed: a person who undertook at least an hour of gainful work during the week prior to the survey, or was temporarily away from their job.
Unemployed: a person who has no job but searched for a job actively during the month prior to the survey and would be able to start a job if he/she found one.
Inactive: neither employed, nor unemployed
Unemployment rate: unemployed/(employed + unemployed)
The points marked on the curves indicate the unweighted average of the four quar- terly observations in the year concerned. The data on employed persons include public works participants and those working abroad.
Source: LFS.
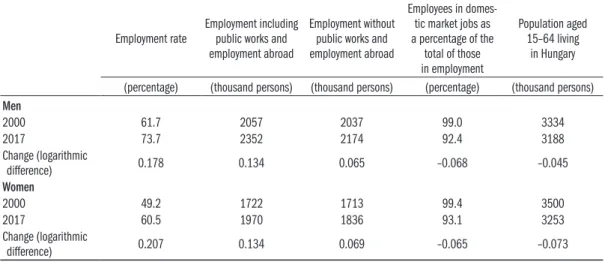
After the transformational recession, the employment to population ratio fol- lowed an upward trend, which was interrupted by the global financial and economic crisis, especially in the case of men, who worked in the private sec- tor in a higher proportion, including some industries highly affected by the crisis (for example the motor industry, construction, and transportation). By 2013 the employment rate of both genders had returned to the original trend, then started to grow rapidly, although this was largely due to the expansion of the public works scheme, increase in employment abroad and the shrinking working-age population of Hungary (i.e. the population in the denominator of the employment ratio). The long-term impact of these elements between 2000 and 2017 is presented in Table 2.1.1.
Table 2.1.1: The contribution of public works, employment abroad and population decline to the increase in the employment rate between 2000 and the first quarter of 2017
Employment rate Employment including public works and employment abroad
Employment without public works and employment abroad
Employees in domes- tic market jobs as a percentage of the
total of those in employment
Population aged 15–64 living
in Hungary (percentage) (thousand persons) (thousand persons) (percentage) (thousand persons) Men
2000 61.7 2057 2037 99.0 3334
2017 73.7 2352 2174 92.4 3188
Change (logarithmic
difference) 0.178 0.134 0.065 –0.068 –0.045
Women
2000 49.2 1722 1713 99.4 3500
2017 60.5 1970 1836 93.1 3253
Change (logarithmic
difference) 0.207 0.134 0.069 –0.065 –0.073
Source: LFS, 2000 and 2017 Q1.
Employment rate (e) is the ratio of employed persons (E) to the working-age population (P) (e = E/P). Part (1 – a) of employment represents market jobs in Hungary, while part a represents public works and employment abroad.
Hungarian, ‘market-based’ employment, excluding public works participa- tion or working abroad is: Ek = (1 – a)E. Relying on the definitions above, the employment rate is expressed as formula (1) in a reference period (0 in super- script) and in the period considered (1 in superscript). In this calculation the reference period is the first quarter of 2000 (data on public works and em- ployment abroad have been available since then), while the period considered
is the first quarter of 2017. Equation (2), based on the definitions, quantifies the contribution of the changes (measured on a logarithmic scale) that took place in Hungarian, market-based employment, the joint importance of pub- lic works and employment abroad as well as population size.
1
Ek
E1
P1 P1
e1 – E0
P0 – –
= = /(1–a1) and e0 = Ek0 P0 –
= /(1–a0) (1)
Δlne = ΔlnEk – Δln(1 – a) – ΔlnP (2)
It is apparent that the three components have been contributing roughly equally to the growing employment rate since the millennium. It is only the contribution of population decline (aging out of the working age population) which is different for men and women.
As for Figure 2.1.1, the top right panel reveals that at the low point of the transformational recession 8–10 per cent of working-age men were unem- ployed. This percentage was considerably lower, 4–6 per cent, in the case of women. The difference decreased steadily except for the years of the 2008–
2010 crisis and has by now essentially disappeared: the unemployment to population ratio was 3 per cent in 2017 for both genders.
The share of inactive people grew in both genders until the late 90s: at that time one third of working-age men and one half of working-age women nei- ther worked nor looked for a job. The gradual increase of the retirement age, regulations restricting disability retirement and those supporting employment during parental leave and motivating the registered unemployed to search for a job significantly reduced inactivity among men and women, although somewhat more in the case of men. In 2017, less than a quarter of working- age men and slightly more than a third of women was inactive according to CSO surveys (Figure 2.1.1, bottom left panel).
It must be noted that these surveys regard full time pupils and college or university students as inactive. In the first quarter of 2017, 46 per cent of in- active working-age men and 28 per cent of women were in fact in education.
The percentage of men not in education, employment and not searching for a job was ‘only’ 14, while that of women was 28 percent (23 percent if women on parental leave are excluded).
The bottom right panel of Figure 2.1.1 shows the evolution of the unem- ployment rate, the most often used labour market indicator. The rate (u) shows the proportion of the unemployed as a percentage of the labour force, which consists of those in employment (E) and the unemployed (U), that is u = U/
(E + U). This indicator has shown no significant difference for men and wom- en since 2004. Compared to the males, the female unemployment rate is re- duced by the lower number of unemployed among women and it is increased by the lower number of women in work. The equality of the rates hides major inequalities between their components.
38 3940 4142 4344 45 4647 48
Hours
1995 2000 2005 2010 2015
Men Women
0 10 20 30 40 50 60
Percent
1995 2000 2005 2010 2015
Women aged 15–64 Mothers with child aged less than 3
01 23 45 67 89 10
Percent
2005 2010 2015
Men Women
20 25 30 35
Percent
2005 2010 2015
Men Women
0 12 34 5 67 89 10
Percent
2000 2005 2010 2015
Men Women
20 25 30 35 40 45 50 55 60
Percent
1995 2000 2005 2010 2015
Men Women
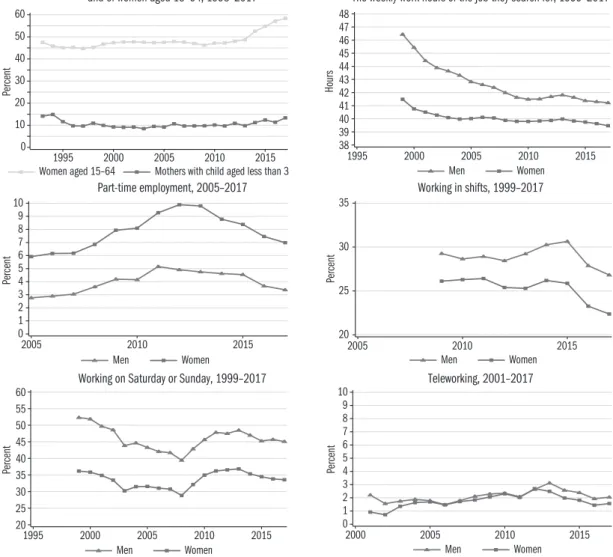
Figure 2.1.2 highlights some of the characteristics of female employment.
It is well-known and also analysed in the later chapters of In Focus that an ex- tremely low share of mothers with young children are in employment by in- ternational comparison. The employment rate of mothers with a child aged less than three years has been around 10 per cent since the mid-90s and has hardly increased as a result of regulations permitting employment when on parental leave.
Figure 2.1.2: Some characteristics of male and female employment The employment rate of mothers with young children
and of women aged 15–64, 1993–2017 The weekly work hours of the job they search for, 1999–2017
Part-time employment, 2005–2017 Working in shifts, 1999–2017
Working on Saturday or Sunday, 1999–2017 Teleworking, 2001–2017
Note: A mother with a young child is someone who has at least one child aged less than three years. Working on Saturday or Sunday: at least occasionally. The periods considered are limited by the availability of data.
Source: LFS.
70 75 80 85 90 95 100 105
Percent
1986 1989 1992 1995 1998 2001 2004 2007 2010 2013 2016
Raw Controlled
The large majority of women search for full-time jobs: they seek jobs with working hours of nearly 40 hours a week on average and this lags only one and a half hours behind the average time for men. In spite of this, the share of women employed part-time is double the share of men (7 and 3.2 per cent in 2017 respectively). It indicates the additional constraints on female employ- ment that a much smaller proportion of women work shifts (26 versus 36 per cent in 2017 respectively) or at weekends (34 versus 45 per cent at least occa- sionally in 2017 respectively). Despite the difficulties of working long hours away from home, the share of those teleworking still does not exceed 2 per cent and it is slightly lower among women than among men.
Remarkably, in the 15–25-year periods concerned, differences between the genders or differences between women with and without young children changed very little. Only the number of work hours of jobs sought by men and women has converged – in other cases the curves are parallel.
Changes in the gender wage gap are presented in Figure 2.1.3, using Wage Survey data from the period between 1986 and 2016. In 1986, women earned less than 75 per cent of the average wages of men. The raw difference continu- ously decreased until 2001, and especially in the period 2002–2004. Then the disadvantage of women started to increase and stabilized at a level of about 15 per cent after 2007.
Figure 2.1.3: The wages of women compared to those of men, 1986–2016 (percentage)
Wages: gross monthly wages in May, plus 1/12 of the non-recurring income of the previous year, minus the non-recurring income received in May.
Raw: earnings of women, taking men’s earnings as 100.
Controlled: Earnings of women compared to those of men, with identical labour mar- ket experience, educational attainment and sector.
The difference was calculated by a regression equation with the dependent variable being the logarithm of wages, while the independent variables are gender, labour market experience and its square, the estimated number of years spent in education and a binary variable representing the private sector. Instead of the parameter b for genders, figures are given in percentage term (eb). All parameters are significant at the 0.01 level, the confidence intervals are so narrow that they would not be visible in the graph.
Source: Wage Surveys, 1986, 1989, 1992, 1994–2016.
10 20 30 40 50
Percent
1986 1989 1992 1995 1998 2001 2004 2007 2010 2013 2016
Men Women
–0.4 –0.3 –0.2 –0.1 0
Logarithmic point
1986 1989 1992 1995 1998 2001 2004 2007 2010 2013 2016
–0.3 –0.25 –0.2 –0.15 –0.1 –0.05 0
Logarithmic point
1986 1989 1992 1995 1998 2001 2004 2007 2010 2013 2016 Businesses with 20 employees or more
Businesses with 10 employees or more Businesses with 5 employees or more
Businesses with 5 employees or more, controlled for work hours
–0.3 –0.25 –0.2 –0.15 –0.1 –0.05 0
Logarithmic point
1986 1989 1992 1995 1998 2001 2004 2007 2010 2013 2016 Teljes közszféra
Közmunkások nélkül
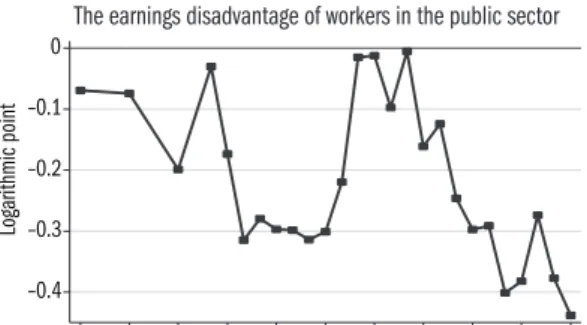
The ‘controlled’ curve of the Figure presents the estimated earnings disadvan- tage of women when labour market experience, educational attainment and sector (private vs public) are controlled for. As for the method of calculation, see the Notes to Figure 2.1.3. The difference calculated in this way decreased until 2001 and then stabilised at 10 percentage points. To understand this unique dynamic and the difference between the raw values and those con- trolled for basic characteristics, one should consider the wage differences be- tween the public and private sector and the gender gap within sectors. Chang- es in the gender wage gap are highly influenced by the facts that a) the public sector plays a more significant role in female than in male employment, b) the wage level of the public sector has fluctuated excessively in the past thirty years, c) the earnings disadvantage of women was different within the pub- lic and the private sectors after 1992 and changed differently over time. The temporal variations in these factors are presented in Figure 2.1.4.
Figure 2.1.4: The importance of the public sector in female employment and wages, 1986–2016 The share of the public sector in male and female employment The earnings disadvantage of workers in the public sector
The survey includes workers of state budgetary institutions prior to 1992 and public servants, civil servants, judges, prosecutors and public works participants after 1992 in the category of public sector employees.
Sample: public sector and enterprises with 20 employees or more. The curve shows the earnings disadvantage of workers in the public sector compared to the private sector, comparing employees of the same age and educational attainment, given in logarithmic scale.
The earnings disadvantage of women in the private sector The earnings disadvantage of women in the public sector
Note: The curves show the earnings disadvantage of women, comparing employees of the same age and educational attainment, given in logarithmic scale, in the rel- evant populations.
Source: Wage Surveys, 1986, 1989, 1992, 1994–2016.
The top left panel of the Figure shows that the share of the public sector in female employment is much larger than in male employment and it increased over time almost continuously, from below 40 per cent to nearly 50 per cent.
Its share in male employment fell from 30 per cent before the political change- over to below 12 per cent, and at present (in spite of a continuous increase after 1992) only slightly exceeds 20 per cent.
This disparity would not weigh much if the wage level of the public sector had not fluctuated so excessively compared to the private sector in the past thirty years. As shown in the top right panel, the earnings disadvantage of public sector workers, which was roughly 10 per cent before the fall of state socialism, increased to 30 per cent. As a result of increases in the minimum wage in 2001–2002 and increases in the salary of civil servants and public employees before and after the general elections in 2002, it fell to only 1–2 per cent; however, after continuous deterioration, it has now exceeded 40 per cent. This fluctuation, has necessarily affected the earnings position of an av- erage woman compared to an average man.
The situation is further complicated by the fact that the earnings disadvan- tage of women has always been different within the two main sectors of the economy. The graphs in the bottom left panel indicate that the earnings dis- advantage of women in the private sector (controlled for age and education- al attainment) fell from nearly 30 per cent to 15 per cent since the start of the transition; however, their situation did not improve afterwards and even worsened after the millennium.
The extent of the disadvantage depends on the types of businesses assessed.
The Wage Survey only covered firms with 20 or more employees until 1995.
The size limit was lowered to 10 persons in that year and to 5 employees in 2000. The gender gap in the hours worked also took on more importance af- ter the millennium. Its impact has been measured since 1999. Apparently, the disadvantage of women is the greatest at medium-sized and large enterpris- es with at least 20 employees, currently about 17 per cent, while in the total population of businesses with more than 5 employees it is only 12 per cent even when controlled for work hours.
While in the private sector the wage gap between men and women of the same age and educational attainment was in the range of 10–15 per cent af- ter the millennium, in the public sector it has continuously decreased since 1986 (with occasional slowdowns) and has by now completely disappeared – as long as employment in public works is considered part of the public sec- tor (bottom right panel). Luckily, public works participants have been iden- tified in the Wage Survey since 2011. If including market-based jobs only, the disadvantage of women still amounts to 6–7 per cent, which is substantially lower than the initial value and about half of that in the private sector, nev- ertheless not zero.
1986 1989 1992
1994 1995
1996 19981997 200020011999
2002
2003 2004 2005
2006
2007 2008
2010 2009 2011 2012
2013
2014
2016 2015
–0.3 –0.25 –0.2 –0.15 –0.1
Gender wage gap
–0.4 –0.3 –0.2 –0.1 0
Public sector wage gap
Observed Estimated
Figure 2.1.5 presents the impact of wage fluctuations in the public sector on the situation of women. The horizontal axis of the Figure shows by how much a public sector employee earned less than a private sector employee with equal gender, labour market experience and educational attainment. The ver- tical axis indicates the ‘general’ earnings disadvantage of women compared to men, irrespective of sector, holding labour market experience and educa- tional attainment constant.
Figure 2.1.5: The earnings disadvantage of women (both sectors) and of public sector employees (both genders), 1986–2016, logarithmic point
Sample: public sector and enterprises with 20 employees or more. The curves show the earnings disadvantage of women and public sector employees, comparing em- ployees of the same age and educational attainment, given in logarithmic scale.
Explanatory variables of the equation for women are: gender, labour market experi- ence and its square, number of years spent in education.
Explanatory variables of the equation for the public sector: public sector, labour mar- ket experience and its square, number of years spent in education.
Regressing the earnings disadvantage of women (W) to earnings disadvantage in the public sector (P) (in 1992–2016) gives: W = 0.23P – 0.12, r2 = 0.77. The standard error of N is 0.03, the t-value is 8.9. The standard deviation of P is 0.131, that of W is 0.043.
Source: Wage Surveys.
If the size of the two sectors and the share and the earnings disadvantage of women within the sectors did not change, there would be a deterministic re- lationship between the relative wage level of the public sector and the general gender wage gap. Since both the share and earnings disadvantage of women changed over the years, the relationship is not function-like but the points are placed on a well-fitting curve after 1992: the situation of women as an employee group improved substantially if the wage level of the public sector increased and it deteriorated in the periods of budgetary cuts.
What is remarkable is not the presence of this trivial relationship but its strength. The slope of the line connecting the points in the period 1992–2016
is 0.23: a unit change in the relative wage level of the public sector results in an approximately one-fourth unit change in the relative wages of women. Taking into account the standard deviation of the two earnings disadvantage indica- tors (see the notes to the Figure), a one standard deviation difference in the earnings disadvantage of the public sector is associated with a 0.7 standard deviation difference in the earnings disadvantage of women.
The budget cuts in the public sector and the fact that the wages of public servants did not follow (sufficiently) the wage growth accelerating after 2013 in the private sector played a key role in the halt of an improvement in the earnings position of women. The earnings position of the average woman was worse in 2016 than in 1992.
As pointed out in one of the studies (Köllő, 2014) of The Hungarian La- bour Market 2014, the excessive fluctuation of the relative wage level of the public sector in Hungary, and the resulting volatility of the gender wage gap, is anything but natural. Such fluctuation of the wage difference between sec- tors was unprecedented in Europe prior to the financial and economic crisis starting in 2008. Even afterwards it was only in Romania that a comparable decrease in disadvantage took place (Vasile, 2012). The difference between the minimum and maximum values of the wage difference did not exceed 6.5 per- centage points between 1993 and 2000 in Europe except Greece and France (Campos–Centeno 2012), while in Hungary it was 18.2 percentage points at that time and 29.5 percentage points in the next eight years. It must be also noted that the wage advantage in Greece increased monotonously in the 12.2 percentage point range, while in France the wage gap varied between –3 and +8 percentage points. Rises and falls comparable to the Hungarian ones – and the extreme earnings disadvantage at the low points – are uncommon in de- veloped market economies.1
References
Campos, M. M.–Centeno, M. (2012): Public-private wage gaps in the period prior to the adoption of the Euro: An application based on longitudinal data. Banco de Por- tugal, WP 1/2012. Lisbon.
Gimpelson, V.–Lukiyanova, A. (2009): Are public sector workers underpaid in Russia?
Estimating the public-private wage gap. IZA discussion papers, No. 3941.
Köllő, J. (2014): What do we know about public sector employment? In: Fazekas, K.–
Neumann, L. (eds.): The Hungarian Labour Market, 2014. Centre for Economic and Regional Studies, Hungarian Academy Of Sciences & National Employment Non- Profit Public Company Ltd, Budapest, pp. 47–54.
Vasile, V. (2012): Continuous flow of public sector reforms in Romania. In: Vaughan- Whitehead, D. (ed.): Adjustments in the Public Sector in Europe: Scope, Effects and Policy Issues, ILO, Geneva.
1 At the same time, Gimpel- son–Lukiyanova (2009) re- ports a comparable earnings disadvantage (26–28 percent- age points according to their regression estimation) in the Russian public sector in the early 2000s.