1 YOUNG PEOPLE IN THE LABOUR MARKET AND IN EDUCATION – CHANGES BETWEEN 2002 AND 2018
Márton Csillag, Ágota Scharle, Tamás Molnár
& Endre Tóth
The educational attainment and labour opportunities of young people deserve significant attention for several reasons. First, the characteristics of the young generations predict future changes in the size, composition and quality of la- bour supply, which in turn affects economic growth. Their educational and career choices could support the adaptation of labour supply to the changing demands of employers. Second, school-leavers have less information and ex- perience than older employees and require more support in finding a job. The EU’s Youth Guarantee Programme requires (and finances) Member States to ensure this support (EU Council, 2013). The appropriate design of these ser- vices also requires thorough analysis. Finally, it is a well-established fact in the international literature that long-term unemployment experienced shortly after leaving school can lead to permanent losses in terms of employment op- portunities and wages (e.g. Bell–Blanchflower, 2011, Burgess et al, 2003). In Hungary, in addition to the 2008 financial crisis and the subsequent increase in migration, public education and vocational training underwent a number of reforms after 2010: this makes the analysis of young people’s labour mar- ket opportunities particularly important.
Labour market trends in international comparison
Recent trends in the employment and unemployment of young people have been more or less favourable, whilst indicators of educational attainment have somewhat worsened, particularly in comparison to the European Union.1 The employment rate of 15–29 year-olds significantly decreased during the crisis of 2008–2011: way below the EU average, it was the lowest among the Viseg- rád Group countries (Figure 1.1). Due to the fast rate of growth observed in recent years, this gap essentially disappeared by 2016. These tendencies ap- ply to both genders, but in the case of men, both the decrease during the cri- sis and the subsequent increase were more prominent. Some of this may be attributed to supply-side developments, as suggested by the fact that the in- crease after 2012 was faster for 15–29 year olds than among 30–34 year-olds.2
Unemployment followed the development of the economic cycle, i.e. it slow- ly increased before the crisis, soared during the crisis, and declined steadily dur- ing the subsequent recovery. There is little variation in this amongst the Viseg-
1 We compared the Hungarian data to the Visegrád Group countries and the EU aver- age: the international data is assumed to indicate improve- ment that can be attained in theory, and we can evaluate the developments in Hungary compared to these. The calcula- tions described in the chapter are presented in more detail in Csillag et al (2019).
2 The employment rate of men aged 30–34 rose from 85 per- cent to 92 percent between 2012 and 2018, while the em-
30 40 50 60
Slovakia Poland
Hungary Czechia
EU-28
2018 2016 2014 2012 2010 2008 2006 2004
2002 30
35 40 45 50
2018 2016 2014 2012 2010 2008 2006 2004 2002
Note: The employed include public works participants.
Source: Eurostat.
The share of youth not in education, employment, or training (NEET) among men aged 15–29 years developed similarly to unemployment: during the cri- sis, it was above the averages of the European Union and the Visegrád Four, amounting to around 14 percent, while in more recent years it declined rap- idly, even compared to other countries, reaching 7.5 percent by 2018. The effect of the economic cycle was visible in the case of women as well, it was albeit weaker, and the improvement in recent years was also smaller in their case, therefore the NEET-rate stayed high in regional comparison (Mascherini et al, 2017). In 2018, the female NEET rate was 18.6 percent in Hungary, whilst the EU28 average, as well as the Czech or the Polish indicators did not exceed 16.5 percent.
As for participation in full time education, recent trends vary both across the Visegrad countries and in the European Union. In Hungary and Slovakia, the share of youth in full time education followed the development of the eco- nomic cycle: during the recession it was high (around 67–68 percent), then throughout the economic boom it began to decrease. In Hungary it dropped to around 60–61 percent, and in Slovakia it began to increase again only in 2017. In Poland (where employment did not decline during the recession) the share of students was decreasing until 2018, whilst in Czechia and the European Union average, it increased continuously. The Hungarian indicator trailed behind the EU28 average (67 percent) by 7 percent, and also behind the Czech indicator (70 percent) by 10 percent. To summarise, whilst employ- ment and unemployment developed favourably, the decrease in the share of students diverges from the EU trends in an unfavourable way.
Figure 1.1: Employment rate of men and women aged 15–29, 2002–2018
Men Women
Factors shaping young people’s labour market outcomes
The employment rate can increase for various reasons. It is a positive develop- ment if the increase is due to new entrants and young unemployed people find- ing work faster, or if mothers with small children return to the labour market sooner, as this implies that the unemployed or inactive period, which erodes ability to work, has shortened. The role of services assisting in job search is discussed in Chapter 5 of this volume.
The role of demographic trends influencing labour supply cannot be ne- glected either. The decrease of birth rates can increase employment, or if the cohort of youth in their 20ies is more numerous than the cohort of youth in their teens, who are typically less likely to participate in the labour market.
It is less favourable if employment grows because young people drop out of school, and fewer of them study further in secondary and higher educa- tion (see sub-chapter 2.5), as this reduces the human capital of the affected cohorts (and consequently their average productivity), which is expensive to correct in adult education.
Lastly, one should also consider the forms of work that are favoured by the expansion. If employment is growing in stable jobs that support skills develop- ment, that is favourable both for young people’s careers and economic growth.
If the expansion is mainly in casual, temporary jobs, fixed-term contracts or public works, that may be less favourable. This is because if young people spend a long time in a job where there is no opportunity for either career advance- ment or learning, this can result in lower productivity and wages through- out their entire future career – this is discussed in sub-chapters 3.3 and 5.5.
The drastic decrease of employment in the years of the recession deserves special attention, as that may have long lasting consequences for the genera- tions that entered the labour market during the recession. Chapter 4 explores this scarring effect in more detail.
Labour market status by age group
To get one step closer to understanding the observed trends, we examine the development of employment and education by gender and age group (Fig- ures 1.2, 1.3 and 1.4). In order to more accurately assess the improvement of the employment indicator, we calculated the employment rate for the past 15 years using the labour force survey of the Hungarian Central Statistical Of- fice (HCSO), excluding public works participants (as they do not work on the primary labour market),3 as well as those who were in full-time education, and those receiving childcare who did not work. Youth not in employment, education, or training (NEET) were defined as those who were not employed
3 The proportion of youth in public employment is not sig- nificant. 1–1.5 percent of those aged 17–19 work in this form, it
0 20 40 60 80 100
Age 25–29 Age 20–24
Age 17–19 2018 2016 2014 2012 2010 2008 2006 2004
2002 0
10 20 30 40 50 60 70 80
2018 2016 2014 2012 2010 2008 2006 2004 2002
0 20 40 60 80 100
Age 25–29 Age 20–24
Age 17–19 Age 15–16
2018 2016 2014 2012 2010 2008 2006 2004
2002 0
20 40 60 80 100
2018 2016 2014 2012 2010 2008 2006 2004 2002
Source: Own calculations using the Hungarian Labour Force Survey (second quar- ter).
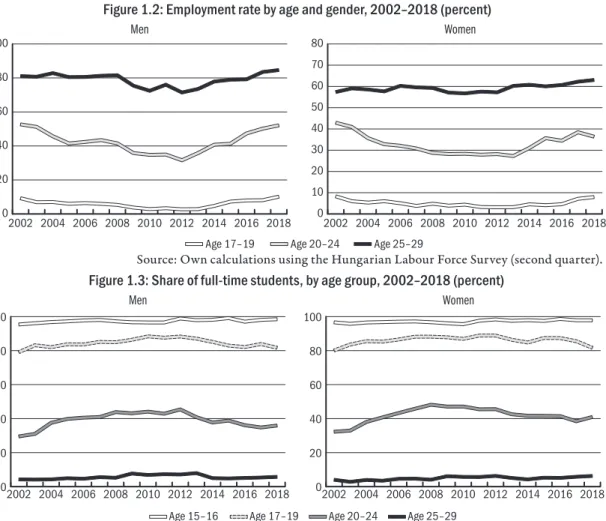
The time series shown by age group in Figures 1.2, 1.3, and 1.4, clearly de- pict the effect of the 2008 recession on the labour market, especially on the employment outcomes of men. During the recession, the employment rate of men aged 20–29 decreased, the share of full-time students stayed intact, while the NEET rate increased. In the following period of growth, the em- ployment rate and the NEET-rate showed a rapid recovery. The indicators for women aged 20–29 developed similarly to those for men, except that dur- ing the recession their employment did not decrease as much. In the case of women aged 25–29 the effects of the recession are less significant on all indi- cators, which may be explained by the improvement of their educational at- tainment or delayed childbearing.
There is also a clear decline, and then a reversal of the prior, fast improvement in the level of schooling, which can be explained in part due to the booming Figure 1.2: Employment rate by age and gender, 2002–2018 (percent)
Men Women
Source: Own calculations using the Hungarian Labour Force Survey (second quarter).
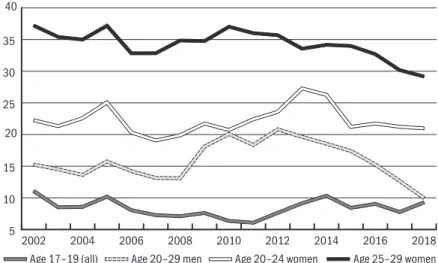
Figure 1.3: Share of full-time students, by age group, 2002–2018 (percent)
Men Women
5 10 15 20 25 30 35 40
Age 25–29 women Age 20–24 women
Age 20–29 men Age 17–19 (all)
2018 2016 2014 2012 2010 2008 2006 2004 2002
demand for labour, and in part due to policy measures (the centralization of education, the lowering of the compulsory school-leaving age, the reform of secondary education, the cut in publicly funded places in higher education).
In recent years, the rate of full-time students decreased in the 17–19 and the 20–24 age groups, most significantly in the case of men aged 20–24, where the indicator dropped 10 percentage points between 2012 and 2017.
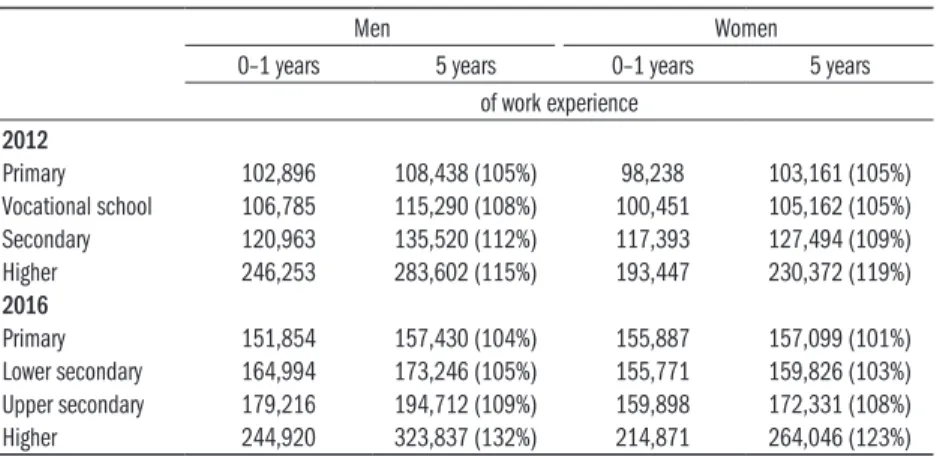
Figure 1.4: Share of youth not in employment, education or training (NEET) by age group and gender, 2002–2018 (percent)
Source: Own calculations using the Hungarian Labour Force Survey (second quar- ter).
The development in the composition of NEET youth also points to the ef- fects of the recession: the share of those young people who have been search- ing for a job for some time as well as those young people who are discouraged4 and inactive decreased by 25 percentage points between 2012 and 2017. In economically disadvantageous regions, however, the rate of long-term unem- ployed and (or) discouraged young people remained high. The reasons for this are discussed in sub-chapters 5.1 and 6.2.
The wage returns of educational attainment and experience
There were some changes in the wage returns of education between 2002 and 2016, but the observed slight decline in returns are not large enough to ex- plain the observed drop in enrolment in tertiary education after 2012. The wage premium of higher education decreased – especially in the case of new entrants – but it remained significant (Table 1.1). The relative wages of grad- uates were influenced by numerous factors in this period, which all pointed
towards the narrowing of the wage premium. First, the previous expansion 4 The categorization follows the method of Eurofound (see also,
elor’s degree. Second, the minimum wage and the guaranteed wage minimum which essentially affects for those with primary and secondary education con- tinued to increase (cf. sub-chapter 5.4). Finally, the removal of the top income tax bracket could also slow down the increase in the average gross wages of graduates.5 The wage returns to experience, however, increased in the case of graduates (especially for men). Chapter 2 and sub-chapter 7.3 examine these developments in detail.
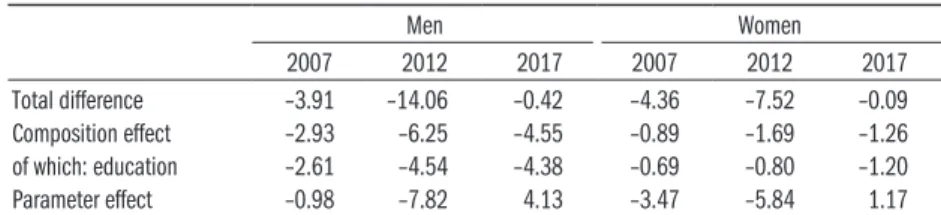
Table 1.1: New entrants’ monthly gross real wages in the business sector, by education, gender and work experience, 2012–2016
Men Women
0–1 years 5 years 0–1 years 5 years of work experience
2012
Primary 102,896 108,438 (105%) 98,238 103,161 (105%) Vocational school 106,785 115,290 (108%) 100,451 105,162 (105%) Secondary 120,963 135,520 (112%) 117,393 127,494 (109%) Higher 246,253 283,602 (115%) 193,447 230,372 (119%) 2016
Primary 151,854 157,430 (104%) 155,887 157,099 (101%) Lower secondary 164,994 173,246 (105%) 155,771 159,826 (103%) Upper secondary 179,216 194,712 (109%) 159,898 172,331 (108%) Higher 244,920 323,837 (132%) 214,871 264,046 (123%)
Note: Percentages show the wage premia compared to new entrants (2016 = 1).
Source: PES Wage survey, own calculations.
Decomposing changes in employment and the NEET rate
The above discussed aggregated changes in the labour market and education indicators are shaped by long-term demographical trends, policy actions and the economic environment as well. The growth of the employment rate and the recently seen significant decrease of the NEET-rate may be explained not only by the economic boom for instance, but also by the (slowing) rise in school participation.
We show the relative importance of these main processes via factor decom- position. We compare the later years to the labour market outcomes of youth recorded in 2002. We examine three pivotal years: 1) 2007, the last year be- fore the recession; 2) 2012, the lowest point of the recession in terms of youth employment; 3) 2017, the last year for which we have data available.
To decompose the main factors, we used the quarterly waves of the Hun- garian Labour Force Survey and we considered five levels of educational at- tainment,6 three age groups, and finally the seven (NUTS2) regions, and we performed the analysis by gender. When analysing employment, we consid- ered those in public works as unemployed (as they do not work in the la- bour market), but did not count them among the NEET youth. We used the
5 Before 2011, personal income tax was a progressive tax (in the top bracket, 32 percent above an annual salary of 5 million HUF), this was replaced by the flat rate tax at 19 percent.
6 The five categories are: pri- mary education, vocational education, general secondary, secondary with vocational edu- cation, higher education.
Oaxaca-Blinder decomposition method, which decomposes the changes (in percentage points) between the given pair of years into two parts. The com- position-effect shows to what extent the difference (across two years) in the population’s composition in terms of age, educational attainment and resi- dence explains the change observed in the NEET- and the employment rate.
The parameter effect captures the effect of all other changes.
Findings are summarised in Tables 1.2 and 1.3, where we present the changes in the NEET rate and the employment rate calculated in percentage points.
We portray, again in percentage points, the contribution of changes in the composition of youth, particularly the changes in the composition of young people’s educational attainment, as well as what can be attributed to other economic factors (this is shown by the parameter effect).
Tables 1.2: Decomposing the employment rate of the population aged 16–29, 2002–2017 (percentage points)
Men Women
2007 2012 2017 2007 2012 2017
Total difference –3.91 –14.06 –0.42 –4.36 –7.52 –0.09 Composition effect –2.93 –6.25 –4.55 –0.89 –1.69 –1.26 of which: education –2.61 –4.54 –4.38 –0.69 –0.80 –1.20 Parameter effect –0.98 –7.82 4.13 –3.47 –5.84 1.17 Source: Own calculations using the Hungarian Labour Force Survey (second quar-
ter).
Table 1.3: Decomposing the NEET-rate of the population aged 15–29, 2002–2017 (percentage points)
Men Women
2007 2012 2017 2007 2012 2017
Total difference –3.32 0.95 –5.78 –5.53 –4.09 –7.47 Composition effect –0.61 –1.03 –1.06 –1.34 –2.88 –2.29 of which: education –0.34 –0.61 –1.04 –1.13 –1.81 –2.22 Parameter effect 2.71 –1.99 –4.72 –4.19 –1.20 –5.18 Source: Own calculations using the Hungarian Labour Force Survey (second quar-
ter).
Changes in employment between 2002 and 2017 were governed primarily by economic processes, while – especially for women – changes in the edu- cational composition of youth also played a minor role.7
In the decrease of the NEET-rate, however, the increase in young women’s average education-levels (which in itself would have decreased the NEET-rate by 2 percentage points) had an important role, which grew over time. At the same time, out of the 7 percentage point decrease in the NEET-rate by 2017, economic and social processes account for more than 5 percentage points,
7 Throughout the observed period, the composition based on education continued to im- prove, albeit slowly, which de- creased the employment rate amongst the youth through increasing the rate of those in further education (whilst it
educational composition only reduced the NEET-rate by around 1 percent- age point. The labour market prospects of the NEET youth are examined in more detail in sub-chapters 5.1. and 5.2.
References
Bell, D.–Blanchflower, D. G. (2011): Young people and the Great Recession. Oxford Review of Economic Policy, Vol. 27, No. 2, pp. 241–267.
Burgess, S.–Propper, C.–Rees, H.–Shearer, A. (2003): The class of 1981: The effect of early career unemployment on subsequent unemployment experiences. Labour Economics, Vol. 10, No. 3, pp. 291–309.
Csillag, M.–Molnár, T.–Scharle, Á.–Tóth, E. (2019): Fiatalok a munkapiacon és az iskolában a 2002 és 2018 közötti időszakban. Kutatási jelentés, Budapest Intézet.
EC Council (2013): Council Recommendation of 22 April 2013 on establishing a Youth Guarantee. OJ, C 120/01.
Hanushek, E. A.–Schwerdt, G.–Ludger Woessmann, L.–Zhang, L. (2017) General Education, Vocational Education, and Labor-Market Outcomes over the Lifecycle.
The Journal of Human Resources, Vol. 52, No. 1, pp. 48–87.
Mascherini, M.–Ledermaier, S. (2016): Exploring the diversity of NEETs. Euro- found, Publications Office of the European Union, Luxembourg.
Mascherini, M.–Ledermaier, S.–Vacas-Soriano, C.–Jacobs, L. (2017) Long-term unemployed youth: Characteristics and policy responses. Eurofound, Publications Office of the European Union, Luxembourg.
Nedelkoska, L.–Quintini, G. (2018) Automation, skills use and training. OECD So- cial, Employment and Migration Working Papers, No. 202, OECD Publishing, Paris.