MŰHELYTANULMÁNYOK DISCUSSION PAPERS
INSTITUTE OF ECONOMICS, CENTRE FOR ECONOMIC AND REGIONAL STUDIES, HUNGARIAN ACADEMY OF SCIENCES - BUDAPEST, 2016
MT-DP – 2016/18
Globalization and the markups of European firms
GÁBOR BÉKÉS - CECÍLIA HORNOK - BALÁZS MURAKÖZY
2
Discussion papers MT-DP – 2016/18
Institute of Economics, Centre for Economic and Regional Studies, Hungarian Academy of Sciences
KTI/IE Discussion Papers are circulated to promote discussion and provoque comments.
Any references to discussion papers should clearly state that the paper is preliminary.
Materials published in this series may subject to further publication.
Globalization and the markups of European firms
Authors:
Gábor Békés senior research fellow Institute of Economics
Centre for Economic and Regional Studies, Hungarian Academy of Sciences CEPR
e-mail: bekes.gabor@krtk.mta.hu Cecília Hornok
Kiel Institute for the World Economy e-mail: cecilia.hornok@gmail.com
Balázs Muraközy senior research fellow Institute of Economics
Centre for Economic and Regional Studies, Hungarian Academy of Sciences e-mail: murakozy.balazs@krtk.mta.hu
June 2016
ISBN 978-615-5594-54-0 ISSN 1785 377X
3
Globalization and the markups of European firms
Gábor Békés - Cecília Hornok - Balázs Muraközy
Abstract
We use a unique cross-section survey of manufacturing firms from four European countries (France, Germany, Italy, Spain) linked with balance sheet data to study the relationship between key aspects of globalization and firm-level markups. The main results are: (i) Exporting is positively correlated with markups; (ii) Importing intermediate inputs and outsourcing are also positively correlated with markups; (iii) Firms with affiliates have higher markups than other firms, while simply membership in a group or being foreign-owned seem to be less important; (iv) Perceived competition from low-cost markets is negatively correlated with markups; (v) Higher quality production and innovation, especially if it results in IP, has a strong positive relationship with markups; (vi) While these variables are correlated, they are significant in a joint model including all four groups, and `fully globalized' firms tend to charge around 100% higher markups than non-globalized firms.
JEL: D22, D24, F14, L11, L60
Keywords: markups, exporting, importing, FDI, innovation
4
Globalizáció és az európai vállalatok haszonkulcsai
Békés Gábor - Hornok Cecília - Muraközy Balázs
Összefoglaló
Egy négy európai országban (Franciaországban, Németországban, Olaszországban és Spanyolországban) lezajlott egyedülálló keresztmetszeti vállalati felmérés és ezekhez kapcsolt mérlegadatok alapján vizsgáljuk a globalizáció egyes fontos aspektusai és a vállalati haszonkulcsok közötti összefüggéseket. A fontosabb eredmények a következők: (i) Az exportálás pozitívan függ össze a haszonkulccsal; (ii) A félkésztermékek importja és a kiszervezés szintén pozitívan korrelál a haszonkulccsal; (iii) Magasabb azon vállalatok haszonkulcsa, amelyeknek van leányvállalata, míg a vállalatcsoportban való tagság vagy a külföldi tulajdonos önmagában kevésbé tűnik fontosnak; (iv) Az alacsony termelési költségű országokból származó versenytársak jelenléte negatívan korrelál a haszonkulccsal; (v) A jobb termékminőség és az innováció, különösen ha szellemi tulajdonjog által védett eredménye van, erős pozitív kapcsolatban áll a haszonkulccsal; (vi) Noha ezek a változók korreláltak, a mind a négy változócsoportot tartalmazó összevont modellben is szignifikánsak, és a teljesen globalizált vállalatok átlagosan mintegy 100%-kal magasabb haszonkulccsal működnek, mint a nem globalizált vállalatok.
JEL: D22, D24, F14, L11, L60
Tárgyszavak: haszonkulcs, export, import, FDI, innováció
Globalization and the markups of European firms ∗
G´ abor B´ ek´ es
†Cec´ılia Hornok
‡Bal´ azs Murak¨ ozy
§July 18, 2016
Abstract
We use a unique cross-section survey of manufacturing firms from four European countries (France, Germany, Italy, Spain) linked with balance sheet data to study the relationship between key aspects of globalization and firm-level markups. The main results are: (i) Exporting is positively correlated with markups; (ii) Importing inter- mediate inputs and outsourcing are also positively correlated with markups; (iii) Firms with affiliates have higher markups than other firms, while simply membership in a group or being foreign-owned seems to be less important; (iv) Perceived competition from low-cost markets is negatively correlated with markups; (v) Higher quality pro- duction and innovation, especially if it results in IP, has a strong positive relationship with markups; (vi) While these variables are correlated, they are significant in a joint model including all four groups, and ‘fully globalized’ firms tend to charge around 100%
higher markups than non-globalized firms.
Keywords: markups, exporting, importing, FDI, innovation JEL codes: D22, D24, F14, L11, L60
∗We thank the Firms, Strategy and Performance Momentum Grant of the Hungarian Academy of Sciences for its support. We thank Kinga Ritter for excellent research assistance.
†Centre for Economic and Regional Studies of the Hungarian Academy of Sciences, Institute of Economics (MTA KRTK KTI) and C.E.P.R..
‡Kiel Institute for the World Economy.
§Centre for Economic and Regional Studies of the Hungarian Academy of Sciences, Institute of Economics (MTA KRTK KTI). Corresponding author: murakozy.balazs@krtk.mta.hu
1 Introduction
Globalization can affect markups through multiple channels. Increased global competition can lead to a fall in markups, exit of domestic firms and increased welfare (Feenstra and We- instein, 2010). But globalization may also create opportunities to achieve scale by exporting (De Loecker and Warzynski, 2012), importing cheaper or higher quality intermediate inputs (Goldberg et al., 2008) or provide stronger incentives for innovation and product differen- tiation. While the relationship between markups and a number of these factors has been quantified, few attempts have been made to study their role jointly and systematically. The aim of this paper is to present stylized facts about the relative importance and magnitude of the correlations between the various dimensions of globalization and markups by linking ex- tensive firm-level survey information from four European countries with markups estimated from a panel of balance sheet data.
Firm-level markups are of interest because of many reasons. First, markups play an im- portant role in determining welfare. Research about how markups are affected by changes in trade costs and market structure is important when designing efficient policies. Second, markups proxy an important dimension of firm performance: if a firm can charge higher markups than its competitors, it is likely to be more productive or capable of producing more desirable goods. In other words, markups are often considered as measures of com- petitiveness. Understanding the relationship between decisions of strategic importance and markups may provide lessons for managers in designing robust strategies in response to globalization. Third, markups provide important information about market structures and competition in an industry. High markups can signal high entry barriers including high sunk costs. Fourth, the level and distribution of markups are informative about the reaction of the industry to different types of shocks. For example, the level and distribution of markups can strongly affect the level of pass-through of different shocks (Burstein and Gopinath, 2014).
Motivated by these questions, a recent literature in international trade has focused on models with variable markups.1 We will apply two key insights from these models. First,
1For example, Krugman (1979) and Melitz and Ottaviano (2008) rely on quadratic utility function, and Feenstra and Weinstein (2010) and Novy (2013) develop models with translog expenditure functions, while Burstein and Gopinath (2014) relies on a nested CES model.
firms facing weaker competition—either because their product has weaker substitutes or because the firm has fewer or less efficient competitors—will have a larger market power and markups. The general prediction of this logic is that product differentiation, either horizontal or vertical, should be positively associated with markups. Second, these models suggest an incomplete pass-through: firms producing with lower costs will pass-through part, but not all, of their cost advantage to consumers. As a result, more productive firms are likely to charge higher markups.
In this paper we focus on five groups of variables measuring different ‘dimensions’ of the global activities of firms. Our dependent variable is the firm-level markup, and we explain it with different measures of internationalization and globalization. These are: (i) Exporting;
(ii) Importing and outsourcing; (iii) Ownership, including whether the firm is a member of a group, foreign-owned or has its own affiliates; (iv) The nationality of the firm’s competitors and (v) Different measures of R&D and innovation inputs and outputs.
While our cross-sectional identification strategy is aimed at finding correlations and can- not say much about causation, we try to isolate the association between globalization vari- ables and markups from that of other confounders, including market structure. To this end, we always identify from within 2-digit industry-country variation. We also attempt to con- trol for market power by including the domestic (revenue) market share and the Herfindahl concentration index at the more disaggregated 4-digit industry-country level. In addition, we include a number of other controls including the number of employees and the age of the firm.
Let us describe briefly the motivation behind each of our globalization variable groups and the main predictions.
Consider exporting first. There are three basic reasons that can motivate the relationship between exporting and markups. First, more productive (or more ‘competitive’) firms may self-select into exporting as in Melitz (2003). Under many demand systems, including the lin- ear demand model of Melitz and Ottaviano (2008), more productive firms will charge higher markups, hence self-selection of more productive firms can in itself imply a markup premium of exporters. Consequently, self-selection into exporting predicts a positive relationship be- tween the two variables. Second, global activities themselves affect markups. For example,
exporting may help generate scale, and a larger potential market may provide stronger in- centives to improve quality (Aw et al., 2000), which, in turn, raises markups. By and large, these arguments also predict a positive relationship between exporting and markups. Third, on a more methodological note, exporting (and especially exporting to multiple markets) can introduce a composition effect into the firm-level markup estimated from the balance sheet data. The firm-level markup is a weighted average of the markups charged by the firm on each of its markets. If firms can charge a lower markup in foreign markets compared to the domestic one (which is indeed the case in a symmetric Melitz-Ottaviano setting)2, then the average markup of an exporter can be lower than that of a similarly competitive firm only serving the domestic market (Murak¨ozy and Hornok, 2015).
Self-selection of more productive or competitive firms can also take place into importing or outsourcing – if these activities also involve a fixed cost. Importing, however, can also have direct benefits in terms of productivity and markups. Access to cheaper inputs leads to cost saving, and—if pass-through is incomplete—this cost saving will yield to increased markups (De Loecker et al., 2016). Globalization may also provide access to high-quality inputs or inputs which are simply a better match to the production process of the firm. If firms are able to produce higher quality output with these high-quality or better matched inputs (Kugler and Verhoogen, 2009, 2012; Atkin et al., 2015; Halpern et al., 2015; Feng et al., 2012, e.g.), markups may rise (Murak¨ozy and Hornok, 2015). Very similar arguments can be applied for outsourced production of inputs.
Another key aspect of globalization is more cross-border investment and the formation of multinational groups. Again, self-selection can play a role, especially given the high cost of FDI (Helpman et al., 2004). Foreign ownership or membership in multinational groups can also have a causal effect on productivity and markups. Foreign acquisitions are often accompanied by knowledge transfers and increased productivity (Arnold and Javorcik, 2009) and markups (Clementi, 2015). Further, multinational groups may create larger potential for knowledge flows and may have larger market power than stand-alone firms. Such patterns
2In a symmetric Melitz-Ottaviano setup, exporters will have to pay transportation cost in the export market, and because of the incomplete pass-through in the Melitz-Ottaviano model, they can charge lower markups in export markets.
would fit nicely to the robust stylized fact that both multinational parents and affiliates tend to be larger, more productive, more R&D-intensive, and more export oriented than non- multinational firms.3 In general, these arguments point to a positive association between foreign ownership, multinational group membership, and markups.
However, it is possible that not all members of multinational groups benefit from group membership to the same extent. One reason for this can be transfer pricing, which will lead to higher observed markups in low-tax destinations. More importantly for our analysis of large European countries, it is possible that the multinational network provides an opportunity for the headquarter to leverage its knowledge assets (Markusen, 2004; Antr`as, 2003). This would generate higher return on the sunk investment into knowledge assets, leading to higher measured markups at the headquarter.
Next, we study how the type of competitors a firm faces affects its markups. In particular we focus on whether the firm reports that it has foreign competitors and whether these competitors are from low-cost, emerging economies. Note that our identification strategy is to compare firms within the same country-industry based on their survey answers about their main competitors. Our hypothesis is that firms which perceive that they are competing with firms from emerging countries are more likely to charge lower markups than firms perceiving no such competition. Naturally, these different perceptions may partly result from either vertical or horizontal differentiation; i.e. these results can be interpreted as comparing firms with products with high versus low level of differentiation from emerging country exports.
Finally, we look at innovation activities and their output. Innovation to improve produc- tion methods and quality seems to be a key variable in globalized economies, and usually co-moves strongly with internationalization (Altomonte et al., 2013). In globalized markets, innovation seems to be one of the key sources of sustained competitive advantage. Produc- ing high quality and strongly differentiated products can be the key determinant of markups in the longer term. Variable markup models naturally predict that firms producing higher quality products tend to charge higher markups (Antoniades, 2015). Naturally, one of the sources of producing higher quality (or more attractive) products is product innovation.
Process innovation, on the other hand, may generate more efficient, lower cost production,
3See Fact Four in Antr`as and Yeaple (2014).
and—under incomplete pass-through—this will also yield higher markups.
Our main findings are: (i) Exporting is positively correlated with markups; (ii) Importing intermediate inputs and outsourcing are also positively correlated with markups; (iii) Firms with affiliates have higher markups than other firms, while simply membership in a group or being foreign-owned seems to be less important; (iv) Perceived competition from low-cost markets is negatively correlated with markups; (v) Higher quality and innovation, especially if it results in IP, has a strong positive relationship with markups; (vi) While these variables are correlated, they are significant in a joint model including all four groups, and ‘fully globalized’ firms tend to charge around 100% higher markups than non-globalized firms.
A key conceptual question concerns the role of productivity in these relationships. As we have already discussed, variable markup models include two broad channels for higher markups: (i) the substitutability of the product and (ii) higher productivity. The relative role of these two mechanisms is certainly of interest because it can shed light on the relative importance of the different channels described in the previous paragraphs. For example, self-selection into exporting is based on productivity, and learning-by-exporting may also take the form of adopting technology generating higher productivity. In other words, these channels work indirectly via productivity. Exporting, however, may also help in learning about product characteristics valued by high-end consumers. Such learning will help in creating a more distinct, less substitutable product. As this channel does not work via productivity, we can say that exporting through this channel has a direct effect on markups.
Ideally, one could distinguish between direct and indirect channels by comparing coef- ficient estimates with and without controlling for physical productivity. We will attempt to do so by controlling for TFP in some specifications. However, our measure of produc- tivity, TFP, is a revenue-based measure, and as such, it includes markups to some extent.
Consequently, controlling for it may condition out part of the direct association between internationalization and markups, biasing our internationalization coefficients towards zero.
Hence, the results after controlling for TFP should be interpreted with care. However, if the coefficients of globalization variables remain significant even in this case, then some evidence is provided for a direct, rather than only an indirect relationship.
In empirical specifications including firm TFP, in addition to indirect relationship via
TFP, we find clear evidence for a direct relationship between the markup and importing and outsourcing, especially from emerging areas, controlling other firms, as well as product quality and IP creation. In contrast, the positive association between exporting and markup seems to be driven entirely by the higher productivity of exporters.
While a few papers have studied the relationship between different dimensions of glob- alization and firm-level markups, our contribution is that we analyse many dimensions of globalization in a symmetric way from a unified dataset. Our dataset, which links rich firm-level survey data with a large panel of balance sheet data is ideal for such an exercise.
By including TFP we also attempt to quantify the degree to which different globalization channels work via productivity. Also, many of the previous studies have analyzed developing countries, which is complemented by our analysis of large developed European countries.
Our approach, however, has a number of limitations. Most importantly, the cross- sectional nature of our globalization variables does preclude us from measuring causal effects.
The patterns we present are cross-sectional partial correlations after controlling for indus- try characteristics and a rich set of firm-level controls. While such controls may condition out country or industry-specific confounders, we are not able to distinguish between self- selection and causal relationships. Second, our methodology generates only one estimate for the markup of each firm. This is a weighted average of the markups charged by the firm in its different geographic and product markets. The data available do not allow us to estimate market-specific markups. Third, as we have already discussed, it would be of much interest to control for physical productivity because it is a key variable in variable markup models.
We can do it only imperfectly by controlling for revenue TFP, which may include markups to some extent. While this makes a proper decomposition into direct and indirect effects elusive, this kind of endogeneity works against finding a direct effect. As a result, significant estimated coefficients when controlling for TFP can be interpreted with care as evidence for the presence of direct effects.
The structure of this paper is as follows. Section 2 discusses the datasets used in this paper and our empirical approach, followed by a sketch of the estimated markups in Section 3. Section 4 presents the results, while Section 5 concludes.
2 Data and measurement
In our study we make use of two firm-level databases, the AMADEUS database of firm balance sheets and profit and loss accounts and the survey-based EFIGE database. We use the former to estimate firm markups and productivity and to calculate market shares and concentration, while we source all the other firm measures from the latter. Then, we merge the two sets of data into our final estimation sample.
2.1 AMADEUS database
AMADEUS (Analyse MAjor Databases from EUropean Sources) is a comprehensive database of European firms, provided commercially by Bureau van Dijk. The complete database cov- ers 21 million companies from all EU countries and several non-EU European countries. It contains a maximum of ten years of detailed information from firms’ balance sheets and profit and loss accounts, together with firm identifiers and industry classification at the 4-digit level.
In this study we use a subset of the AMADEUS database, including French, German, Italian and Spanish firms over the period 2004-2013. In order to estimate productivity and markup we need to use the following firm variables from AMADEUS: number of employees, value of sales, value of fixed assets, cost of employees and material costs as well as the 4-digit industry code. All these variables but the number of employees are reported in thousand euros.
Despite the large number of firms present in the database (roughly 4.5 million for the four countries), the high prevalence of missing values substantially limits data availability, especially in Germany. The panel is also highly unbalanced, which affects particularly the first three years. Against this background, our panel of AMADEUS data includes 8-10 million firm-year observations for roughly 2 million unique firms in the four countries.
We use this database to estimate production functions and calculate firm-level markups and productivity (described in the next section). To capture the market share of individual firms, we also calculate each firm’s share in the total sales at the 4-digit industry-country
level. Hence, the market share of firm iactive in country cand industry j4 in yeart is market shareicjt = salesicjt
P
k in cjsaleskcjt,
We will use this variable as a proxy of the firm’s market power in the regressions explaining the markup.
To capture market structure, we simply calculate the Herfindahl-index of sales at the four-digit industry-country level:
Hcjt = X
k in cj
market share2kcjt.
2.2 Estimating the production function and markups
Based on the AMADEUS panel, we estimate a value-added production function:
yicjt =βl(cj)licjt+βk(cj)kicjt+δcjt+icjt. (1) where yicjt is the log value added of firm i operating in countrycand industry j in year t, kicjt and lit are its capital and labor stock, respectively, whileδcjt is a set of year dummies for country-industry cj.5 We estimate the production function separately for each 3-digit industry-country combination, withβl(cj) andβk(cj)showing the 3-digit-industry-country spe- cific elasticities of the production function. To handle potential endogeneity issues, we estimate the production function following the method of Wooldridge (2009), the details of which are relegated to Appendix A.
We base our markup estimation on the insight of Hall (1986, 1988) and follow De Loecker and Warzynski (2012) in operationalizing this idea. The idea is that, for a cost-minimizing producer, the markup equals the ratio of the output elasticity of a variable input to the input’s revenue share. This follows directly from the cost-minimization assumption and requires no further assumptions on the market structure or the demand system.
4For notational simplicity, we will denote all industry classifications, sometimes 2, 3 or 4-digit withj in this paper but will always state what is the relevant level of aggregation.
5We capture value added as sales minus material costs, labor as the number of employees and capital by fixed assets. We deflate the value added by country- and industry-specific prices and fixed assets by a country-specific price index for capital goods.
At the cost-minimizing optimum, the marginal product of a variable input X equals the ratio of the input price to the marginal cost of the firm, hence M PX = M CPX . Multiplying both sides by the input’s quantity share in production, XQ, we get
θX = PXX M C ·Q,
where θX = M PX · XQ is the input’s output elasticity. Using the definition of the markup as the product price over marginal cost, µ= M CP , and with some manipulation we get the markup formula
µ=θX
PXX P Q
−1
. (2)
Intuitively, under perfect competition, when µ = 1, the output elasticity and the input’s revenue share are equal. With imperfect competition the elasticity is larger than the revenue share and this difference determines the size of the markup.
We measure firm-level markups based on (2) using the labor input of the firm as the variable input. While labor’s revenue share can be calculated from observables, the output elasticity is estimated from the production function (1). Given the estimated output elas- ticities of labor, ˆβl(cj), specific to country-industry cj, we calculate the markups of firm i in year t (belonging to country-industry cj) as
markupicjt = ˆβl(cj)
cost of employeesicjt salesicjt−material costsicjt
−1
,
where the components of labor’s revenue share (cost of employees, sales and material costs) are directly observable from firms’ balance sheets.6
Clearly, all the variation in the markup estimates within country-industry will come from labor’s revenue share.7 The proper measurement of labor’s revenue share is therefore crucial to get reliable markup estimates. Revenue shares that take extreme values naturally result in outlying markups. Hence, in order to clear outliers, we trim the upper and lower 2 percentiles of the distribution of labor’s revenue share (across all firms and years). Although
6Also, as value added includes markup on materials, we correct the markups with the share of materials in total costs, proxied by the parameters of the Cobb-Douglas production function with gross output on the left-hand-side and three inputs.
7The same can be said about the time variation, which we do not use in this study.
this approach reduces the size of our sample, it removes all markups which we consider outliers (negative or higher than 10).
From the estimated production function we also obtain the firm-year-level total factor productivity (TFP) as
ln TFPicjt =yicjt−βˆl(cj)licjt−βˆk(cj)kicjt,
where yicjt, licjt and kicjt are the value added output, labor and capital inputs, respectively, of firm i in year t in logarithm and ˆβk(cj) is the estimated country-industry-specific output elasticity for capital.
As we have already noted, since we do not observe the price of output and capital on the firm level (although we deflate by industry price indices), our TFP measure is a revenue-based TFP. This means that it does not purely reflect physical productivity but also captures variation in firm-level prices and costs (Foster et al., 2008). Thus, some of the markup variation is also present in the TFP variable, which is to be taken into account when we interpret our regression results below.
Our method differs from that of De Loecker and Warzynski (2012) in the important respect that these authors emphasize the importance of correcting the revenue share in the markup formula with the idiosyncratic productivity shock while we omit this correction.
The reason for this omission is that the AMADEUS database involves a large number of missing observations and missing values. Most importantly, for many operating firms we only have a few observations, often from non-consecutive years. This makes it hard to build a credible dynamic model for each firm. While the lack of this correction can introduce some bias into our markup measures, keeping only firms with non-missing values for consecutive years would lead to a large, endogenous loss in the number of observations. Also, this issue may be less important in the cross-sectional analysis we rely on here than in analyses relying more strongly on within-firm variation.
Another difference is that we present results from a production function estimated by the Wooldridge methodology rather then the ACF methodology used by De Loecker and Warzynski (2012). We found this estimator more robust in the case of many missing val- ues. However, we have also estimated markups using (i) a Cobb-Douglas ACF production
function; (ii) a translog ACF production function and (iii) a simple fixed effects production function. Our main results are robust to using these alternative markup measures.
Finally, note that the unit of observation is a firm-year and, hence, the measured markup is a weighted average of the markups charged by the firm in its different product and geo- graphic markets. Estimating markups at a more disaggregated level would require production and price data for the different markets (or strong assumptions).
2.3 EFIGE survey data
EFIGE (European Firms In a Global Economy) is a survey-based database of a sample of European manufacturing firms in seven EU countries (Austria, France, Germany, Hungary, Italy, Spain and the UK).8 In this paper we will rely on data from the four large countries (France, Germany, Italy and Spain), where a suitable number of observations are available for the within-country-industry analysis.
EFIGE is a unique database in that it enables comprehensive cross-country comparison of a very large set of firm measures. The questions in the survey are centered around six broad topics: the structure of the firm, the workforce, investment, innovation and R&D, internationalization, finance, as well as the market and pricing. The survey was carried out once during the period late-2009 to early-2010. Most survey questions refer to the situation either in 2008 or in the survey year. Questions on changes in firm measures (e.g. change in turnover or workforce) mainly concern the change from 2008 to 2009. Questions on more lumpy measures like acquisitions, investment, innovation and R&D refer to the last three years (2007-2009).
Roughly 3,000 firms have answered the questionnaire in each of the four countries we con- sider. The sample over-represents larger firms, because it only includes firms with more than 10 employees. For the population of such firms, however, the sample is made representative by country, sector and three size categories with appropriate sampling weights.9
Based on the EFIGE database we construct several – mostly binary – variables of firm characteristics. Table 1 lists these variables and their descriptions. Here we provide a brief
8For a more detailed description see Altomonte and Aquilante (2012).
9For a detailed description of the weighting see Navaretti et al. (2011, Appendix II).
description of the construction of each variable.
The age of the firm is defined as the number of years passed until 2009 since the year of establishment of the firm. The year of establishment is reported by the firm in the EFIGE survey and is typically different from the date of incorporation given in AMADEUS. Since, by definition, establishment must precede incorporation, we replace the establishment year with the year of incorporation whenever the former is larger than the latter.10
We capture the size of the firm by four size categories in terms of employment, which are based on firms’s answers in the EFIGE survey on whether they fall into the group with 10 to 19, 20 to 49, 50 to 249 or 250 and more employees. We will take the smallest size category as the reference group in our regressions.
Exporters are the firms which answered the question ”Has the firm sold abroad some or all of its own products/services in 2008?” with ”yes, directly from home country.”
Importers of intermediate inputs are firms responding to either of the two questions
”In 2008 has the firm purchased raw materials or any intermediate inputs for its domestic production?” and ”In 2008 has the firm purchased any services for its domestic production (i.e. transport, communication, financial and R&D services)?” with ”yes, from abroad”.
Firms importing from emerging areas are a subset of importers of inputs. These firms report they purchased at least some of their inputs from emerging areas in 2008. The EFIGE survey differentiates among eight geographical areas (EU15, other EU countries, non-EU European countries, China and India, other Asian countries, USA and Canada, Latin America, and other areas). We classify the areas other EU countries, China and India, other Asia, Latin America and other areas as emerging. Firms are classified as international outsourcers if they answered the survey question ”Does the firm currently run at least part of its production activity in another country?” with ”Yes, through contracts and arm’s length agreements with local firms”.
We characterize firm ownership and control with three firm variables. Individual firms may belong to groups, they may control other firms (both in and outside of groups) and they may be under foreign ownership. In the EFIGE survey firms report if they belong to a group and whether the group is national or foreign. From further questions on shareholders
10The results are qualitatively the same if we work only with the year of establishment information.
Table1:ListofbinaryvariablesfromEFIGE VariableDescription#firms Age10yearsorlessfirmaged10orlessyearsin2009754 Sizedummies(referencegroupis10-19employees) Size20-49employeesnumberofemployeesbetween20and492,891 Size50-249employeesnumberofemployeesbetween50and2491,229 Size250+employeesnumberofemployees250orabove482 Internationalization Exportersoldproducts/servicesabroadin20083,915 Importerofinputspurchasedrawmaterials,intermediategoodsorservicesforproductionin20083,025 Importsfromemergingareasimporterofinputs&purchasedfromemergingareasin20081,342 Internationaloutsourcerrunsproductionactivityabroadthroughcontractsandarm’slengthagreements275 Ownershipandcontrol Groupmemberfirmbelongstoagroup(nationalorforeign)1,538 Controllingfirmcontrolsotherfirmsinthegroupornotingroupbuthasaffiliates,FDIoracquiredotherfirms1,828 Foreignownedbelongstoforeigngrouporhasforeigneramongits3mainshareholders677 Competitors Firmhasforeigncompetitorsomeofthefirm’smaincompetitorsarelocatedabroad3,614 Firmhascompetitorinemergingareassomeofthefirm’smaincompetitorsarelocatedinemergingareas1,926 Innovationandproductquality Qualitycertificationhasproductorprocessqualitycertification(e.g.ISO9000)4,046 Innovationactivitycarriedoutproductorprocessinnovationinthelastthreeyears4,508 R&DactivityundertookR&Dactivitiesinthelastthreeyears3,607 IPcreationappliedforpatent,registeredindustrialdesignortrademark,orclaimedcopyrightinthelastthreeyears1,704 Totalnumberoffirms6,830
and past acquisitions we can identify those firms which are owned by foreigners and not part of a group. Based on these information we create two dummy variables, one for group membership and one for foreign ownership. Group members were also asked if they control other firms in the group (either as group heads or not). Based on questions on affiliates, FDI activities and past acquisitions we are also able to identify a comparable amount of non-group firms, which are in controlling position. This allows us to create a dummy for firms in controlling position.
Next, we construct two indicators for the type of the firm’s competitors. In EFIGE, firms report the location of their main competitors. This can be the home country or seven geographical areas abroad (other EU, other non-EU European, China and India, other Asia, USA and Canada, Latin America, other areas). A firm has foreign competitor if it indicated any of the foreign areas as its main competitors’ location. A firm has competitor in emerging areas if it marked at least one area out of China and India, other Asia, Latin America and other areas.
We measure innovation and product quality with four measures (quality certification, innovation, R&D activity, and IP creation). We capture product quality with the presence or absence of a quality certification. Firms were asked if they had gone through any form of quality certification (e.g. ISO9000) before. Our quality certification dummy is one for firms which answered yes to this question and zero otherwise. A set of survey questions con- cerned technological innovation. Firms were asked if they carried out any product or process innovation during 2007-2009.11 On the basis of this question we generate our innovation activity dummy taking value one for firms which reported some product or process innova- tion. Another survey question asked if, on average in 2007-2009, the firm undertook any R&D activities.12 Our R&D activity dummy takes value one for the firms which answered yes to this question. Finally, our IP creation dummy is based on a question that asked if a firm applied for a patent, claimed copyright or registered an industrial design or trademark
11Product or process innovation means the introduction/adoption of a new or significantly improved prod- uct or production technology, respectively, which however should not necessarily be new to the market.
12The EFIGE questionnaire describes R&D activities to the respondee as creative activities aimed at increasing knowledge and using this knowledge in new applications, such as in the development of techno- logically new or improved products and processes.
during 2007-2009. It takes value one for firms which reported any of the above activities.
2.4 The merged database
When creating our estimation sample we start from the EFIGE database and merge it, by using unique firm identifiers, with the markup, TFP and market structure variables estimated from AMADEUS. We construct our estimation sample from firms for which none of the variables which appear in our regressions take missing values. Because there are relatively many missing values for the TFP variable, we construct lagged TFP (a regressor in some of our empirical specifications) as the average of its nonmissing values from years 2006-2008.13
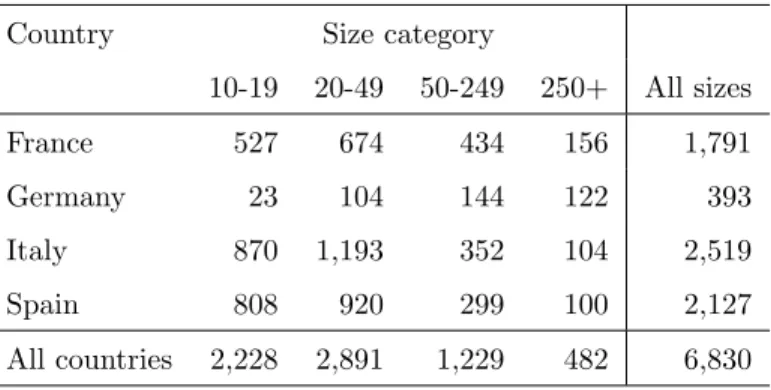
Our estimation sample includes 6,830 firms (Table 2). Most of these firms are from France, Italy or Spain, with 1,800 to 2,500 firms from each country. Note that the original EFIGE sample size for all of these countries was about 3,000, hence we loose between 20-40 percent of the sample during the matching. The situation is much worse in the case of German firms, from which only 393 remained in the sample, due to the insufficient data availability for Germany in the AMADEUS database. The firm size distribution of the German subsample is also skewed toward large firms.
Table 2: Number of firms by country and size
Country Size category
10-19 20-49 50-249 250+ All sizes
France 527 674 434 156 1,791
Germany 23 104 144 122 393
Italy 870 1,193 352 104 2,519
Spain 808 920 299 100 2,127
All countries 2,228 2,891 1,229 482 6,830
As Section 2.3 has already noted, the EFIGE sample was made representative with sampling weights by country, sector, and firm size classes. Importantly, we rescale the
13We do this because the capital input variable, which is needed to obtain TFP, is missing for some our sample firms in 2008 but not in 2006 or 2007. This imputation, however, does not affect our main results.
original weights to accommodate our smaller estimation sample and will use these weights in all markup regressions and statistics we produce.
In the last column of Table 1 we report the number of firms in the merged data falling into each category of the EFIGE firm characteristics. Relative to the overall sample size there are sufficiently large numbers of firms in each category, except that we have relatively few firms in the largest size category and firms involved in international outsourcing.
2.5 Empirical approach
Using the rich set of firm characteristics from EFIGE, we will explore how firm markups co- vary with the globalization variables within country and industry. We estimate the following equation on the cross section of 6,830 firms:
markupicj =Xicjβ0+Zicjγ0+δcj+εicj. (3) The dependent variable is the firm markup in 2009.14 Xicj is the vector of the firm variables of interest such as exporting status or group membership. All of these variables are presented in Section 2.3. Control variables Zicj include firm characteristics such as size, age, market share, TFP, as well as the market concentration index. The measurement of the latter three is described in Sections 2.1 and 2.2. δcj is a full set of country-industry dummies with 2-digit NACE industries and εicj is the error term.
An econometric concern is due to the fact that markup, market share, and TFP are all based on sales data from AMADEUS, which may be measured with error. This may introduce a spurious correlation between the markup and the other two variables and can lead to measurement error bias in the estimation. To mitigate this problem we use the lagged values of TFP and market share (and market concentration) in the regressions. We present basic descriptive statistics of the these lagged variables and the markup in Table 3.
We estimate (3) with Weighted Least Squares using the appropriate EFIGE sampling weights, as well as with robust standard errors clustered at the 2-digit industry level.
14Because some of the EFIGE variables (e.g. trading status) refer to year 2008, we always cross-check if the result is robust to the choice of the year. We find the all our main results are robust to this choice.
Table 3: Descriptive statistics of non-binary variables
Variable N mean st.dev median p25 p75 min max
Markup in 2009 6,830 1.241 0.304 1.164 1.036 1.359 0.739 4.029
Markup in 2008 6,830 1.287 0.311 1.208 1.072 1.413 0.740 3.910
Log TFP lagged 6,830 5.050 0.652 4.992 4.629 5.414 2.811 9.821
Market share in 2008 6,830 0.009 0.042 0.001 0.000 0.003 0.000 1.000 Age (years) 6,830 33.490 27.395 27.000 17.000 41.000 1.000 678.000 Market conc. (HHI) in 2008 6,830 0.059 0.096 0.027 0.010 0.067 0.001 1.000
3 Markups of European firms
Before turning to the results of the regression analysis, let us look at the country and industry variation of markups and review how some key firm and market characteristics may be correlated with it.
3.1 Country and industry variation of markups
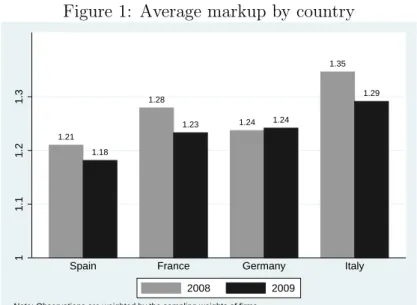
Figures 1 and 2 plot the markup averages (weighted by sampling weights) in 2008 and 2009 by country and broad industry groups, respectively, while Table 3 shows descriptives for the whole sample.
The average firm in our sample charged a 24 percent markup over marginal cost in 2009, down by 4 percentage points in comparison to year 2008. The fall in the average markup reflects the huge negative demand shock European firms faced during the 2008-09 global financial crisis.
The level of the markup and its change in comparison to the previous year varies consider- ably by country. In both years the highest markups were charged by Italian firms, the lowest ones by Spanish ones. The average markup for Italy is also statistically significantly higher than the average for Spain and France, both unconditionally and conditional on the industry structure of these countries. Italian markups remained relatively high despite the fact that they fell the most between 2008 and 2009. The average markup also fell considerably in France and Spain, while it remained unchanged in Germany. This pattern is consistent with the extent these countries were affected by the global financial crisis.
Figure 1: Average markup by country
1.21 1.18
1.28
1.23 1.24 1.24
1.35
1.29
11.11.21.3
Spain France Germany Italy
Note: Observations are weighted by the sampling weights of firms.
2008 2009
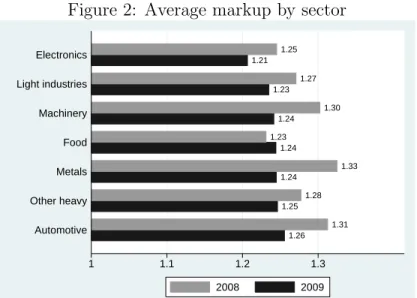
Across broad industry groups average markups differed only moderately in 2009, ranging from 21% in the electronics producing sector to 26% for automotive production. These industry differences are not statistically significant, except for electronics production, where the markup is found smaller than in the other sectors.15 The small industry variation in 2009 can partly be explained by the fact that sectors with the highest average markups in 2008 (metals, automotive, machinery) experienced the largest markup declines in 2009. The only sector whose markup did not fall between the two years is food production.
Naturally we find somewhat larger industry variation if we look at a more detailed two- digit classification (not reported here). Among manufacturing industries, we find the three largest average markups in 2009 by coke and petroleum (68%), beverages (50%) and other transport equipments (38%), the three smallest ones by pharmaceuticals (13%) furniture (14%) and other manufacturing (15%).
Nevertheless, country and industry variation explains only a small fraction of the overall heterogeneity in firm markups in both years. According to a simple ANOVA exercise we find that roughly 90% of the markup variation in 2009 remains unexplained after accounting for country and industry effects.
15This finding is not driven by differences in the industry structure of countries or in the firm size distri- bution across sectors.
Figure 2: Average markup by sector
1.26 1.31 1.25
1.28 1.24
1.33 1.24
1.23 1.24
1.30 1.23
1.27 1.21
1.25
1 1.1 1.2 1.3
Automotive Other heavy Metals Food Machinery Light industries Electronics
Note: Observations are weighted by the sampling weights of firms.
2008 2009
3.2 Firm demographics and domestic market structure
In this subsection we present the relationship between markups and key firm characteristics and market conditions (Table 4). These variables will be used as controls further on.
First, unconditionally, larger firms (in terms of employment) charge higher markups (column 1). This relationship, however, is to a considerable extent explained by the higher market share of these firms (column 2): having a 10 percentage points larger (domestic) market share is associated with a 7.6 percentage points larger markup. The Herfindahl- index of concentration, however, is not significant, suggesting either that this measure is an imprecise proxy of market structure or that the fixed effects do a relatively good job in controlling for market structure.
Column (3) also includes TFP, which is strongly related to markups (a 10% TFP is associated with 2.26 percentage points higher markups). The coefficient of market share becomes smaller, but it is still strongly significant both in economic and statistical terms suggesting that high market share or market power has an independent effect on markups.
Note that once we add TFP into the equation, interpreting individual employment size coefficients is problematic as employment size is formally part of TFP and is, hence, strongly correlated with it.
Finally, we also include firm age (column 4). Younger and older firms may price differ-
ently. For example, it is possible that young firms price more aggressively to gain market share (Foster et al., 2008). We find weak evidence for a negative association between firm age and markups: older firms seem to charge a bit lower markups, but this difference is not significant in economic terms.
Table 4: Markup, firm size, age and productivity
(1) (2) (3) (4)
Depvar: Markup in 2009
Size 20-49 employees (dummy) 0.0139∗ 0.0128 -0.0453∗∗∗ -0.0445∗∗∗
[0.0081] [0.0081] [0.0106] [0.0104]
Size 50-249 employees (dummy) 0.0476∗∗∗ 0.0389∗∗∗ -0.0941∗∗∗ -0.0897∗∗∗
[0.0119] [0.0106] [0.0149] [0.0142]
Size 250+ employees (dummy) 0.0583∗∗ 0.0129 -0.2145∗∗∗ -0.2030∗∗∗
[0.0229] [0.0209] [0.0324] [0.0312]
Market share in 2008 0.7631∗∗∗ 0.2893∗∗∗ 0.2945∗∗∗
[0.1319] [0.0785] [0.0780]
Market concentration in 2008 0.0471 0.0338 0.0379
[0.0358] [0.0494] [0.0494]
Log TFP lagged 0.2261∗∗∗ 0.2273∗∗∗
[0.0233] [0.0236]
Age (years) -0.0006∗∗
[0.0003]
R-squared 0.142 0.147 0.275 0.278
Observations 6,830 6,830 6,830 6,830
Notes: All specifications include country-industry (2-digit) dummies. Base- line sizegroup is 10-19 employees. Observations are weighted by the sampling weights of firms. Robust standard errors, clustered by industry, in brackets.
*** p<0.01, ** p<0.05, * p<0.1.
The explanatory power of these regressions is also of interest. Industry and country characteristics and firm size explain about 14% from the cross-sectional variation of markups.
The additional explanatory power of market share is about 0.5%. TFP, in contrast, explains an additional 13 percentage points. This large increase in explanatory power, however, may be partly of mechanical nature because, as it has already been discussed, the revenue-based
TFP includes prices, and to some extent, markups.
4 Markups and Globalization: Results
In this section we discuss the relationship between markups and our variables of various forms and channels of globalization. We first look at these channels individually and then, analyse their relative contributions in a joint model.
4.1 Various globalization channels
Exporting
Let us start with the relationship between exporting and markups. As we have already discussed, both self-selection and potential learning from exporting may predict a positive relationship between exporting and markups. Potential composition effects may counterbal- ance this relationship to some extent.
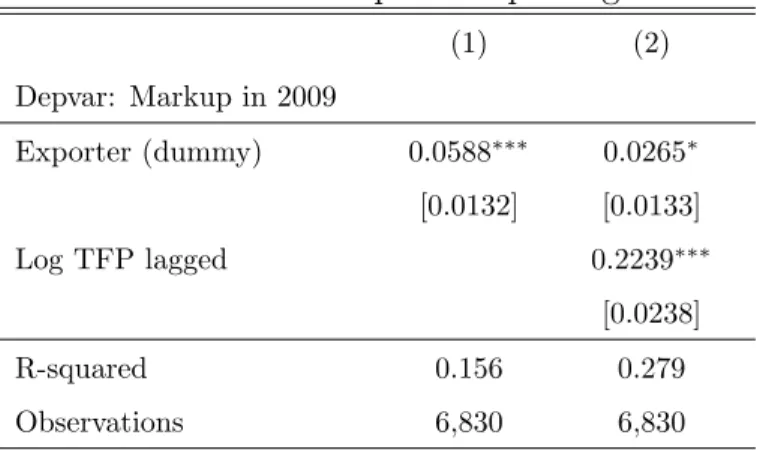
There is strong empirical evidence for a positive relationship between exporting and firm TFP. Our regression results, presented in Table 5, show that exporting is also positively associated with the firm markup. We find that exporters on average charge roughly 6 percentage points higher markups than non-exporters of the same size, age, and market share.
Once lagged productivity is also controlled for, our point estimate of the exporter markup premium is halved and the estimated coefficient loses most of its statistical significance.
Importing and outsourcing
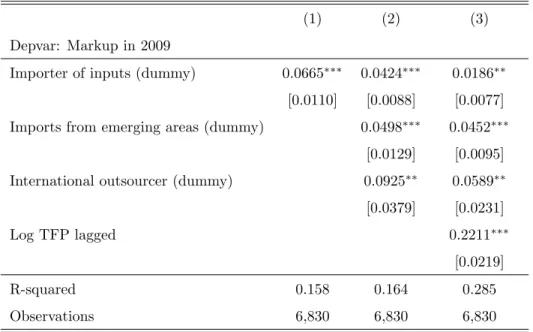
The relationship between importing and markups is predicted to be positive both by self- selection and causal explanations. We find that firms importing inputs charge significantly higher markups than non-importers (Table 6). The size of the importer markup premium is comparable to the premium estimated for exporters.
The source of the imported input also seems to matter (column 2). Firms which reported to have imported at least some of their inputs from emerging markets charge about twice as high markup as other importers.
Table 5: Markup and exporting
(1) (2)
Depvar: Markup in 2009
Exporter (dummy) 0.0588∗∗∗ 0.0265∗ [0.0132] [0.0133]
Log TFP lagged 0.2239∗∗∗
[0.0238]
R-squared 0.156 0.279
Observations 6,830 6,830
Notes: All specifications include market share, market concentration, age, size dummies and country-industry (2-digit) dummies. Robust standard errors, clustered by industry, in brackets. Observations are weighted by the sampling weights of firms.
Table 6: Markup and importing of inputs
(1) (2) (3)
Depvar: Markup in 2009
Importer of inputs (dummy) 0.0665∗∗∗ 0.0424∗∗∗ 0.0186∗∗
[0.0110] [0.0088] [0.0077]
Imports from emerging areas (dummy) 0.0498∗∗∗ 0.0452∗∗∗
[0.0129] [0.0095]
International outsourcer (dummy) 0.0925∗∗ 0.0589∗∗
[0.0379] [0.0231]
Log TFP lagged 0.2211∗∗∗
[0.0219]
R-squared 0.158 0.164 0.285
Observations 6,830 6,830 6,830
Notes: All specifications include market share, market concentration, age, size dummies and country-industry (2-digit) dummies. Robust standard errors, clustered by industry, in brackets. Observations are weighted by the sampling weights of firms. *** p<0.01, ** p<0.05, * p<0.1.
An alternative to importing is to outsource part of the production process. International outsourcing typically has a vertical motive, where the output of the outsourced production is imported back to the home country for further manufacturing or sale. Indeed, as a question in the EFIGE survey reveals, 80% of the outsourcing firms in our sample indicated that the main destination of the outsourced production is the firm’s home country.
Outsourcing can again generate cost savings, which can lead to an increase in markups if it is not fully passed through to consumers. We find evidence in line with this: firms active in outsourcing enjoy a significantly positive markup premium of 9 percentage points, which is similar in quantitative terms to imports from emerging markets.
When we include productivity, the point estimates become smaller but remain significant.
This is indicative of the presence of a direct effect of imports on markups on top of the self- selection hypothesis. Imports may reduce production costs and/or increase product quality, thereby allowing firms to charge higher markups.
Ownership and control
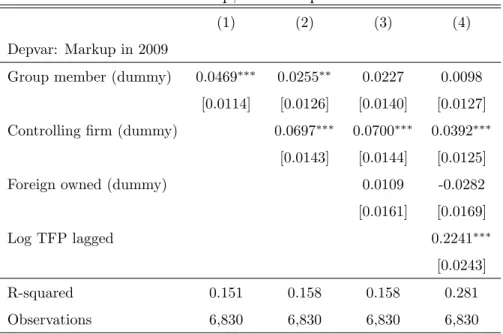
As we have discussed, being a member of business groups can yield advantages in knowledge flows, can provide cost savings, and may help in leveraging knowledge capital. We investigate these questions in Table 7.
Table 7: Markup, ownership and control
(1) (2) (3) (4)
Depvar: Markup in 2009
Group member (dummy) 0.0469∗∗∗ 0.0255∗∗ 0.0227 0.0098 [0.0114] [0.0126] [0.0140] [0.0127]
Controlling firm (dummy) 0.0697∗∗∗ 0.0700∗∗∗ 0.0392∗∗∗
[0.0143] [0.0144] [0.0125]
Foreign owned (dummy) 0.0109 -0.0282
[0.0161] [0.0169]
Log TFP lagged 0.2241∗∗∗
[0.0243]
R-squared 0.151 0.158 0.158 0.281
Observations 6,830 6,830 6,830 6,830
Notes: All specifications include market share, market concentration, age, size dummies and country-industry (2-digit) dummies. Robust standard errors, clustered by industry, in brackets. Observations are weighted by the sampling weights of firms. *** p<0.01, ** p<0.05, * p<0.1.
Column (1) suggests that, unconditionally, firms operating in business groups charge higher markups. As column (2) unveils, however, this premium is mainly enjoyed by firms which have affiliates (which have a 7 percentage point markup premium relative to non- group members), while affiliate group members have a much smaller premium. Interestingly, foreign ownership is not significantly associated with markups in our sample.
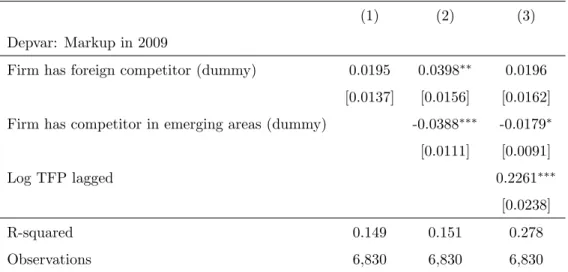
Global competitors
Foreign competition per se does not correlate with the firm markup (Table 8). Competition from emerging countries, however, does. Firms which report that their main competitors are located in emerging countries charge roughly 3 percentage points lower markup. A more detailed decomposition of geographical areas reveals that this effect is entirely driven by competition from Asia, in particular China and India.
Table 8: Markup and the competitors of the firm
(1) (2) (3)
Depvar: Markup in 2009
Firm has foreign competitor (dummy) 0.0195 0.0398∗∗ 0.0196 [0.0137] [0.0156] [0.0162]
Firm has competitor in emerging areas (dummy) -0.0388∗∗∗ -0.0179∗ [0.0111] [0.0091]
Log TFP lagged 0.2261∗∗∗
[0.0238]
R-squared 0.149 0.151 0.278
Observations 6,830 6,830 6,830
Notes: All specifications include market share, market concentration, age, size dum- mies and country-industry (2-digit) dummies. Robust standard errors, clustered by industry, in brackets. Observations are weighted by the sampling weights of firms.
*** p<0.01, ** p<0.05, * p<0.1.
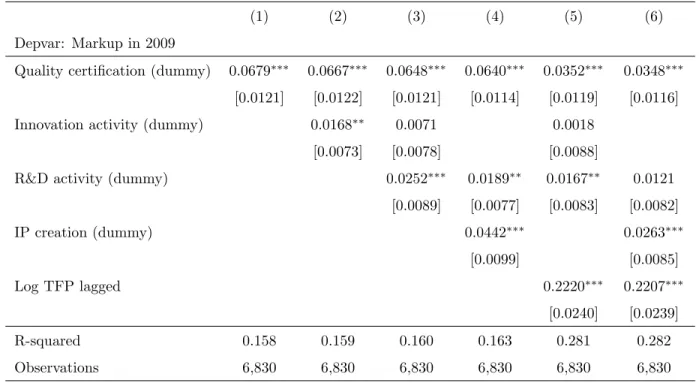
Innovation and product quality
The most important source of long-run competitiveness may be investment into quality and innovation. Process innovations may make production more efficient, and the cost savings can partly materialize in higher markups. Improving product quality or creating more differentiated products can similarly increase markups. All of these arguments predict a positive relationship between proxies for innovation and markups.
Table 9 shows the association between markups and different measures of product qual- ity and innovation. Quality certification, an important proxy for a high-quality production process, has a strong correlation with markups. Firms with quality certification charge 7 percentage point higher markups than similar firms without a certification. This premium remains significant even after controlling for productivity: even at similar levels of produc- tivity, firms with a quality certification charge 3.5 percentage point higher markups.
In column (2), we proxy innovative activities with a simple innovation dummy. This is only significant at the 5% level. Decomposing this into R&D-conducting and non-R&D- conducting innovative firms reveals that the markup advantage is only significant for R&D-