Who reaps the benefits of perMeable borders?
Mental Maps, netWorks and language skills in the hungarian- slovakian border-region
abSTracT
Every year the European Union spends millions of euros to promote cross-border cooperation among its member states. The efficiency of these expenditures is measured with indicators, such as
• the number of enterprises in the region increases
• the number of jobs along the border increases
• there is a given number of women among the project management staff All in all, we argue, that the indicators demanded by the EU are not suitable to measure how efficiently have the funds assigned to Cross-border Cooperation been spent.
The present paper aims to present a direct measurement of the efficiency of Cross- border cooperation programmes, based on
• mental mapping (how do people see the other side of the borders, the towns and villages, services and opportunities)
• language skills (how much do people speak the language of the neighbouring country, how functional are these language skills)
• and position generator (how much does their social network reach across the state border)
This proposed research tool is suitable for both a cross-sectional analysis of a given geographical region (e.g. the two regions of Hungary and Slovakia that were exami- ned in the pilot study), as well as a longitudinal analysis and measurement of the impact of Cross-border Cooperation programmes.
inTrodUcTion
From one programming period to the next, the amount of funding allocated for cross-border cooperation (CBC) programmes in the framework of the Community Initiative Interreg is increasing,1 however, little attention is given to the social effect of
1 In the 2007-2013 programming period 8.7 billion Euros were allocated. In the following fifth program- ming period of 2014-2020, which is still in progress, the amount of funding was raised to 10.1 billion Euros out of which 6.6 billion Euros were allocated for 60 cross-border programmes along 38 internal borders.
https://ec.europa.eu/regional_policy/hu/policy/cooperation/european-territorial/ (Retrieved: 11.07.2019)
these projects. The purpose of the eMMAP project was to provide a set of indicators, which measure these often neglected direct social effects of cross-border cooper- ation programmes on the basis of mental mapping, an estimation of social capital, and language skills. But more generally, this instrument is designed to be flexible enough to measure the relationship of people living alongside any border in the world.
In the construction of the measurement tool – i.e. the questionnaire –, it was im- portant for it to be suitable for various modes of data collection. As part of the pilot study we tested the questionnaire in face-to-face interviews, online self-completed and CATI surveys as well. For the purpose of the various modes of questioning, multiple versions of the modular questionnaire were produced. Although the design of the pilot study was cross-sectional, the methodology is suitable for longitudinal research as well.
Research with the paper-based questionnaire was conducted on four sites close to the border between Hungary and Slovakia. The pilot study’s other part was con- ducted online with the help of a newly developed ‘Online Mental Map Editor’ soft- ware, on a sample of Hungarian and Slovakian enterprises. First the questionnaires was sent by email to a list of addresses, and then a series of phone interviews was made to reach the target number of respondents in both countries.2 In this case we cannot speak of a representative sample, our goal was to prove the software’s applicability.
The paper is based on the first component, the personal interview survey. This pilot study showed that easy access has a profound effect not only on the frequency but also the nature of the visits to the neighbouring country. The results have also shown the linking role of language minorities, but also the effect of income and education level on the relationship with the neighbouring country. First we present the methods we used to explore the respondents’ relationship with the neighbour- ing country and its inhabitants, then the locations of data collection and finally we move on the results of the pilot study that we present in three sections according to the three main methodological components of the research.
Methodology
Mental or „cognitive mapping is a construct that encompasses those processes that en- able people to acquire, code, store, recall, and manipulate information about the nature of their spatial environment” (Down and Stea 1973, quoted in Letenyei 2006: 149).
The main idea behind mental mapping is that the use of space redraws the actual image of our surroundings in our minds. It affects how we perceive this particular space, what we consider close or distant, our own, friendly or alien and strange. The
2 The online sample consisted of 500 people (250 Hungarians and 250 Slovakian entrepreneurs from the border-region).
result is a mental representation of our surroundings consisting of mental spaces, boundaries and orientation points. The method of mental mapping is used to collect and interpret these cognitive maps of the respondents. Collection of data can take many forms ranging from purely quantitative data collection to purely qualitative and may be accompanied with map drawing, either based on free recall, or guided to ensure some level of standardisation, or also existing maps or images may be used. Regardless of the method, data on the area and data on the respon- dents’ aitudes and opinions are gathered. The data regarding the area (Lynch 1960) consist of
a) the names and extent of mental spaces b) borders and boundaries
c) orientation points and landmarks d) routes
e) junctions
In the pilot study we explored the frequency of the respondents’ visits to the neigh- bouring country, the names of the visited settlements (mental spaces), a route the respondents have used more often in the neighbouring country, junctions and reference points along this route, and reference points and places of interest in the town or settlement they knew the best. We also explored the respondents’ aitudes towards the neighbouring country and its inhabitants. The survey was complemented by the drawing of a map of the neighbouring country by the respondents (preferably) containing the places mentioned by the respondent.3
Another social impact of the projects supporting cross-border cooperation may be the emergence of cross-border interpersonal relationships. To measure this aspect, we chose the so-called position generator method (Lin-Dumin 1986; Lin, Fu and Hsung 2001) over other methods such as the name generator or the resource generator. The former of these two would have been more suitable to explore a restricted number of variously operationalized (see Wellman 1979, Marsden 1987, Fisher 1982) strong ties (Granovetter 1973, Lin–Erickson 2008), and less suitable to examine the diversity of personal networks, furthermore it is relatively time consuming. In the case of the resource generator (Snijders 1999, Van der Gaag
& Snijders 2005) the number of relevant resources is big, and may vary depending on life-situations, cultures, and geographical area. Van der Gaag, Snijders and Flap (2008) have found a strong correlation beween the results of the resource generator and the position generator, therefore, we decided to use the more easily applicable position generator. Further advantages of the position generator are that the position generator has been used successfully in a culturally diverse set of countries (Lin–Erickson 2008) and that the answering takes up relatively little time, and thus participants are more willing to answer.
3 For online self-completion surveys, an ‘Online Mapping System’ has been designed, to fully utilize the potential of the mental mapping methodology. Respondents had to pinpoint the settlements on an outline map.
Essentially, the respondent had to indicate whether he knows people of the listed occupations. The list included occupations that were relevant from the viewpoint of people living in borderregions and were fit to inspect both the vertical and hori- zontal reach of the respondents’ social networks (Lin-Erickson 2008), and all millieus identified by Angelusz and Tardos (2008) were represented by at least one position.
In a similar way we explored the relationship with relevant services: the respon- dents were asked to indicate whether they had any favourites, in both countries, out of the listed service-types and locations (town, village).
The third component assesses the respondents’ language skills, the extent to which the respondents are familiar with the language of the neighbouring country. On the one hand, we asked what languages the respondent spoke and at what level, simi- larly to the Europass CV to identify and control for people who are more proficient in the language of the neighbouring country. On the other hand, we developed a method, which explored the basic vocabulary needed to get around (e.g. to use a map or ask for directions), to get information during short period stays. The 25-item list included expressions that the respondents may come across in public, e.g. at a train station, in the main square, etc. One can learn these expressions during visits to the neighbouring country by natural language acquisition (Murányi 2015).
Incidentally, a respondent with such limited language capacity and unfamiliar with the grammar and vocabulary of the other language in general could declare that he didn’t speak the neighbouring country’s language at all in the Europass CV section.
The knowledge of the selected expressions was tested in three ways: as part of the active vocabulary, as part of the passive vocabulary, and finally we measured visual recognition. The concept of active and passive vocabulary is rather well known. The testing of visual recognition (using photos) allows us to know the extent to which respondents can recognise the target country’s reference points even if they are not familiar with their linguistic code, e.g. does a Hungarian visitor recognise a main square, a pharmacy, a bus stop in Slovakia, even if he does not speak Slovakian, so he does not understand the labels. The results of this method held no obvious surprise: Slovakia and Hungary are visually similar, and their reference points were recognised by the countries’ respondents even if they did not speak each other’s language at all (they were not familiar, even on a passive level, with the basic vo- cabulary of geing around). This may seem an obvious result to everyone familiar with the two countries, but we must point out that this indicator was conceived to measure the cognitive distance between any two countries.
Data collection locations and sample composition
The pilot research forming the basis of the paper was conducted in 2015 simulta- neously in four locations along the Slovak-Hungarian border. We chose two loca- tions in both countries: in Hungary, Esztergom and Mosonmagyaróvár; in Slovakia,
Štúrovo and Šamorín. In each location 125 respondents filled out the question- naire. The research was primarily designed to focus on comparison, and this goal was fulfilled from several aspects by the chosen settlements.
At the time of the 2011 census, Esztergom had 28,926 inhabitants and Mosonmagyar- óvár had 32,004; in both cases the vast majority declared Hungarian nationality, neither have significant minority ethnic groups. Štúrovo and Šamorín are somewhat smaller than their Hungarian counterparts: in the 2011 census, Štúrovo had 10,919 inhabitants and Šamorín had 12,726. Both towns have significant ethnic Hungarian minorities: in the last census in Štúrovo 6,624 (60.7%), while in Šamorín 7,309 (57.4%) people declared themselves ethnic Hungarians.
Esztergom and Štúrovo are members of the Ister-Granum EGTC, Mosonmagyar- óvár and Šamorín are members of the Arrabona EGTC. Moreover, Štúrovo and Esz- tergom are twin towns, and so are Šamorín and Mosonmagyaróvár. Coopera- tion between Štúrovo and Esztergom has a long history: the two municipalities became official twin towns in 1991. Later on, the respective mayors first agreed on a regional cooperation in 1999, which was further fuelled by the simultaneous accession of both countries to the European Union.4 Arrabona EGTC was estab- lished in 2010.5
Esztergom and Štúrovo are border crossing points, they have been connected by the Mária Valéria Bridge since 2001, and previously the Danube could be crossed by ferry. However, there is no direct connection between Šamorín and Moson- magyaróvár. The closest border crossing point on road is 18 kilometres from Mo- sonmagyaróvár (Rajka-Rusovce), and approximately 27 kilometres from Šamorín (Gabčíkovo-Lipót).
Thus, a two-dimensional comparison could be made: on one level, the samples of the two Hungarian and two Slovak settlements could be compared, by which we could examine the effect of the direct connection and the longer cooperation; on a second level, the two Slovak samples could be compared with the two Hungarian ones, which showed the role played by minority groups living in neighbouring countries.
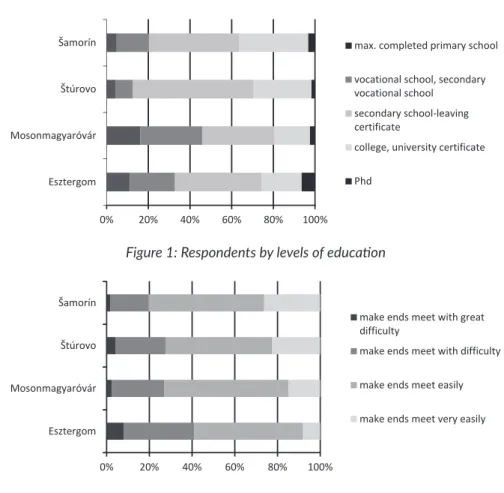
Figures 1 and 2 show the composition of the samples by two control variables: level of education and subjective income. The Slovak samples had more respondents with secondary school certificate, but the two Slovak samples did not show signifi- cant differences. The subjective income composition of the two Hungarian samples did differ, however: the replies given by the Mosonmagyaróvár respondents indicated a somewhat better income situation. The Slovak samples did not differ greatly from each other, nor from that of Mosonmagyaróvár.
4 Ister-Granum EGTC (http://www.istergranum.hu/tortenet.html, 12th May, 2015) 5 Arrabona EGTC (http://www.arrabona.eu/egtc_bemutatas.html, 12th May, 2015)
Figure 1: Respondents by levels of education
Figure 2: Respondents by their subjective income
There were many respondents with Hungarian mother tongue in the Slovak samples:
we found 99 Hungarian speakers in Štúrovo, 116 in Šamorín, while there were 20 Slovak speakers in the former and 6 in the latter sample; however, out of them 18 and 4, respectively, spoke Hungarian as a foreign language. There were none with Slovak mother tongue in the Hungarian samples; except for a small number of the respondents, all declared Hungarian mother tongue. Language skills are discussed in more detail in the next section.
Main findings
1. reSPondenTS’ menTal maPS
As Figure 3 shows, the presence of ethnic Hungarian respondents and respondents with at least basic Hungarian language skills in the Slovakian samples resulted in a higher proportion of those respondents that have visited Hungary at least once.6
This is true for almost everyone in these two samples. However, contrary to our expectations, this proportion does not differ significantly in the two Hungarian samples. The proximity of the border apparently did not play a deciding role in this aspect. While Mosonmagyaróvár and Šamorín are located several kilometres from the nearest border crossing point, thus it takes a rather considerable detour to get to Slovakia or Hungary, the same percent of respondents have visited the neigh- bouring country as in the other two cases. The expected difference, however, can be found in the frequency of the visits.
Figure 3: Respondents on whether they have ever been to the neighbouring country There were only 4 people in Štúrovo and 12 in Esztergom who indicated that they have not been to the neighbouring country in the last 12 months. This number was 39 in Mosonmagyaróvár and 10 in Šamorín. The respondents of Esztergom visited the neighbouring country on average 34.7 times in the last 12 months, of Štúrovo 30.12 times, of Šamorín 8.47 times, and of Mosonmagyaróvár only 1.94 times. Based on the median values, the first two samples switch places: the median is highest in Štúrovo with 20 visits, in Esztergom it is 13.5, in Šamorín 4, and in Mosonmagyaróvár 1, which means half of the respondents have been to the neigh- bouring country maximum this many times, and the other half minimum this many times. Both estimates showed a rather close connection of the Štúrovo and Eszter- gom residents to the neighbouring country. Further, they showed that the values were higher in Šamorín than in Mosonmagyaróvár, which we attribute mainly to the presence of the ethnic Hungarian minority. These results supports the assumption usually present in academic literature about the mediator and bridge function of linguistic minorities.
Those respondents that had already been to the neighbouring country were asked further questions: they were asked to name a settlement, which they visited most often, and could list a maximum of 5 other settlements they had been to. According to the answers, in all samples it was the closest town they visited most often. The
6 As the section on language skills will show, there were only few people who spoke any Slavic language in the Hungarian samples.
data clearly demonstrates the existing strong ties between Esztergom and Štúrovo.
In Šamorín, the primary destination was Győr, the second in line was Budapest; in Mosonmagyaróvár, most people listed Bratislava as first, while Šamorín was tied in second place with Dunajská Streda with only 7.5% of the responses. If we add- ed to this the rest of the settlements the respondents had visited, we got more settlement names that were situated far from where the survey was carried out:
typical tourist and holiday resorts had a relatively high number of mentions, such as the settlements of the High Tatras and Piešťany in Slovakia, and Lake Balaton in Hungary. Respondents in Slovakia also mentioned several large Hungarian towns, primarily county capitals (e.g. Eger, Debrecen, Szeged, Pécs).
Nevertheless, the strong relationship between Esztergom and Štúrovo was still ob- vious in the comprehensive list: Esztergom was named by 121 out of 125 respon- dents in Štúrovo, and Esztergom respondents put Štúrovo far above the rest of the list with 85 mentions, while the second was Bratislava with 13, and the third was Komárno with 12. The comprehensive list showed that Mosonmagyaróvár respon- dents listed Bratislava first (72), Šamorín second (21), and Dunaszerdahely third (17). Most of the Šamorín respondents visited Győr most often (115), Budapest was in second place (102), and Mosonmagyaróvár was only the third (33) on the list. It is thus clear that for those living in Mosonmagyaróvár and in Šamorín are primarily affected by the pulling effect of the nearby big towns (Bratislava, Győr, Budapest) and rarely visit the twin town, while respondents living in Esztergom and Štúrovo, connected by a bridge since 2001 tend to concentrate their visits on each other’s town.
The strong relationship of these two towns was evident from the routes that the respondents described as well: Štúrovo and Esztergom functioned not only as des- tinations but in case of longer routes as transit and orientation points. In the case of even farther destinations, Budapest was the most frequently mentioned set- tlement in between. In the other two samples, the twin town had no dominant role, the already mentioned pulling effect of the respective capitals could be per- ceived. The twin town was cited by 5 people in Mosonmagyaróvár, and only by one in Šamorín. The respondents of Mosonmagyaróvár named Bratislava as the town “in between” on the way to farther destinations, and Rajka in the case of visits to the Slovak capital; Šamorín respondents most often travelled through Budapest or Győr.7
7 The graphs of typical routes can be found in the Appendix.
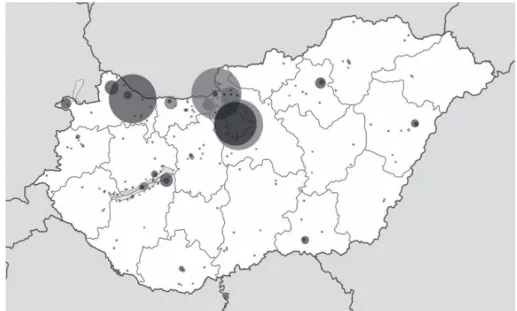
Figure 4: What respondents from Esztergom and Mosonmagyaróvár perceive of Slovakia (Esztergom – light, Mosonmagyaróvár – dark)
Figure 5: What respondents from Stúrovo and Šamorín perceive of Hungary (Stúrovo – light, Šamorín – dark)
The respondents from Esztergom indicated 1.42 visited settlements on average (out of a maximum of 1+5), those of Mosonmagyaróvár 1.85, of Šamorín 4.85, and of Štúrovo 4.91. On the one hand, it is apparent that respondents in Slovakia, pri- marily ethnic Hungarians, know Hungary better than the Hungarian respondents know Slovakia. On the other hand, the higher average in Mosonmagyaróvár than Esztergom shows a different kind of relationship with the neighbouring country:
one that results in a relatively more diverse set of destinations.
The reasons and motivations of the visits answers were examined in two forms:
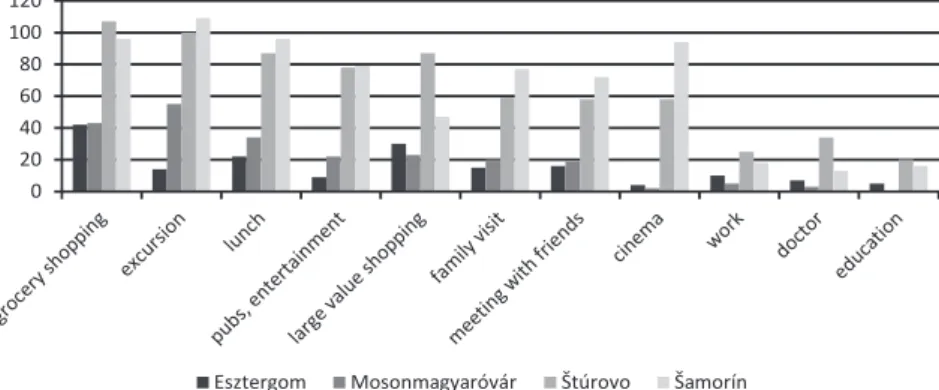
on the one hand, respondents could formulate them in their own words, and on the other, they had to state whether they had taken part in the listed activities in the neighbouring country. The answers given to the two types of questions were in harmony. In Šamorín and Mosonmagyaróvár, recreation (excursions, holidays, tourism) ranked higher than in Esztergom and Štúrovo, but, perhaps linked to the above mentioned, many took part in small or large-scale shopping, had lunch in a restaurant, chose some form of entertainment, and a relatively high percentage visited family or friends. In Esztergom and Štúrovo however, the needs of daily life, e.g. shopping proved to be more important than in the other two cases. The respondents in Esztergom highlighted the cost of petrol in Slovakia, which for a long time was more favourable to the Hungarian petrol cost, the fair of Štúrovo, and they also mentioned that the proximity of Štúrovo and the ease of its access appeared as further motivations. Employment, education, and doctor’s visits were listed among the less common activities, however, these ranked higher in Štúrovo and Esztergom than in the other two settlements.
Figure 6: How many of the respondents took part in the following activities in the neighbouring country?
The average number of activities was 1.81 in Mosonmagyaróvár and 1.39 in Esz- tergom. The Slovak samples presented higher values: respondents reported 5.7 activities in Štúrovo and 5.66 in Šamorín. The differences between settlement pairs were not significant, and the somewhat higher values in Mosonmagyaróvár may have been caused by the wide spectrum of activities they took part in during
holidays and excursions (lunch, entertainment), which again shows the different nature of the visits.
Respondents were also asked to imagine a visit to the settlement they visited more often with the interviewer, and name the places they would undoubtedly have him visit. The responses underpin our claims referred to above: for Štúrovo and Esz- tergom residents, visits to the neighbouring country are different from those of Šamorín and Mosonmagyaróvár. The respondents of the first two samples would take the interviewer shopping (to malls, stores, markets), while the residents of the latter two preferred recreational activities (sights, baths, theatre, cinema, etc.).
Figure 7: What would the respondents have the interviewer undoubtedly see in their most visited settlement?
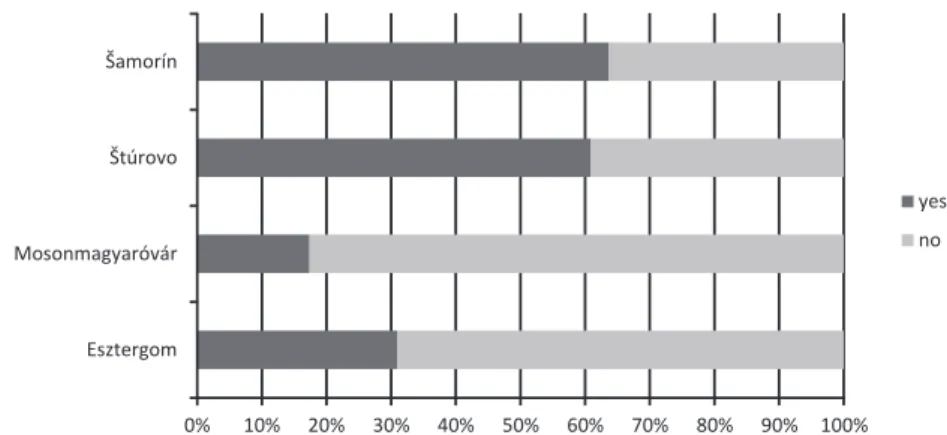
Another significant difference between samples was the willingness to live for a specific time in the neighbouring country, which, of course, was very much influ- enced by the respondents’ language skills. The question was two-fold: first, they had to state whether they would live in their most visited settlement, and after that they could freely choose a settlement they would be willing to live in. Figure 8 shows a comprehensive picture about the percentage of respondents willing to live in the neighbouring country for a couple of years. It was apparent that the percentage of those who were willing was higher in the Slovak settlements, given the presence of Slovakian Hungarians, but at the same time, it was obvious that their proportion was higher in Esztergom than in Mosonmagyaróvár. A possible interpretation of these results is that Esztergom respondents accept the neighbouring country more easily, because they visit it more often, and they have more experience of the daily life there.
Figure 8: Respondents’ replies on whether they would be willing to spend a couple of years living in the neighbouring country for work purposes
Deeper familiarity with the neighbouring country showed strong positive correla- tion with education levels and subjective income, the reverse of which meant that people with lower education level and/or poorer people could benefit less from the advantages presented by the proximity of the border.
The frequency of visits to Slovakia was clearly influenced by the level of educa- tion: in the last year, respondents from Štúrovo with college or university degree have been to Hungary 49 times, with secondary school-leaving certificate or lower 25 times, and with vocational certificate only 19 times. In Šamorín, the difference presented itself between the respondents with and without secondary school-leaving certificate: respondents with higher education level visited Hungary 10-11 times on average, those with lower education level only 3 times. Subjective income only had a manifest effect in Šamorín. This also suggests that in Šamorín, a visit to Hun- gary was also a question of available financial resources, as opposed to Štúrovo, where, as it was the already mentioned, proximity and easy access eliminated the role of financial resources.
In the Hungarian samples, neither education levels, nor income had palpable effects on the frequency of neighbour visits, but age did: younger residents crossed the border over to Slovakia more often.
The number of towns the respondents had visited and named (the scope of the mental map) was related to levels of education in Esztergom and Štúrovo, and to subjective income in Mosonmagyaróvár and Šamorín. In Esztergom, college or university graduates named 2 settlements on average, people with secondary school-leaving certificate 1.5, and those with vocational certificate or lower only 0.9. In Štúrovo, those with lower than completed secondary education listed 4.4 settlements on average, while those with higher level of education approximately 5.1-5.2 settlements. In Mosonmagyaróvár, those who found it hard or very hard to
make ends meet named 1.33 visited settlements, while 2.1 were named by those living in better financial situation. In Šamorín, these values were 3.8 and 5 respec- tively.
2. InTERPERSOnAl nETwORkS
Interpersonal network of the respondents were explore using the position gener- ator method. All in all, we can state that the social network of the respondents did not reach far over the border. Slovakian respondents, most of all ethnic Hungari- ans, had more personal relationships in Hungary than vice versa, and the absolute number of relationships was positively influenced by education and income levels.
Out of the 22 listed occupations, on the average 1.35 was mentioned in Esztergom, 0.67 in Mosonmagyaróvár, 2.8 on Šamorín, and even in Štúrovo the number of mentions was only 3. The difference in sample averages is due to a higher percent- age of respondents in Štúrovo and Esztergom who could access a relatively high number of contacts. The limits of the top deciles were 6 in Esztergom, only 2 in Mosonmagyaróvár, while 9 in Štúrovo and 7 in Šamorín: the most well-connected 10% of the respondents in each settlement, knew people of at least that many oc- cupations in the neighbouring country.
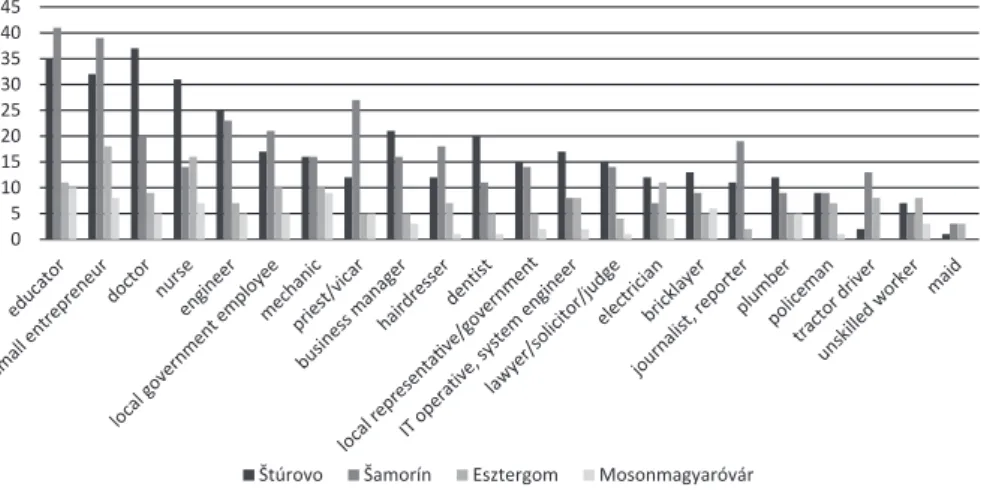
There were of course noticeable differences between the occupations. Some were relatively well known, like teachers, small entrepreneurs, doctors, and nurses, while occupations like maids, unskilled workers, tractor drivers, and policemen were barely mentioned.
Figure 9: The number of respondents that knew people of the listed occupations
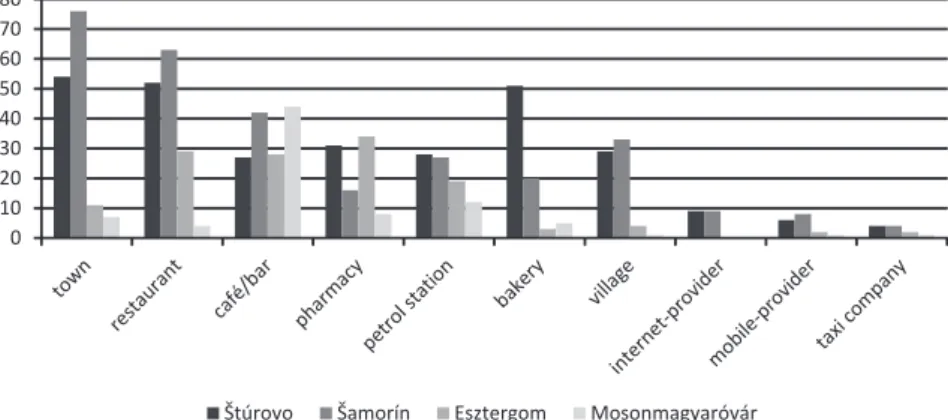
Figure 10: The number of respondents with favourite services or locations in the neighbouring country
In a similar way we asked whether respondents had any favourite services and settlements in the neighbouring country. On the average, there were 1.1 favourite places in the Esztergom sample, 1.7 in the Mosonmagyaróvár one, 2.1 in the Štúrovo one, and 2.3 in the Šamorín one. The results again showed higher values in the Slovakian samples and are consistent with the different nature of the visits:
e.g. respondents from Šamorín and Mosonmagyaróvár were more likely to have a favourite bar, but less likely to have a favourite pharmacy.
3. lAngUAgE SkIllS
Figure 11 and 12 show the foreign languages spoken by the respondents. Most respondents int he Hungarian samples did not list any, but most of those who did, listed German or English. There were 10 people in Esztergom who spoke some degree of Slovak, and there were 5 who spoke some other Slavic languages (Russian, Croatian, and Czech). Nobody spoke Slovak in Mosonmagyaróvár, but 10 spoke Russian. In Šamorín and Štúrovo, the most common “foreign” language was the offi- cial language of the country, as most of the respondents were of Hungarian mother tongue. The other most spoken languages were English and German, too. Most of Slovak mother tongue respondents also spoke a certain degree of Hungarian.
Figure 11: Knowledge of foreign languages in Esztergom and Mosonmagyaróvár
Figure 12: Knowledge of foreign languages in Štúrovo and Šamorín
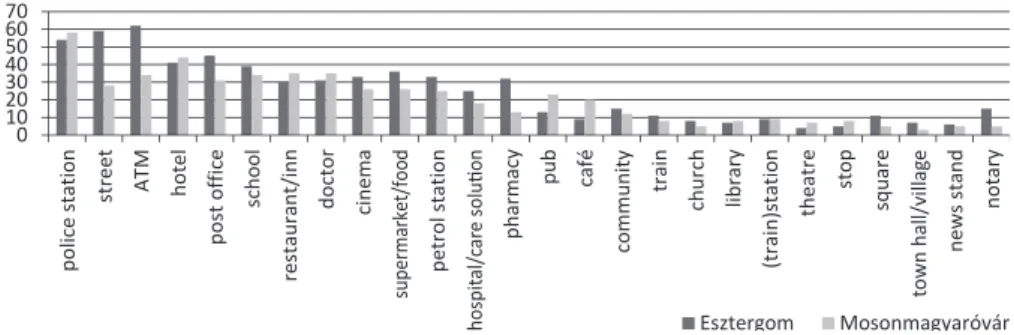
Figure 13: The following expressions were present in the active vocabulary of the respondents
Due to the high proportion of ethnic Hungarians and Slovaks speaking Hungarian as a foreign language in Štúrovo and Šamorín, 24.6 and 24.4 expressions, respec- tively, were present in the active vocabulary on average. Of the listed expressions, 5.1 were present in the residents’ active vocabulary in Esztergom, and 4.2 in Mo- sonmagyaróvár. The median, which is less sensitive to outlier values, was 4 in Esz- tergom and only 1 in Mosonmagyaróvár, so the difference in between cannot be explained by the presence of Slovak speakers in the Esztergom sample.
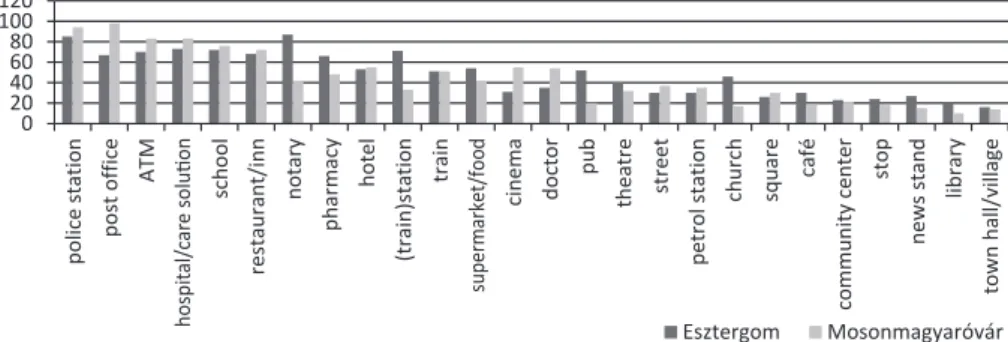
Figure 14: The following expressions were present in the active or passive vocabulary of the respondents
However, the difference in between the two samples disappeared when we also took into account the recognition of foreign language expressions. Mosonmagyar- óvár respondents were more successful in this respect. In Esztergom, 10 words were recognized actively or passively on average, while in Mosonmagyaróvár 9.2 on average, the median was 9 in both cases.
There were well-known and not-so-well-known words listed. All in all, many re- spondents recognised words that had similar Slovak and Hungarian forms, or which they recognized as the forms used by major European languages, e.g. polícia - police station, pošta - post office, hotel - hotel, bankomat - ATM. When the two forms of the word differed greatly in the two languages and also from major European language form (e.g. újságárus – novinový stánok - newsstand, színház – divadlo - theatre, város- háza – mestský úrad - town hall, könyvtár – knižnica - library) they were recognized by less people. In some of these cases, and especially in the case of the active vocabu- lary, there were significant differences between Esztergom and Mosonmagyaróvár, which shows the positive effect of the frequent visits on natural language acquisition.
4. CORRElATIOnS BETwEEn InDICATORS
The study yielded a number of indicators that measure the intensity (e.g. frequency of visits), diversity (e.g. visited settlements, activities) and effects (e.g. language skills, interpersonal networks) of the visits in the neighbouring country, which indicators are, of course, interrelated. Beside the magnitude of the individual indicators, the patterns of their correlation provides additional insight into the residents’ relation- ship with the neighbour country.8
In Esztergom for example, there was a strong correlation between the two indicators measuring the frequency of the visits (last year and total visits to primary destina- tion), which, however, was not present in Mosonmagyaróvár. This is consistent with
8 The correlation matrices can be found in the Appendix
our reasoning that the visits of Esztergom respondents were chiefly concentrated at one particular settlement: for most of them, it was Štúrovo. However, for Moson- magyaróvár residents, there was no settlement of this degree of popularity; their latest visits did not target the same, already well-known destination. This is sug- gested by the fact that there is a medium strong correlation between the number of visits to the settlement at the top of the list and the number of settlements listed in Mosonmagyaróvár: the more visits to the primary destination, the more visits to other places, frequency and diversity go (more or less) hand in hand.
It is also interesting to note that the number of occupations, favourite services, and enjoyed activities are all primarily correlated with the number of listed settlements, and there is only a much weaker correlation with the frequency of the visits if there is any correlation at all: thus, for respondents to have many relations and favourites in the neighbouring country visiting a higher number of different settlements yields more than frequent visits to the same settlement.
Except for the Šamorín sample, and primarily in the Mosonmagyaróvár one, there is a relatively strong correlation between the number of listed settlements and the number of enjoyed activities, that is, the indicators measuring the diversity and variety of the relationship with the neighbouring country. The proportion of lower correlation coefficients in the matrix of Šamorín is relatively high, which appears to show that the different indicators measuring the relationship with Hungary are more independent from each other. Significant correlation was only present between the indicators of the visit frequency and the number of activities, the latter of which is rather strongly connected to the number of occupations known.
In contrast, in Štúrovo, relatively high correlation coefficients are much more frequent. Out of all the indicators, only that of the number of visits to the firstly listed settlement shows a relatively weak correlation with the others.
SUmmary
Our study presented the main results of the pilot research carried out at the Slovak- Hungarian border. The pilot study tested the suitability of a questionnaire that measures the direct social effects of CBC projects, and the relationship of residents on both sides of any border with the neighbouring country, their knowledge thereof and aitudes towards it and its inhabitants, and finally the consequences of their cross-border visits on their social networks and language skills.
The results demonstrated that the presence of ethnic kin in the border region exerts considerable influence on the development of cross-border relationships. This was shown by the percentage of those who have ever been to the neighbouring country (Hungary), their knowledge about this country (e.g. the number of settlements they had visited), and also by their number of weak ties to people on the other side of the border.
Furthermore, other differences have also been revealed. The respondents in Esz- tergom had the stronger relationship with the neighbouring country than respon- dents in Mosonmagyaróvár, while of the Slovak samples the same was true for the residents of Štúrovo. Compared to the respondents of Mosonmagyaróvár, those of Esztergom visited Slovakia more often in the last year, they were also more willing to live a couple of years in the country, they had more cross-border relationships, and their active vocabulary was also relatively more extensive than that of Mos- onmagyaróvár respondents. Accordingly, the relationship of Štúrovo respondents with Hungary was more intense: the number of their visits to the neighbouring country in the last 12 months was especially high, and they also had more, although only slightly more, relationships across the border.
However, some indicators subverted our expectations, and indicated a relationship motivated by different factors in Mosonmagyaróvár and Šamorín on the one hand, and Esztergom and Štúrovo on the other. Recreational visits more typical in the former pair of samples led to a higher number of listed destinations and favourite services, while the visits motivated by everyday activities (e.g. grocery shopping) more typical of the latter pair, tended to be concentrated on one particular des- tination. Additionally, although all in all these activities were not typical at either location, the number of those who studied, worked, or went to the doctor in the neighbouring country was higher in Štúrovo and Esztergom; these were the activities that indicated a tighter, regular connection.
It is important to point out the strong relationship between Štúrovo and Eszter- gom: in both settlements, the most well-known settlement was the twin town, and the most frequently visited. The same cannot be claimed about the relationship between Mosonmagyaróvár and Šamorín: for Šamorín respondents, the most well- known settlements were Győr and then Budapest, and for those in Mosonma- gyaróvár, the primary destination was Bratislava, with Šamorín trailing far behind.
The direct connection offered by the Mária Valéria Bridge offers ample opportuni- ties for the residents of Štúrovo and Esztergom to visit the neighbouring country, they can do so easily, even on foot. Therefore, it is not a privilege of those in a consolidated financial situation, but everyone, regardless of wealth can profit from the permeability of the border.
The situation of Šamorín and Mosonmagyaróvár is different. Although they are only 17 kilometres away as the crow files, they are still relatively far from border crossing points, thus a visit to Hungary and Slovakia is more typical for those in higher in- come positions. The construction of a new, closer border crossing point could, even significantly, transform the relation of Šamorín and Mosonmagyaróvár residents with their neighbouring country.
As a result, out of all the potential covariates which could explain the strength of the connection, education level was the strongest influencing factor in the case of Esztergom and Štúrovo, but subjective income proved to be more influential in Šamorín and Mosonmagyaróvár. This is again consistent with the different type of the visits: shopping in one case and recreation, holiday in the other.
bibliograPhy
Angelusz, R.– Tardos, R. (2008) Assessing Social Capital and Attainment Dynamics: Position Generator Applications in Hungary, 1987-2003. In: Lin, N. –Erickson, B.H. (eds.) Social capital:
An International Research Program. Oxford: Oxford University Press, 394–420.
Downs, R.M.–Stea, D. (eds.) (1973) Image and environment: cognitive mapping and spatial be- havior. Chicago: Aldin Publishing Company
Fischer, C.S. (1982) To Dwell among Friends: Personal Networks in Town and City. Chicago: Uni- versity of Chicago Press
Granovetter, M. (1973) The Strength of Weak Ties. American Journal of Sociology, 78, 1360- 1380.
Letenyei L. (ed.) (2006) Településkutatás I. Budapest: TeTT könyvek
Lin, N.–Dumin, M. (1986) Access to Occupations Through Social Ties. Social Networks, 8, 365-385.
Lin, N.–Erickson, B.H. (2008) Theory, Measurement, and the Research Enterprise on Social Capital. In: Lin, N.–Erickson, B.H. (eds.) (2008) Social Capital: An International Research Program.
Oxford: Oxford University Press, 1-26.
Lin, N. –Fu, Y. –Hsung, R. (2001) The Position Generator: Measurement Techniques for Social Capital. In: Lin, N. –Cook, K. –Burt, R.S. (eds.) Social Capital: Theory and Research. New York:
Aldine de Gruyter, 57–81.
Lynch, K. (1960) The Image of the City. Cambridge, MA: MIT Press
Marsden, P.V. (1987) Core Discussion Networks of Americans. American Sociological Review, 52, 122-131.
Murányi, P. (2015) Természetes Nyelvtanulás. Budapest: Leviter Kft.
Snijders, T.A.B. (1999) Prologue to the measurement of social capital, La Revue Tocqueville, 20, 27-44.
Van der Gaag, M.P.J. – Snijders, T.A.B. (2005) The Resource Generator: social capital quanti- fication with concrete items. Social Networks, 1, 1-29.
Van der Gaag, M.P.J.– Snijders, T.A.B.–Flap, H.D. (2008) Position Generator measures and their relationship to other social capital measures. In: Lin, N. –Erickson, B.H. (eds.) Social capital:
An International Research Program. Oxford: Oxford University Press, 27–48.
Wellman, B. (1979) The Community Question: The Intimate Networks of East Yorkers. Ameri- can Journal of Sociology, 84, 1201-1231.
aPPendix
Figure 15: Routes taken by Esztergom respondents9
Figure 16: Routes taken by Mosonmagyaróvár respondents
9 The position of the settlements on Figures 15 through 18 does not reflect their geographical location.
Figure 17: Routes taken by Štúrovo respondents
Figure 18: Routes taken by Šamorín respondents