Effects of the Personal Income Tax Changes from the Point of View of Individuals
Richárd Nagy,
IT
engineer, VII. SemesterAlba Regia University Center, Óbuda University, Székesfehérvár, Hungary n.ricsi05@gmail.com
Dr. Valéria Varga, College docent
Alba Regia University Center, Óbuda University, Székesfehérvár, Hungary varga.valeria@arek.uni-obuba.hu
Abstract–Do you want to pay tax fees because of tax returns? Certainly there is only one preferable answer for this question from everybody which is „Of course not!” but unfortunately it’s required. Let’s see what’s going on! Nobody likes the tax that is paid after the income which was earned in the previous year among people who do money earning activities. This tax is nothing more than the income tax. The income tax law is modified in every year. Most of the major changes have been in recent years which are worth exploring.
Certainly we could get some surprising data as a result while we are observing consecutive years. It‘s definitely worth reviewing the alteration of the individuals’ – who have different financial situations – net income including their tax benefits. The income tax belongs to one of the most important state revenue. As a major source of revenue, it significantly influences the alteration of state budget.
I. INTRODUCTION – THE INCOME TAX The goal of personal income tax is that individuals are forced to contribute to the public burdens and provide the tax revenues for state and local government budget.
Features of the personal income tax:
• It has a personal nature;
• All of the individual’s income is taxable;
• General tax;
• Direct tax;
• Tax exemption is available;
• Tax benefit can be granted only if the contract achieves the rule’s goal;
• It’s accounted in calendar years;
• Tax advances must be paid during the year;
• Tax assessment is made by self-assessment;
• It’s based on the principle of fairness and equity;
• Don’t be performance retention.
Tax return is required at all for:
• Employee who has income in the tax year;
• Self-employed people;
• Drop rate taxpayer;
• Those who pay back housing and insurance discount;
• Those who have outstanding investment tax credit and are bounded to repayment [2].
II. CHANGES OF TAX LAW (2010-2011) A. The Tax Rate
TABLE I.
THE TAX RATE IN 2010 2010
up to 5.000.000 HUF 17%
from 5.000.001 HUF 850.000 HUF + (Income- 850.000 HUF) x 0,32 The consolidated tax base is the income’s increased
amount with the tax base supplement (27 percent).
TABLE II.
THE TAX RATE IN 2011 2011 16%
The consolidated tax base is the income’s increased amount with the tax base supplement
(27 percent).
It’s Uniformly16%. It’s equivalent to 20,32%
with respect to the income before the up-grossing.
It must be applied to the consolidated tax base and all separately taxed income (movable and immovable cessions, fringe benefits, capital gains, interest rate reductions, profit).
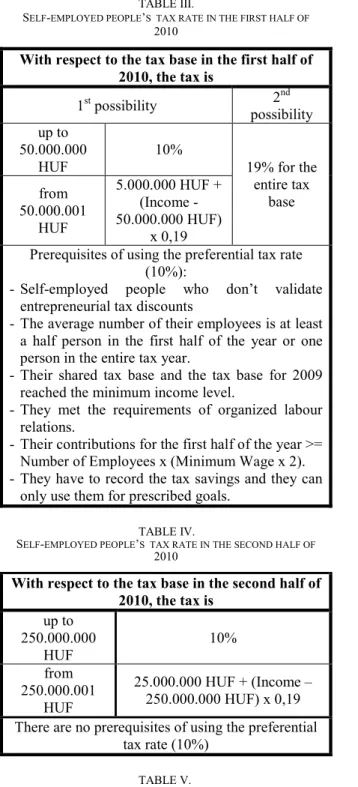
TABLE III.
SELF-EMPLOYED PEOPLE’S TAX RATE IN THE FIRST HALF OF
2010
With respect to the tax base in the first half of 2010, the tax is
1st possibility 2nd possibility up to
50.000.000 HUF
10%
19% for the entire tax
base from
50.000.001 HUF
5.000.000 HUF + (Income - 50.000.000 HUF)
x 0,19
Prerequisites of using the preferential tax rate (10%):
- Self-employed people who don’t validate entrepreneurial tax discounts
- The average number of their employees is at least a half person in the first half of the year or one person in the entire tax year.
- Their shared tax base and the tax base for 2009 reached the minimum income level.
- They met the requirements of organized labour relations.
- Their contributions for the first half of the year >=
Number of Employees x (Minimum Wage x 2).
- They have to record the tax savings and they can only use them for prescribed goals.
TABLE IV.
SELF-EMPLOYED PEOPLE’S TAX RATE IN THE SECOND HALF OF
2010
With respect to the tax base in the second half of 2010, the tax is
up to 250.000.000
HUF
10%
from 250.000.001
HUF
25.000.000 HUF + (Income – 250.000.000 HUF) x 0,19 There are no prerequisites of using the preferential
tax rate (10%) TABLE V.
SELF-EMPLOYED PEOPLE’S TAX RATE IN 2011 AND 2012 From January 1, 2011 (year 2012 is also
affected) the tax rate is up to 500.000.000
HUF
10%
from 500.000.001 HUF
50.000.000 HUF + (Income – 500.000.000 HUF) x 0,19 There are no prerequisites of using the preferential
tax rate (10%)
Self-employed people’s PIT is an exception. If the annual tax base is less than 500 million HUF then the tax rate is 10%, if the annual tax base is more than 500 million HUF the tax rate is 19%.
Entrepreneurial withdrawals that are accounted as costs are 16% and the entrepreneurial dividend base is 16%.
Another exception is the tax after the yield of income from a long-term investment. It’s 10 % after a 3 years deposit and it’s tax-free after a 5 years deposit [1], [3], [5].
B. Contributions
TABLE VI.
INSURED PEOPLE’S CONTRIBUTIONS IN 2010(1)
Distribution of payable contributions that are paid by insured people (from January 1, 2010 to
October 31, 2010) Pension
contribution Private pension fund (PPF) membe rship
fee
Health insurance and labour market contribution Not a
mem ber of a PPF
Mem ber of a PPF
Health insuran
ce contrib ution in
kind
Health insura
nce contri bution
in cash
Labou r market contrib
ution
9,5% 1,5% 8% 4% 2% 1,5%
TABLE VII.
INSURED PEOPLE’S CONTRIBUTIONS IN 2010(2)
Distribution of payable contributions that are paid by insured people (from November 1, 2010 to
December 31, 2010) Pension
contribution Private pension fund (PPF) membe rship
fee
Health insurance and labour market contribution Not a
mem ber of a PPF
Mem ber of a PPF
Health insuran
ce contrib ution in
kind
Health insura
nce contri bution
in cash
Labou r market contrib
ution
9,5% 9,5% 0% 4% 2% 1,5%
There weren’t so many changes between the first and the second half of 2010 in connection with contributions. The private pension fund’s 8% was reclassified to the percentage of member of PPF within the pension contribution. In this way, the percentage of member of PPF was changed from 1,5% to 9,5% and the percentage of PPF membership fee was changed from 8% to 0%.
We couldn’t say the same thing in case of the year 2011 because there wasn’t any regrouping but the percentage of pension contribution was increased by 0,5% in both cases (ignoring the private pension fund membership) [1], [3], [5].
TABLE VIII.
INSURED PEOPLE’S CONTRIBUTIONS IN 2011
Distribution of payable contributions that are paid by insured people (from January 1, 2011 to
December 31, 2011) Pension
contribution Private pension fund (PPF) membe rship
fee
Health insurance and labour market contribution Not a
mem ber of a PPF
Mem ber of a PPF
Health insuran
ce contrib ution in
kind
Health insura
nce contri bution
in cash
Labou r market contrib
ution
10% 10% 0% 4% 2% 1,5%
C. Income, Proceeds, Cost
Non-recognized costs are wages paid in excess of twice of the minimum wage’s daily amount that is paid for the employee who is applied under simplified employment.
The amount that the private pension fund doesn’t pay as pension service isn’t taken into account for income calculation.
Not changed:
Any cost is taken into account once up to the revenue (except self-employed people and small agricultural producers). Costs of devices and services that are required for work activities and located in outside the individual’s home are eligible [1], [3], [5].
D. Consolidated Tax Base, Tax Base Supplement Former allowances that don’t carrying tax burdens (e.g. pension, child care benefit) aren’t taken into account when determining the consolidated tax base.
Not changed:
Tax base is defined with „grossing” from certain income that is belongs to the consolidated tax base (Income x 1,27).
78% of the proceeds are taken into account as income if the individual is bound to pay social security contributions or health care contribution (proceeds are from abroad or proceeds aren’t from a payer) after the income. There is an exception when the contributory accounts these burdens as costs.
These are fallen under tax liability:
1. Income that is from self-employment.
2. Income that isn’t from self-employment.
3. Other income.
4. Income of self-employed people and small agricultural producers by flat tax.
Tax base: (1+2+3+4) x1,27.
Income from abroad isn’t part of the tax base if it isn’t taxable in other states [1], [3], [5].
E. Total Annual Income
Income that is come from in connection with property rights (establishment, transfer, abolition, permanent waiver), amount that paid under court order, interim dividend (it’s counted in the year when it becomes dividend) don’t have to be counted in the total income [1], [3], [5].
F. Changes of the Family Discount TABLE IX.
ANNUAL AMOUNT OF THE FAMILY DISCOUNT IN 2010 Ben.
deps.
Income Threshold (HUF)
100% Annual Discount
(HUF)
3 7.620.000 4000 x 3 x 12 =
144.000 4 7.620.000 + 635.000 =
8.255.000
4000 x 4 x 12 = 192.000 5 8.255.000 + 635.000 =
8.890.000
4000 x 5 x 12 = 240.000 6 8.890.000 + 635.000 =
9.525.000
4000 x 6 x 12 = 288.000 7 9.525.000 + 635.000 =
10.160.000
4000 x 7 x 12 = 336.000 Above
7 10.160.000 4000 x Ben.
dependents x 12 Monthly amount of the family discount in 2011:
• In case of 1-2 beneficiary dependents:
62.500 HUF x Beneficiary dependents
• In case of 3 or more beneficiary dependents:
206.250 HUF x Beneficiary dependents [1], [3], [5].
III. CHANGES OF TAX LAW (2011-2012) A. The Tax Rate
TABLE X.
THE TAX RATE IN 2012 2012 16%
The consolidated tax base is the income’s increased amount with the tax base supplement.
Amount of tax base supplement:
-Isn’t calculated for the income under 2.424.000 HUF that belongs to the consolidated tax base, -Is calculated with 27 percent for the exceeding
part of the income (above 2.424.000 HUF) that belongs to the consolidated tax base.
It’s still uniformly 16%, only the tax base supplement is changed. As a result of this, supplement isn’t concerned to everyone, only those who have an income that is above 2.424.000 HUF [4], [5].
B. Contributions
TABLE XI.
INSURED PEOPLE’S CONTRIBUTIONS IN 2012[4],[5].
Distribution of payable contributions that are paid by insured people (from January 1, 2012)
Pension
contribution Private pension fund (PPF) membe rship
fee
Health insurance and labour market contribution Not a
mem ber of a PPF
Mem ber of a PPF
Health insuran
ce contrib ution in
kind
Health insura
nce contri bution
in cash
Labou r market contrib
ution
10% 10% 0% 4% 3% 1,5%
C. Tax Credit
Tax credit is no longer available to anyone from January 1, 2012. As a tax-reducing item, tax base supplement is terminated but the elimination of tax credit means tax rising. But there is a problem, because wealthier people tax fewer than is was earlier (tax base supplement has not such a high rate and tax credit wasn’t a big amount for them, but it was for people who are living from the minimal wage) [4], [5].
IV. NUMERICAL EVALUATION OF THE CHANGES (2010-2011-2012)
A. Changes of Minimal Wages TABLE XII.
AMOUNT OF GUARANTEED MINIMAL WAGES FROM 2011 TO 2012 Guaranteed minimal wages
From To Amount
January 1, 2011
December 31,
2011 94.000 HUF
January 1,
2012 108.000 HUF
Guaranteed minimal wage is for employees who are employed in a full-time job in a position which requires at least a secondary education level or some kind of secondary qualification.
TABLE XIII.
AMOUNT OF MINIMAL WAGES FROM 2010 TO 2012 Minimal wages
From To Amount
January 1, 2010
December 31,
20010 73.500 HUF
January 1, 2011
December 31,
2011 78.000 HUF
January 1,
2012 93.000 HUF
It is worth to see the changes of the minimal wages. To help people who are living from the minimal wage the state increased it with 15.000 HUF from January 1, 2011 to January 1, 2012. On the contrary the state eliminated the tax credit which was essential for them.
You could rightly say that “OK, but they aren’t covered by the tax base supplement”. Well, is this enough for the living in a month or do they get even less salary? Let’s see [5].
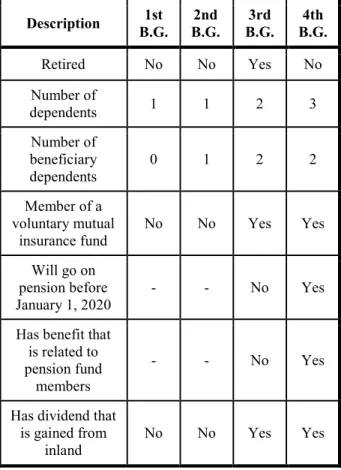
B. Characteristics of Individuals, Related Benefits TABLE XIV.
CREATED BENEFIT GROUPS THAT ARE RELATED TO INDIVIDUALS
Description 1st B.G.
2nd B.G.
3rd B.G.
4th B.G.
Retired No No Yes No
Number of
dependents 1 1 2 3
Number of beneficiary dependents
0 1 2 2
Member of a voluntary mutual
insurance fund
No No Yes Yes
Will go on pension before January 1, 2020
- - No Yes
Has benefit that is related to pension fund
members
- - No Yes
Has dividend that is gained from
inland
No No Yes Yes
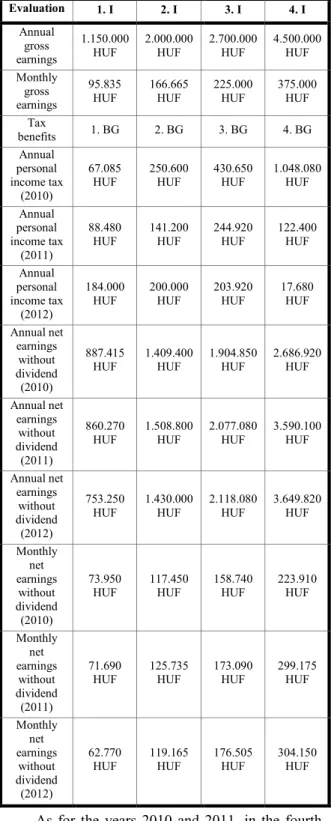
C. Evaluation
As for the years 2010 and 2011, it’s worth a visit to see the two extremes for the first and fourth individuals and stress the main differences between them. In the first individual’s case the personal income tax’s rate is higher because there is no beneficiary dependent in the family. Although the calculated tax was counted with 17% in 2010, but the maximum monthly amount of tax credits are become lesser with 3.000 HUF in 2011.
Accordingly for those who didn’t have family allowance in 2010 and 2011 too, theirs net earnings have become significantly less for 2011 at all.
TABLE XV.
SUMMARY TABLE FOR INCOME’S TAX IN 2010/2011/2012
Evaluation 1. I 2. I 3. I 4. I
Annual gross earnings
1.150.000 HUF
2.000.000 HUF
2.700.000 HUF
4.500.000 HUF Monthly
gross earnings
95.835 HUF
166.665 HUF
225.000 HUF
375.000 HUF Tax
benefits 1. BG 2. BG 3. BG 4. BG Annual
personal income tax
(2010)
67.085 HUF
250.600 HUF
430.650 HUF
1.048.080 HUF Annual
personal income tax
(2011)
88.480 HUF
141.200 HUF
244.920 HUF
122.400 HUF Annual
personal income tax
(2012)
184.000 HUF
200.000 HUF
203.920 HUF
17.680 HUF Annual net
earnings without dividend (2010)
887.415 HUF
1.409.400 HUF
1.904.850 HUF
2.686.920 HUF
Annual net earnings
without dividend (2011)
860.270 HUF
1.508.800 HUF
2.077.080 HUF
3.590.100 HUF
Annual net earnings
without dividend (2012)
753.250 HUF
1.430.000 HUF
2.118.080 HUF
3.649.820 HUF
Monthly net earnings
without dividend (2010)
73.950 HUF
117.450 HUF
158.740 HUF
223.910 HUF
Monthly net earnings
without dividend (2011)
71.690 HUF
125.735 HUF
173.090 HUF
299.175 HUF
Monthly net earnings
without dividend (2012)
62.770 HUF
119.165 HUF
176.505 HUF
304.150 HUF
As for the years 2010 and 2011, in the fourth individual’s case the paid tax have become significantly lower in 2011 than it was in 2010.
This radical change was caused by the individual’s high earnings because the individual ought to tax a lot like the previous year. The individual has got so many discounts for the 2 beneficiary dependents because of the current family allowance in 2011. In this way the individual could pay tax lesser with more than 900.000 HUF and net earnings have become more with the same percentage than they
were in 2010. It’s clearly seen from the table that individuals are associated more positively in connection with their gross earnings from the year 2010 to 2011 who basically have high salary and at least there is one beneficiary dependent in the family so family allowance is paid for them.
As for the years 2011 and 2012, interestingly, the first individual’s annual personal income tax is doubled despite the fact that individual is living in the edge. This because family discount isn’t applied for that individual and lost more with the elimination of tax credit than winning with the terminated tax base supplement. In case of the others we could say that annual personal income tax shows a downward trend. What’s more, we can see the greatest reduction in case of the 4th individual because of the family discount and the terminated tax base supplement which has such a weaker effect on the individual than it has about the 1st individual.
The 4th individual has more salary with almost 1.000.000 HUF than two years ago.
Figure 1. Costs after wages in Europe (2011) [6].
Unfortunately, annual net earnings show a decreasing trend in our country in the poorer people’s case. The middle financial layer is about to disappear. As for the wealthier people, they pay less tax than earlier because of the related benefits and they can realise more salary.
REFERENCES [1] HVG ADÓ 2010. Special Issue [2] Bdtf.hu
http://www.bdtf.hu/ttk/mszi/gazdasag/Dokumentumok/Hus z%C3%A1r%20Lilla%20P%C3%A9nz%C3%BCgytan%2 0III/p%C3%BC%20III%203%20ea%201%20SZJA.pdf [3] HVG ADÓ 2011. Special Issue
[4] HVG ADÓ 2012. Special Issue [5] Nav.hu
http://nav.gov.hu/nav/szolgaltatasok/adokulcsok_jarulekme rtekek
http://www.nav.gov.hu/nav/ado/jarulek/minimalber.html http://nav.gov.hu/egyeni/nav/ado/szja/inf_fuz03.html?page num=2&classname=EgyeniPortlet&allinheading=1_1230&
keywords=E1,E2,E3 [6] Ecostat.hu