1 Redox control of miRNAs and their targets in wheat
Jie Cao1a, Zsolt Gulyás2a, Balázs Kalapos2,3, Ákos Boldizsár2, Xinye Liu1, Magda Pál2, Yingyin Yao1,Gábor Galiba2,3, Gábor Kocsy2*
1State Key Laboratory for Agrobiotechnology and Key Laboratory of Crop Heterosis and Utilization, China Agricultural University, No. 2 Yuanmingyuan West Road, Haidian District, Beijing, China
2Agricultural Institute, Centre for Agricultural Research, Hungarian Academy of Sciences, 2462 Martonvásár, Brunszvik str. 2., Hungary
3Festetics Doctoral School, Georgikon Faculty, University of Pannonia, 8360 Keszthely, Deák Ferenc str. 16., Hungary,
aThese authors contributed equally to this work.
*Corresponding author, e-mail: kocsy.gabor@agrar.mta.hu, phone number: +3622569501 e-mail addresses of the other authors:
JC: cao2014jie@163.com ZG: gulyas.zsolt@agrar.mta.hu BK: kalapos.balazs@agrar.mta.hu ÁB: boldizsar.akos@agrar.mta.hu XL: 419405014@qq.com
MP: pal.magda@agrar.mta.hu YY: yingyin@cau.edu.cn GG: galiba.gabor@agrar.mta.hu
Date of submission:
Number of figures: 10
Figures should be colour in print: Fig. 1, Fig. 6, Fig. 9 Word count: 7364, max 6500
Number of supplementary figures: 7 Number of supplementary tables: 8
2 Running title: Redox control of miRNAs in wheat
1 2
Highlight 3
A redox-dependent regulatory network of miRNAs and their targets were created using 4
sequencing results, bioinformatics tools and correlation analysis of the examined biochemical 5
and molecular parameters in wheat.
6 7
Abstract 8
Possible redox control of miRNAs was investigated in wheat. One-day treatment of seedlings 9
with 10 mM H2O2 resulted in decreased glutathione content and increased half-cell reduction 10
potential of the glutathione disulphide/glutathione redox pair and greater ascorbate peroxidase 11
activity compared to the control plants. These changes were accompanied by alterations in the 12
miRNA transcript profile, since 70 miRNAs with at least 1.5-fold difference in their 13
expression between control and treated (0, 3, 6 h) seedlings were identified. Their 86 target 14
genes were determined by degradome sequencing and 6808 possible additional target genes 15
were identified by bioinformatics tools. The H2O2-responsiveness (24 h treatment) of 1647 16
targets was also confirmed by transcriptome analysis. They are mainly related to the control 17
of redox processes, transcription and protein phosphorylation and degradation. In a time- 18
course experiment (0, 1, 3, 6, 9, 12, 24 h treatment) a correlation was found between the 19
levels of glutathione, other antioxidants and the transcript levels of the H2O2-responsive 20
miRNAs and their target mRNAs. This relationship together with the bioinformatics 21
modelling of the regulatory network indicate the glutathione-related redox control of miRNAs 22
and their targets, which allows the adjustment of the metabolism to changing environmental 23
conditions.
24 25
Key words: Ascorbate, glutathione, hydrogen-peroxide, miRNAs, redox regulation, wheat.
26
Abbreviations: AsA: ascorbic acid, APX: ascorbate peroxidase, CAT: catalase, GR:
27
glutathione reductase, GSH: glutathione, GSSG: glutathione disulphide, GST: glutathione S- 28
transferase, ROS: Reactive oxygen species.
29 30
3 Introduction
31
Reactive oxygen species (ROS) and antioxidants have an important role in the regulation of 32
growth and development both under optimal and stress conditions (Kocsy et al., 2013;
33
Considine and Foyer, 2014; Locato et al., 2018). Among ROS, H2O2 is the most stable ROS, 34
which makes it appropriate for long distance signalling and controlling of various metabolic 35
processes at the level of gene expression and protein activity (Foyer et al., 1997; Neill et al., 36
2002; Hossain et al., 2015). Consistent with this hypothesis, increased H2O2 in catalase- 37
deficient Arabidopsis thaliana (L.) Heynh. mutants resulted in the induction of genes related 38
to the regulation of stress response, metabolism, development and energy homeostasis 39
(Vandenabeele et al., 2004). In H2O2-treated Arabidopsis, altered expression of genes 40
encoding proteins involved in the transcription, signal transduction, protein transport, energy 41
homeostasis, cellular organisation and defence processes was observed by microarray analysis 42
(Desikan et al., 2001). Similarly to Arabidopsis, genes involved in cell defence, signal 43
transduction and metabolism (carbohydrates and lipids) were also affected by H2O2 treatment 44
in wheat (Li et al., 2011). Besides these genes, the expression of redox homeostasis- and 45
photosynthesis-related genes also changed in wheat. By a proteomic approach, the effect of 46
exogenous H2O2 on most of these processes was also shown in rice (Wan and Liu, 2008).
47
Besides its effect on the total amount of proteins, H2O2 may also regulate their activity due to 48
the oxidation of the Cys residues. The amount of H2O2 is regulated by the ascorbate- 49
glutathione (AsA-GSH) cycle which is composed of both enzymatic and non-enzymatic 50
components affecting indirectly the H2O2-dependent physiological processes (Roach et al., 51
2018). Recently, the direct regulatory role of AsA and GSH was shown to modify the 52
development of reproductive organs and tolerance to low temperature through their effect on 53
redox system and gene expression (Gulyás et al., 2014).
54
Similarly to the AsA-GSH cycle, microRNAs (miRNAs) are also important in the 55
control of development (Kidner and Martienssen, 2005; Rubio-Somoza and Weigel, 2011) 56
and stress response (Phillips et al., 2007; Khraiwesh et al., 2012; Rajwanshi et al., 2014).
57
They can control the expression level of their target genes transcriptionally by DNA 58
methylation and post-transcriptionally by cleavage or translational inhibition of target 59
mRNAs. Many of the target genes of miRNAs encode transcription factors; therefore, one 60
miRNA is able to regulate indirectly a whole set of genes. miRNAs have a pleiotropic effect 61
in the control of development, but one target gene may also be regulated by more miRNAs 62
(Kidner and Martienssen, 2005). They are components of regulatory networks that coordinate 63
4 gene expression programs ensuring developmental plasticity (Rubio-Somoza and Weigel, 64
2011). Such network was described for developmental phase transitions, leaf senescence, cell 65
proliferation and leaf polarity; furthermore the interconnection of miRNA-dependent 66
regulatory networks has also been suggested under both biotic and abiotic stresses (Rajwanshi 67
et al., 2014). In wheat, many miRNAs related to development and stress response were 68
discovered (Yao and Sun, 2012) either by computational approach (Dryanova et al., 2008) or 69
by next generation sequencing (Sun et al., 2014). Although miRNAs are evolutionarily 70
conserved, several monocot- or wheat-specific miRNAs were described. By surveying 71
miRNA profile in 11 different tissues, 323 novel miRNAs (belonging to 276 families) and 72
524 targets for 124 miRNAs were identified in a recent study of wheat (Sun et al., 2014).
73
When the redox regulation of miRNAs was studied in rice, 7 H2O2-responsive miRNAs were 74
identified that are involved in transcriptional regulation, nutrient transport, auxin homeostasis, 75
cell proliferation and programmed cell death (Li et al., 2011). In Brachypodium distachyon 76
(L.) P. Beauv. 61 H2O2-responsive miRNAs were determined the target of which were related 77
to development, reproduction, response to stress, secondary metabolism, catabolic processes, 78
nucleic acid metabolism and cellular component organization (Lv et al., 2016).
79
The aim of the present study was to find out whether the effect of H2O2-induced 80
oxidative stress on miRNAs and their target genes is mediated by the GSH and other 81
antioxidants in wheat. For these purpose the determination of the H2O2-reponsive miRNA and 82
target mRNA profiles and regulatory networks were planned. The proposed relationship 83
between the various antioxidants and the levels of several miRNAs and their targets were 84
checked in a time course experiment.
85 86
Materials and methods 87
Plant material and treatments 88
Seeds of the wheat variety Triticum aestivum L. ssp. aestivum cv. Chinese Spring (CS) were 89
germinated in Petri dishes (1 day at 25°C, 3 days at 4°C, 2 days at 25°C). Seedlings were 90
grown on half-strength modified Hoagland solution with a photoperiod of 16 h, at 260 µmol 91
m-2 s-1, 22 °C and 75% RH in a growth chamber (Conviron PGV-15; Controlled Env., Ltd., 92
Winnipeg, Canada) (Kocsy et al., 2000). After 10 days of growth (2-leaf developmental 93
stage), 10 mM H2O2 was added to the nutrient solution and sampling was done after 0- (8 h 94
light), 1- (9 h light), 3- (11 h light), 6- (14 h light), 9- (1 h dark), 12- (4 h dark) and 24-hour (8 95
h light) treatments. The first sampling of leaves was performed in the middle of the 16-hour 96
5 light period in order to exclude the possible rapid changes that might occur in certain 97
examined parameters just after switching on the light. Besides the collection of leaf samples 98
(2nd leaves from the basis of the stem) for biochemical and molecular biological analysis, the 99
fresh and dry weights of the shoots and roots were also determined.
100 101
Measurement of H2O2 content 102
H2O2 content of the leaves was measured by FOX1 method using a spectrophotometer in a 103
colorimetric reaction as described in a previous study (Kellős et al., 2008). During this 104
reaction ferrous ion is oxidised to ferric ion by H2O2 and the ferric ion is detected by xylenol 105
orange.
106 107
Determination of AsA 108
Leaf samples of 500 mg fresh weight were ground with liquid nitrogen in a mortar and 109
extracted with 3 ml of 5% meta-phosphoric acid. In the supernatant, reduced and total AsA 110
(the latter reduced by dithiothreitol) contents were determined by HPLC using an Alliance 111
2690 system equipped with a W996 photodiode array detector (Waters, Milford, MA, USA).
112
The concentration of dehydroascorbate (DHA), a two-electron oxidized form of AsA was 113
estimated by subtracting the reduced portion from the total AsA pool (Szalai et al., 2014).
114
115
Analysis of cysteine and glutathione 116
The leaves were ground with liquid nitrogen in a mortar, after which 1ml of 0.1 M HCl was 117
added to 200 mg plant sample. The total cysteine and glutathione pools (reduced + oxidised 118
forms) were determined after reduction with dithiothreitol and derivatisation with 119
monobromobimane (Kocsy et al., 2000). For the detection of cystine and glutathione 120
disulphide (GSSG), cysteine and GSH were blocked with N-ethylmaleimide, after which the 121
excess of N-ethylmaleimide was removed with toluol (Kranner and Grill, 1996). Cystine and 122
GSSG were reduced and derivatised as described for total cysteine and glutathione pools. The 123
two thiols were analysed by an Alliance 2690 HPLC system using a W474 scanning 124
fluorescence detector (Waters, Milford, MA, USA). The amount of reduced thiols was 125
6 calculated as the difference between the amount of total and oxidised thiols. The half-cell 126
reduction potential of the thiol redox couples was calculated by the Nernst equation (Schafer 127
and Buettner, 2001).
128 129
Analysis of the activity of the antioxidant enzymes 130
The activities of catalase (CAT, EC 1.11.1.6; basis: reduction of H2O2), ascorbate peroxidase 131
(APX, EC 1.11.1.11; basis: reduction of H2O2 by AsA), glutathione reductase (GR, EC 132
1.6.4.2; basis: reduction of GSSG by NADPH and reaction of the produced GSH with 5-5′'- 133
dithio- bis (2-nitrobenzoic acid)) and glutathione S-transferase (GST, EC 2.5.1.18; basis:
134
reaction of GSH with 1-chloro-2,4-dinitrobenzene) were determined in the leaves by 135
spectrophotometer using a colorimetric method as described previously (Soltész et al., 2011).
136
The extraction buffer contained 1 mM AsA in order to avoid the inactivation of chloroplastic 137
APX as suggested by Noctor et al. ( 2016).The protein content was measured using Bradford- 138
reagent (Bradford, 1976) according to Soltész et al., (2011).
139 140
Small RNA sequencing 141
Total RNA was isolated from the leaves of plants treated for 0-, 3- and 6-h with 10 mM H2O2
142
using the TRIzol reagent (Invitrogen, USA) according to the manufacturer’s instructions. All 143
small RNA libraries prepared for this study according to Sun et al. (2014) were sequenced 144
with Illumina Hiseq 2000, generating approximately 10 M data for each sample. Low-quality 145
reads and portions of reads were removed using sickle program 146
(https://github.com/najoshi/sickle) with the parameters “-q 20 -f sanger -l 20”. The cutadapt 147
program (Martin, 2011) was used to trim the 3’ adaptors from reads (parameters “ - 148
CTGTAGGCACCATCAATCAG - match-read-wildcards -m15 ”), and only the reads ranging 149
from 18 to 30 nucleotides were collected. Reads were then aligned to the Rfam 10.0 RNA 150
family database (Griffiths-Jones et al., 2003; Griffiths-Jones, 2004; Nawrocki et al., 2015) 151
with bowtie2 (Langmead and Salzberg, 2012) and known cellular structural RNAs, such as 152
rRNAs, tRNAs, snoRNAs, and snRNAs were removed based on their alignments using in- 153
house Perl script. The remaining reads were mapped to wheat microRNAs (Sun et al., 2014) 154
collected and characterised by BLASTN and allowing no mismatches. The miRNA frequency 155
7 was normalised as "transcripts per million” (TPM), and the expression was set to 0.01 for 156
miRNAs that were not expressed in one of the samples after normalisation.
157
Following the first filtering for reliability, the differentially expressed miRNAs were 158
obtained by Bayes-based Poisson Distribution Test (Audic and Claverie, 1997) with 159
difference >1.5 times and sequencing reads >10 in at least one sample.
160 161
Analysis of miRNAs by qRT-PCR 162
Total RNA was isolated from frozen leaves using Trizol (Invitrogen, USA). The Mir-X 163
miRNA First-Strand Synthesis Kit (Clontech Laboratories, Inc) and SYBR Premix EX Taq II 164
(TaKaRa, Dalian, China) were used for miRNA reverse transcription and qRT-PCR according 165
to the manufacturer’s instructions. qRT-PCR was performed on the CFX96 Real Time System 166
(BIO-RAD, USA) with the following program: denaturation at 95°C for 3 min, and then 167
subjected to 40 cycles of 95°C for 15 s, 60°C for 15 s, 72°C for 10 s. The entire sequence of 168
the mature miRNA (21–23 nt) was used as a miRNA-specific 5’ primer. The 3’ primer for the 169
qPCR was the mRQ 3’ primer supplied with the kit. The relative expression of miRNA was 170
calculated using the 2-ΔCT method normalised to wheat ACTIN gene CT value. For each 171
sample, the PCR amplification was repeated three times, and the average values of 2-ΔCT were 172
used to determine the differences of gene expression by the Student’s t-test. Three biological 173
replications were performed with similar results and one replicate was shown.
174 175
Degradome sequencing 176
Total RNAs obtained from leaves taken after 0 h, 3 h and 6 h H2O2 treatment were mixed 177
equally for degradome sequencing to see which miRNA targets are cleaved at any time point.
178
The degradome library was constructed briefly as followed: annealing of approximately 150 179
ng poly(A)-enriched RNA with Biotinylated Random Primers; Strapavidin capture of RNA 180
fragments through Biotinylated Random Primers; 5′PARE adaptor ligation to only those 181
containing 5-monophosphates; first-strand cDNA was generated from the ligated sequence 182
after reverse transcription using random hexamer 3′ primer; a number of DNA products were 183
produced by PCR amplification. The library was single-end sequenced using an Illumina 184
Hiseq2500 platform at the LC-BIO (Hangzhou, China) following the vendor’s recommended 185
8 protocol. CleaveLand 3.0 (Addo-Quaye et al., 2009) was used for analysing sequencing data.
186
The raw data of degradome sequencing have been submitted to the NCBI GEO datasets under 187
the accession number SRP127561.
188
Investigation of the target mRNAs of miRNAs by qRT-PCR 189
Total RNA was extracted from the leaves with TRI Reagent (Sigma) according to the 190
manufacturer’s instructions, and the samples were treated with DNase I enzyme (Promega).
191
Reverse transcription was performed using M-MLV Reverse Transcriptase and Oligo(dT) 15 192
primer (Promega) according to the manufacturer’s instructions. The expression level of the 193
target genes was determined by real-time RT-PCR using recently planned primers (Table 194
S1A). The reactions were run on a CFX96 Real-Time PCR instrument (Bio-Rad) and the 195
relative fold change (FC) values were calculated according to (Boldizsár et al., 2016).
196 197
Computational prediction and analysis of miRNA targets 198
The targets of the H2O2-induced miRNA collection were predicted with the psRNA Target 199
tool (http://plantgrn.noble.org/psRNATarget/). To confirm the degradome sequencing results 200
and to determine additional target genes the EnsemblPlants 31 release of wheat nucleotide 201
sequences were used as query cDNA library and the default scoring schema were used with 202
the following parameters: (1) # of top targets=200; (2) Penalty for G:U pair=0.5; (3) Extra 203
weight in seed region=1.5; (4) # of mismatch allowed in seed region=2; (5) Allow bulge 204
(gap) on target=enabled; (6) Penalty for opening gap=2; (7) Calculate target 205
accessibility=disabled; (8) Translation inhibition rate=10-11 NT; (9) Expectation=5; (10) 206
Penalty for other mismatches=1; (11) Seed region=2-13 NT; (12) HSP size=19; (13) Penalty 207
for extending gap=0.5.
208
MapMan (Thimm et al., 2004) (https://mapman.gabipd.org/) and KEGG 209
(http://www.genome.jp/kegg/) pathway database were used for annotation of the miRNA 210
target genes. In addition, custom Blastx search was performed against the UniProt protein 211
database (http://www.uniprot.org/downloads) and the predicted miRNA targets using a 212
Geneious software version 9.8.1 (Biomatters, New Zealand; http://www.geneious.com).
213
The functional annotations were extended with gene expression data using an 214
oligonucleotide-based microarray (E-MTAB-6627:
215
9 https://www.ebi.ac.uk/arrayexpress/experiments/E-MTAB-6627/). Preparation of Cy5- and 216
Cy3-labelled cDNA using RNA isolated from the control and H2O2-treated samples, 217
respectively, and microarray hybridisation to a stress-specific 15k wheat oligonucleotide 218
microarray (Szűcs et al., 2010) were performed as described (Szécsényi et al., 2013). An 219
Agilent scanner (Agilent, Santa Clara, CA, USA) was employed for microarray scanning and 220
data collection as described previously (Kalapos et al., 2016). The validation of microarray 221
was done by qRT-PCR as described for the target mRNAs of miRNAs and the primers are 222
listed in Table S1B.
223
The pathway map of the miRNAs and their target genes were build and visualized 224
using the yEd graph editor version 3.18.0.2 (yWorks, Germany;
225
https://www.yworks.com/products/yed).
226 227
Statistical analysis 228
Biochemical data from three independent experiments involving three biological repetitions 229
each were evaluated, and standard deviations are indicated in the figures. The statistical 230
analysis was prepared using one-way ANOVA and a least significant difference test or a 231
Dunnett T3 non-parametic test (if any condition had not been fulfilled) (SPSS program). The 232
homogeneity of variances was tested by Levene’s test. The relationships between the various 233
parameters were checked by correlation analysis (Excel program).
234 235
Results 236
237
Growth parameters 238
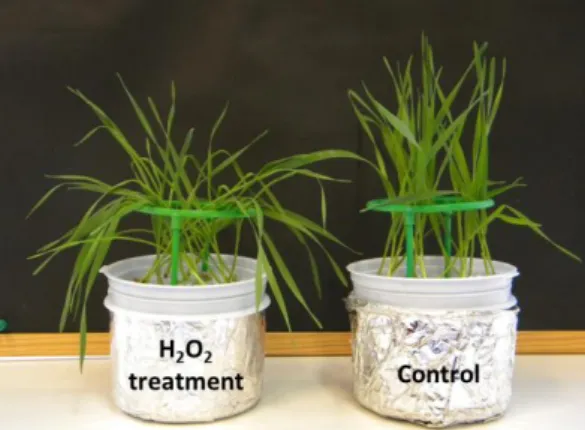
Treatment with H2O2 resulted in a transient wilting and rolling of the leaves after 1 h (Fig. 1).
239
After 2 h treatment the leaves of the treated plants recovered and were similar to the untreated 240
ones. However, the fresh and dry weight and the dry weight/ fresh weight ratio of the shoots 241
and roots were not affected by the H2O2 treatment (Fig. S1).
242 243
Effect of H2O2 treatment on the non-enzymatic components of the AsA-GSH cycle 244
10 Despite the visible effect of H2O2 on the plants after 1 h, there was no difference in H2O2
245
content between control and treated plants (Fig. 2). Subsequently a slight, gradual increase 246
was observed in the H2O2 content during the one-day long experiment in the leaves of both 247
untreated and H2O2-treated plants resulting in significant differences in certain sampling 248
points compared to the starting value.
249
The amount of DHA and the DHA/AsA ratio greatly decreased in the control and treated 250
leaves (to 50% or lower values compared to the starting value) while the amount of ASA and 251
the redox potential of the DHA/AsA redox couple did not change during the experiment 252
except for AsA in the control leaves after 24 h (Figs. 3A and 3B).
253
The concentration of GSH greatly increased after 3 h and remained nearly at this level until 254
the 6-hour sampling in control plants and decreased after 6 h in the leaves of the treated 255
seedlings compared to the starting value, which resulted in great differences between them 256
(Fig. 4A). After the H2O2 treatment, its minimum values were detected in the dark. The GSSG 257
concentration significantly increased at all sampling points under control conditions and after 258
3 h H2O2 treatment compared to the starting value. The GSSG/GSH ratio was greater both in 259
the control and treated seedlings than its initial value throughout the experiment. The half-cell 260
reduction potential of the GSSG/2GSH pair had a great increase after 6 h H2O2 treatment and 261
further on (Fig. 4B). In contrast to GSH, the amount and redox state of its precursor, cysteine 262
was not or only slightly affected by H2O2 (Fig. S2). The cysteine concentration was greater 263
only after 24 h in the control seedlings. The cystine content increased in untreated leaves and 264
remained unchanged in the treated ones except for the 3 h sampling compared to the starting 265
value. The cystine/cysteine ratio varied between 17.2 and 25.5% and the half-cell reduction 266
potential of this redox couple did not change during the whole experiment in both groups of 267
plants.
268 269
Effect of H2O2 on the activity of antioxidant enzymes 270
The activities of the antioxidant enzymes are given on a protein basis. Concentration of 271
protein did not change during the one-day experiment and was not affected by the H2O2
272
treatment (Fig. S3). The activity of CAT involved in the degradation of H2O2 increased both 273
in the control and treated seedlings during the experiment, and it returned to the starting value 274
after 24 h in the control seedlings, but remained high in the treated ones (Fig. 5A). However, 275
the activity of APX, removing H2O2 in the AsA-GSH cycle increased even after 1 h treatment 276
and was significantly greater compared to the starting value throughout the experiment while 277
11 such difference was observed for the control plants only after 3 and 12 h (Fig. 5B). The 278
activity of GR, which is also an enzymatic component of the AsA-GSH cycle like APX, 279
increased by 50% in both group of plants during the experiment and, after 24 h, it returned to 280
the initial value in the control seedlings but not in the treated ones (Fig. 5C). The activity of 281
GST, involved in the detoxification of xenobiotics and peroxides through catalysing their 282
conjugation with GSH, exhibited a similar tendency of changes as GR (Fig. 5D). However, 283
the increase in the activity in most sampling points (3, 6, 9, 12 h) compared to the starting 284
value and the difference between the control and treated seedlings after 24 h was greater, 285
about 2-fold.
286 287
Determination of the H2O2-responsive miRNAs 288
Small RNA sequencing was performed with samples collected after 0, 3 and 6 h treatment 289
repeated in 2 parallels, which means 6 sequencing in total. After removing the low-quality 290
and contaminant (length less than 18 nt or more than 30 nt reads) reads, 63.4 million reads 291
were obtained in total and among them 11.6 million were mapped as unique ones (Table S2).
292
The length distribution of the various small RNAs was similar in the different samples (Fig.
293
S4). The proportion of redundant reads was the highest (25%) for the 21 and 24 nt long 294
sequences and the proportion of unique sequences was the highest (60%) for the 24 nt long 295
sequences.
296
We determined the differential expression of known wheat miRNAs (Sun et al., 2014) 297
between H2O2-treated and control seedlings. We found that a total of 70 miRNAs had a 298
minimum 1.5-fold difference between control and H2O2-treated seedlings and they formed 7 299
groups on the basis of the time-course of changes in their expression after 3 and 6 h treatment 300
compared to the starting value (Fig. 6). A transient increase was detected in the expression of 301
6 miRNAs after 3 h (group I), while the transcript level of 18 miRNAs (group V) remained 302
also high after 6 h. The expression of 7 miRNAs (group II) decreased transitionally after 3 h 303
and that of 6 miRNAs (group VII) was low after 6 h, too. Among the miRNAs the amount of 304
which exhibited no or slight changes during the first 3 hours of the treatment, the expression 305
of 21 (group III) and 10 (group IV) increased and decreased after 6 h, respectively.
306
Interestingly, the transcript level of 2 miRNAs (group VI) was lower after 3 h and higher after 307
6 h compared to the value detected before the H2O2 treatment.
308
12 The transcript levels of 8 H2O2-responsive miRNAs with a minimum 2-fold change in 309
their expression after 3 and/or 6 h compared to the starting value based on the sequencing 310
results (Table S3) were further checked in a time-course experiment with 7 sampling points 311
by qRT-PCR (Fig. 7). The tendency of H2O2-induced alterations obtained by the next 312
generation sequencing after 3 and 6 h treatment was confirmed by these measurements (for 313
tae-miR3106a and tae-miR3523a only in comparison with the starting value as done by the 314
sequencing) and tae-miR2007a, tae-miR3147a and tae-miR3523a were already induced after 315
1h H2O2 treatment. Without treatment, the expression of the selected miRNAs exhibited a 316
daily pattern: in several cases with higher levels during the light period and lower ones during 317
the night (Figs. 7A, 7C, 7F and 7H). This pattern was modified by the H2O2 treatment. The 318
miRNAs’ levels were at least 2-fold greater after 24 h H2O2 treatment compared to the control 319
values except for miR3106a having a 50% decrease in its expression. For tae-miR2007a, tae- 320
miR818h and tae-miR3074a this difference was 9-fold or greater. The miRNA levels were 321
minimum 4-fold greater for miR3106a after 3 h and 12 h and for miR3074a after 1 h in 322
control seedlings compared to the treated ones in the same sampling point.
323 324
Identification of the target genes of the H2O2-responsive miRNAs 325
In order to determine those target genes of the H2O2-responsive miRNAs whose products are 326
cleaved in our experimental system, RNAs obtained from samples taken after 0h, 3h and 6h 327
H2O2 treatment were mixed equally for degradome sequencing. In this analysis 13.5 million 328
raw reads were obtained and after the data analysis 160,466 covered cDNA sequences could 329
be identified (Table S3). Based on the degradome sequencing, 86 unique target sequences of 330
28 H2O2-responsive miRNAs could be identified. For 29 target genes, the H2O2- 331
responsiveness was also shown by microarray analysis (validated by qRT-PCR, r2: 0.68, Fig.
332
S5) and these genes are related to transcription, redox regulation, protein phosphorylation and 333
degradation (Table S3). Two targets of tae-miR3493b, the genes encoding peroxidase 52 and 334
a thioredoxin-like protein, and one target of tae-miR3513a encoding thioredoxin H8 are 335
components of the antioxidant system. Both miRNAs were induced by H2O2 (Fig. 6, group 336
III) and the expression of their targets were repressed as shown by microarray analysis (Table 337
S3).
338
The time-course of changes in the expression of target genes of those 8 H2O2- 339
responsive miRNAs shown in Fig. 7 was also investigated. Similarly, to the corresponding 340
13 miRNAs, the expression of their targets genes also exhibited a daily rhythm in the untreated 341
seedlings, which was altered by H2O2. For several targets the direction of changes was 342
opposite in the control and treated plants, which resulted in great differences between the 343
transcript levels in certain sampling points (Figs. 8A, 8C, 8D, 8H). The expressions were 344
influenced by the treatment already in the first 3 h and the difference between the control and 345
treated seedlings was minimum 2-, but sometimes 10-fold at least in one sampling point for 346
all target genes. Five of the targets were already induced after 1 or 3 h treatment (Figs. 8B, 347
8C, 8F, 8G and 8H), one only after 24 h (Fig. 8E) and two of them were repressed (Figs. 8A 348
and 8D). A moderate negative correlation (r: -0.38 – -0.42) between the expression of the 349
following miRNA and target pairs was found after H2O2 treatment: tae-miR2007A – ribulose- 350
1.5-bisphosphate carboxylase activase, tae-miR3106 – beta-carotene isomerase, tae- 351
miR3523a – glycerol-3-phosphate dehydrogenase. For 3 pairs a low negative correlation and 352
for 2 pairs low positive correlation was observed.
353
Using bioinformatics tools 6808 unique target sequences (from them 86 were 354
identified by degradome sequencing) of 70 H2O2-responsive miRNAs were found (Table S3).
355
The following targets were related to the components of the AsA-GSH system or other 356
antioxidants: tae-miR3369a – a phosphomannomutase involved in AsA biosynthesis, tae- 357
miR3513a– monodehydroascorbate reductase, tae-miR3506b– peroxidase, tae-miR506b – 358
GST, tae-miR3064a, tae-miR3510a, – thioredoxin. For 1647 targets the H2O2-responsiveness 359
was also demonstrated by microarray study (Table S3).
360
Based on their targets, two types of KEGG-analysis of H2O2-responsive miRNAs were 361
prepared using the database available for Brachypodium, a closely relative species to wheat 362
(Table S5, Fig. S6). In the first one, the number of H2O2-responsive miRNAs was compared 363
to the total number of the miRNAs in the individual categories in which the miRNAs were 364
grouped based on their targets. The greatest number of such miRNAs was related to ‘plant- 365
pathogen interaction (bdi04626)’, ‘protein processing in endoplasmatic reticulum 366
(bdi04141)’, ‘carbon metabolism (bdi01200)’, ‘biosynthesis of amino acids (bdi01230)’, 367
‘purine metabolism (bdi00230)’, processes in ‘spliceosome (bdi03040)’ and ‘plant hormone 368
signal transduction (bdi04075)’ (Fig. S6). In the second approach, the number of H2O2- 369
responsive target genes was analysed. The two analyses gave different results since one 370
miRNA may have several target genes and one target gene may be controlled by several 371
miRNAs.
372
14 While the abundance of the H2O2-responsive miRNA in relation to the whole miRNA 373
set in wheat was maximum 10% in the various KEGG-pathway categories (first evaluation 374
approach), this ratio was at least 30% for 45% of target genes (second approach, Fig. S6).
375
Taking into account the 7 greatest groups of categories, the same ones were selected by both 376
approaches except for the ‘purine metabolism (bdi00230)’ by grouping of miRNAs and 377
‘ribosome-related processes (bdi03010)’ by grouping of targets. The enrichment of targets of 378
H2O2-responsive miRNAs in the categories related to AsA and GSH metabolism, peroxisome, 379
proteasome varied between 20-35%.
380
The possible interactions of the identified 70 H2O2-responsive miRNAs with their 381
6808 targets were also analysed (Fig. S7). This network with 9620 connections shows that 382
most miRNAs have several targets, and most of the targets are controlled only by one 383
miRNAs. However, several of them are regulated by two or more miRNAs therefore the 384
miRNAs and their targets form a complex network.
385
In the central part of this network are located tae-miR818b, tae-miR818c, tae- 386
miR818m, tae-miR818k, tae-miR818h, tae-miR3369a, tae-miR3523a and tae-miR3506b (Fig.
387
9) having 233 targets with 1437 connections. In this part of the network tae-miR3369a and 388
members of the tae-miR818 family control the expression of many genes at translational 389
level, while tae-miR3506b and tae-miR3523a does so by cleavage of their target mRNAs 390
(Table S3).Most targets of these 8 miRNAs are involved in transcriptional regulation, protein 391
phosphorylation and degradation (Table S6A). Based on KEGG categories, they were mainly 392
(3-8 targets/ category) related to the processes in spliceosome, biosynthesis of amino acids, 393
protein processing in ER, carbon, purine, starch and sucrose metabolism (Table S6B). Using a 394
microarray analysis, the level and direction of the expression changes of several (1647) H2O2- 395
responsive target genes were also determined (Table S3). From the targets of tae-miR3369a, 396
25 were present on the array and among them the expression of 12 and 6 genes increased and 397
decreased, respectively. It is worth mention that for miR3493b, 16 of the 35 targets and for 398
miR156a, 4 of the 17 targets were also identified by degradome sequencing.
399 400
Discussion 401
402
Effect of H2O2 on the redox environment in the leaves 403
15 Induction of oxidative stress is a common consequence of abiotic stresses. This effect was 404
successfully simulated by H2O2 treatment previously in wheat and maize as shown by the 405
modification of the redox environment (Kellős et al., 2008; Gulyás et al., 2014). Although the 406
effect of H2O2 on the miRNA profile was investigated in rice and Brachypodium, the possible 407
involvement of the AsA-GSH cycle and other antioxidants in the control of miRNA levels 408
was not studied in these experiments (Li et al., 2011; Lv et al., 2016). In the present 409
experimental system, H2O2 treatment efficiently modified the GSH-dependent redox 410
environment and activated the related protective mechanisms in the leaves of wheat seedlings 411
therefor the growth was not affected as shown by fresh and dry weight data. The H2O2- 412
induced transient wilting and rolling of the leaves, as a part of the protection, may be due to a 413
rapid loss of water content by the opening of stomata induced by transient local changes in 414
H2O2 concentration since H2O2 signaling is involved in the control of stomatal movement 415
(Hua et al., 2012). The alterations in the GSH-dependent redox environment are indicated by 416
the decrease in GSH content and increase in EGSSG/2GSH value compared to the untreated 417
control plants. After a 3 h treatment when the first sampling for miRNA sequencing was 418
prepared, the GSH content was by 30% lower in the treated seedlings than in the controls. In 419
contrast to GSH, the AsA concentration and E DHA/AsA value did not change which can be 420
explained by the 3 times greater size of the AsA pool compared to the GSH pool. APX, 421
having an increased activity throughout the H2O2 treatment could successfully decompose the 422
unnecessary H2O2 in plantsderiving from its addition to the nutrient solution. Thus, no change 423
in the endogenous H2O2 concentration was detected in leaf tissue extracts which does not 424
exclude the local changes in its level in specific cells (stomata) and organelles (chloroplasts).
425
However, during the removal of H2O2 in the AsA-GSH cycle, the amount and redox state of 426
GSH also changed in leaf extracts because of its oxidation by GR having increased activity 427
after 24 h treatment. In addition, the larger use of GSH by GST after 24 h for the 428
detoxification of peroxides in the H2O2-treated plants will also reduce the GSH concentration.
429
Besides, APX, CAT also could greatly contribute to the degradation of H2O2 since its activity 430
was greater by 60% after 24 h in the treated seedlings compared to the control ones. The 431
correlations between the expression levels of miRNAs, their target mRNAs and antioxidants 432
(GSH, APX, GST, CAT) in the treated seedlings show the closeness and direction of their 433
relationships (Table S7), The control of miRNAs by GSH was corroborated for miR395 in S- 434
deprived Arabidopsis, since the expression of this miRNA was modified after addition of 435
exogenous GSH or in GSH-deficient mutants (Jagadeeswaran et al., 2014). In addition, tae- 436
miR395 was H2O2-responsive in wheat (present study) and in Brachypodium (Lv et al., 2016).
437
16 These results indicate that the effect of H2O2 on miRNAs is mediated by certain components 438
of the AsA-GSH cycle, which has a central role in the redox regulation (Foyer and Noctor, 439
2011).
440 441 442
Effect of H2O2 on miRNA profiles 443
The H2O2-induced modification of the GSH-dependent redox environment had a great effect 444
on the miRNA profile since a minimum 1.5-fold change was shown by the sequencing results 445
in the expression of 70 miRNAs. Far more miRNAs were upregulated (44) than 446
downregulated (22). Furthermore, some of them (4) was inhibited first (after 3 h) and induced 447
afterwards (after the subsequent 3 h) in wheat. Similarly to wheat, a large number of miRNAs 448
(61) was affected by H2O2 in Brachypodium (Lv et al., 2016) while only 7 in rice (Li et al., 449
2011). The low number of H2O2-responsive miRNAs in rice is surprising, since the 450
developmental stage of seedlings (2-3 leaves), the applied concentration of H2O2 (10-20 mM) 451
and the duration of treatment (2-6 h) were similar in all 3 species. These results indicate the 452
greater sensitivity of the miRNA-related regulatory system to oxidative stress in the 453
phylogenetically nearer wheat and Brachypodium compared to the more distant rice.
454
The ratio of H2O2-responsive miRNAs compared to their total number was very similar 455
(mainly 1:10) within the various KEGG-categories in wheat. Among the categories with the 456
greatest number of H2O2-responsive miRNAs were carbon metabolism, peroxisome- 457
associated reactions including the glyoxylate pathway. These processes are related to the 458
chloroplasts and peroxisomes (Slesak et al., 2007), the major organelles responsible for the 459
production of H2O2 explaining the large number of H2O2-responsive miRNAs in the 460
metabolic pathways occurring in these organelles. Besides the H2O2 formation, peroxisome 461
and chloroplast are also connected to the redox system through the formation of glycine and 462
γ-glutamylcysteine, respectively, since these compounds are precursors of GSH. Two other 463
main KEGG-categories with high number of H2O2-responsive miRNAs were the ‘protein 464
processing in the endoplasmatic reticulum (bdi04141)’ and the ‘proteasome-related 465
degradation of proteins (bdi03020)’. The endoplasmatic reticulum is the main source of H2O2
466
in the cytosol (Slesak et al., 2007), and proteasomes are protein complexes where H2O2- 467
mediated S-glutathionylation of proteins takes place if the cellular redox state shifts (Jung et 468
17 al., 2014). In this process the H2O2-dependent alteration in the ratio of GSH/GSSG may affect 469
the metabolism of proteins by the involvement of miRNAs.
470
Although several H2O2-responsive miRNAs were found in wheat (total H2O2- 471
responsive: 70) and Brachypodium (total H2O2-responsive: 61) (Lv et al., 2016), only two of 472
them, tae-miR160b and tae-miR395a were common between the two plant species (Table S8).
473
Tae-miR395a is involved in sulphate reduction and therefore indirectly in the GSH formation 474
through cysteine; tae-miR160b has auxin-related function. Thus, the basic regulatory 475
processes such as hormonal and redox regulations are conserved between these two species.
476
While no overlap of H2O2-responsive miRNAs was observed between wheat and rice, 477
miR169d, miR827-3p, miR397a and miR408-5p were affected by H2O2 both in 478
Brachypodium and rice (total H2O2-responsive: 7) (Li et al., 2011; Lv et al., 2016). They 479
regulate the genes encoding HAP2-like transcription factor, SPX-domain protein (regulation 480
of phosphate homeostasis), laccase (lignin biosynthesis) and a monosaccharide transport 481
protein, respectively. The limited overlap in H2O2-related miRNAs between the three species 482
indicates the specificity of the miRNAs in the various organisms during the response to 483
environmental changes.
484
Similarly, to H2O2 in wheat, ozone-induced oxidative stress also affected the members 485
of the miR156 family (controlling flowering, yield and leaf initiation) in Arabidopsis (Table 486
S8) (Iyer et al., 2012). However, the members of the other 21 ozone-responsive miRNAs 487
family were not influenced by H2O2 in wheat. Between rice and Arabidopsis, also only one 488
common oxidative stress-responsive miRNA family, the miR169 (target: HAP2-like 489
transcription factor), exists, which is involved in the stress-response (Li et al., 2011; Iyer et 490
al., 2012). Members of miR169 family were also induced by H2O2 in Brachypodium (Lv et 491
al., 2016). In addition, miR160a (target: auxin response factor 22) and miR164 (target:
492
phytoene dehydrogenase) were induced both in Arabidopsis and in Brachypodium by 493
oxidative stress. These experiments indicate that different sets of miRNAs are involved in the 494
response to various oxidants such as H2O2 and O3. In addition, the response of the members of 495
the same miRNA family to the various abiotic stresses in generally also differs in the different 496
plant species. However, some similarities can also be found when comparing the miRNA set 497
induced by oxidative and various abiotic stresses in Arabidopsis (Zhang, 2015; Barciszewska- 498
Pacak et al., 2015). Therefore, it is difficult to describe the involvement of the individual 499
miRNAs in the stress response with a general model. The differences between the plant 500
18 species may be due to the complex regulatory networks of miRNAs in which the role of the 501
individual miRNAs varies between the species.
502
When checking the effect of H2O2 on miRNAs by qRT-PCR in a time course 503
experiment during 1 day, light-dependent daily changes were observed in their levels even in 504
the untreated seedlings, which observation corresponds with the light-responsiveness of 505
miRNAs demonstrated in Brassica rapa (Zhou et al., 2016). A redox control of these light- 506
dependent daily alterations can be supposed since it was modified by H2O2 in wheat. The 507
tendency of changes in the expression of the miRNAs detected by sequencing after 3 and 6 h 508
treatment with H2O2 could be confirmed by qRT-PCR. After 9, 12 and 24 h exposure to H2O2, 509
the expression of those miRNAs also differed very often that were grouped together based on 510
the initial changes after 3 and 6 h H2O2 treatment in their transcription. Only some miRNAs 511
with an increase after 6 h H2O2 treatment (tae-miR3147a, tae-miR3074a) exhibited similar 512
time-course of expression changes after 9, 12 and 24 h of H2O2 addition. The observed large 513
increase in the expression of these 2 miRNAs during the first 6 h was probably due to the 514
additive effect of H2O2 and light, since the transcript levels became far lower in the dark even 515
after 1 h. In contrast, the amount of tae-mir3106a still remained high after 1 h in the dark and 516
it decreased only after 4 h in the treated plants. The effect of light on H2O2-responsive 517
miRNAs is further supported by the fact that the expression of 5 of them increased again in 518
the light after the transient decrease in the dark during the 1-day H2O2 treatment.
519 520
Function of the selected miRNAs based on their target genes 521
By bioinformatics tools we could identify 6808 possible targets for the 70 identified H2O2- 522
responsive miRNAs. However, by degradome sequencing only 86 targets of 28 of them could 523
be determined indicating that only this small set is actually affected by miRNAs after 0, 3 or 6 524
h in our experimental system. This large difference could derive from the possible temporal 525
and spatial shift in the expression changes in miRNAs and their targets and the existence of 526
complex regulatory network including opposite miRNA regulators of the same target 527
(Kawashima et al., 2009; Liang et al., 2014). Thus, a temporal shift in the expression was 528
found for tae-miR3106 and its target, beta-carotene isomerase. Among the target genes 529
determined by degradome sequencing several were related to transcriptional regulation 530
(targets of tae-miR156a, tae-miR3294b, tae-miR3369a, tae-miR3493aa), protein 531
phosphorylation (targets of tae-miR3319b, tae-miR3332a), protein degradation (targets of tae- 532
19 miR3369a, tae-miR818b, tae-miR2001a, tae-miR399b), and redox regulation (targets of tae- 533
miR3493a, tae-miR3513a) and the core part of our regulatory network model was also 534
associated with these processes. The H2O2 responsiveness of these target genes was also 535
confirmed by microarray analysis in wheat. In addition, the KEGG analysis confirmed the 536
enrichment of the target genes of H2O2-responsive miRNAs in the categories related to 537
protein metabolism and redox processes. Although the degradation of few target mRNAs was 538
only checked in Brachypodium and rice (Li et al., 2011; Lv et al., 2016), the effect of H2O2
539
was shown for several redox- and protein decomposition-related proteins in these species, too 540
(Wan and Liu, 2008; Bian et al., 2015). These results are in accordance with those ones 541
obtained in wheat with degradome analysis because of the occurrence of common functional 542
categories such as redox regulation and protein degradation.
543
The present results indicate a feed-back regulation between the redox system and the 544
miRNAs since the H2O2-induced modification of GSH level and APX activity affected 545
several miRNAs the target of which control the levels of redox compounds in wheat (Fig. 10).
546
Thus, by degradome sequencing, three miRNAs (tae-miR3493b – target genes: peroxidase 52 547
and a thioredoxin-like protein; tae-miR3513a – target gene: thioredoxin H8) and by 548
bioinformatics tools, 6 miRNAs were found. This hypothesis was also corroborated in the 549
case of miR395 controlling the synthesis of the GSH precursor, cysteine. It also proved to be 550
H2O2-responsive in Brachypodium (Lv et al., 2016) and its expression depended on the 551
availability of GSH in Arabidopsis (Jagadeeswaran et al., 2014). Besides the indirect control 552
of miRNAs through various antioxidants, H2O2 may also directly affect miRNAs as it was 553
suggested for heavy metals (Min Yang and Chen, 2013). Instead of linear relationships, a 554
network of mutual interactions can be supposed among H2O2, other redox compounds, 555
miRNAs and metabolism which allows a continuous redox-dependent adjustment of miRNA 556
levels and the related metabolic processes (Fig. 10).
557
Although the first 6 h were very important in the response of miRNAs and their targets 558
to H2O2 in wheat, Brachypodium and rice (Li et al., 2011; Lv et al., 2016), the subsequent 559
changes are also determinative for the reaction to stress as it was observed in wheat for 8 560
miRNAs and their targets during a whole day time-course experiment. Similarly, to the 8 561
miRNAs selected for qRT-PCR, their target genes also exhibited a light-dependent daily 562
rhythm in untreated seedlings. This observation is not surprising since the light intensity 563
changes during the day, which affects the possible formation of ROS in the photosynthetic 564
electron transport chain and subsequently the redox-sensitive miRNAs and their targets will 565
20 be influenced. In our experimental approach we could detect these light-responsive miRNAs 566
and their targets probably by modifying the amount of ROS after the addition of H2O2 to the 567
nutrient solution of the plants.
568
Although, for certain miRNA-target pairs, we observed the expected negative 569
correlation, it was not detected for each of them. The lack of such relationship can be 570
explained by the function of miRNAs as mobile signalling elements during the H2O2- 571
dependent regulation of gene expression for which a model was recently established in 572
Arabidopsis (Liang et al., 2014). Based on this model miRNA can act in another cell, tissue or 573
organ on their target genes. Consistent with this hypothesis, in the case of miR395 and its 574
target involved in the sulphur assimilation, a positive temporal but negative spatial correlation 575
was found in Arabidopsis (Kawashima et al., 2009). Besides the mentioned dynamic changes 576
in miRNA levels, such alteration also occurs in ROS levels because of the 577
compartmentalisation of ROS production and removal (Noctor et al., 2018) that allows even a 578
more complex redox-dependent regulation of miRNA targets.
579
A further possible explanation for the lack of the expected negative correlation between 580
the level of the miRNAs and their targets is the existence of such regulatory networks in 581
which one target genes is regulated by several miRNAs, and one miRNA controls several 582
targets in wheat. In addition, a positive post-transcriptional regulation of gene expression is 583
also possible as described recently for miR171b controlling arbuscular mycorrhizal symbiosis 584
in Medicago trunculata (Couzigou et al., 2017). Thus, in our network the result of the 585
negative and positive regulatory effects could be a very fine regulation with small changes. In 586
this network tae-miR33506b, tae-miR3523a, tae-miR3369a and members of the tae-miR818 587
family have central position with many target through which they are interconnected with 588
other miRNAs. Similar regulatory network of H2O2-responsive miRNAs and their targets was 589
also proposed in Brachypodium in which also a large number of target genes is controlled by 590
one miRNA (Lv et al., 2016). This system allows a co-ordinated regulation of a large set of 591
genes. Probably only a small part of the many possible targets of a miRNA is regulated in a 592
certain time point depending on the organ, developmental stage, environmental effects and 593
regulatory interactions of various signalling pathways as indicated by the large difference in 594
the number of the targets detected by degradome sequencing and predicted by bioinformatics 595
tools in wheat All small RNA libraries prepared for this study were sequenced with Illumina 596
Hiseq 2000.
597 598
Conclusions 599