Tuning the composition of plasma-activated water by a surface-wave microwave
discharge and a kHz plasma jet
Kinga Kutasi1 , Dean Popović2 , Nikša Krstulović2 and Slobodan Milošević2
1Wigner Research Centre for Physics, Institute for Solid State Physics and Optics, Hungarian Academy of Sciences, POB 49, H-1525 Budapest, Hungary
2Institute of Physics, Bijenička cesta 46, 10000 Zagreb, Croatia E-mail:kutasi.kinga@wigner.mta.hu
Received 8 March 2019, revised 25 June 2019 Accepted for publication 16 August 2019 Published 6 September 2019
Abstract
An atmospheric pressure surface-wave microwave discharge and a kHz plasma jet are used to activate purified water. It is shown, that by varying the treatment distance and the initial Ar/N2/O2mixture composition of the surface-wave microwave discharge the concentration ratio of NO3−and H2O2radicals created in the plasma activated water(PAW)can be varied over three orders of magnitude, which can be preserved during months of storage at room
temperature. At the same time, with the 5min treatment of the 32ml water the absolute radical concentrations are varied in the range of 0.5–85mg l−1for H2O2, 20–180mg l−1for NO3−and 0.5–14mg l−1for NO2−. In the case of the N2kHz plasma jet this concentration ratio can be tuned within one order of magnitude by varying the treatment distance. By treating different volumes very similar concentration ratios are obtained, which evolve differently during storage, as the ageing dynamics is determined by the absolute concentration of radicals. In general, the radical most affected by ageing is NO2−, whose recombination is found to be determined by the H2O2radical. In order to control the H2O2concentration and thus the NO2−radicals
recombination, the application of a Fenton type reaction is suggested, which is implied by inserting a copper surface into PAW during or after plasma treatment.
Keywords: plasma activated liquids, surface-wave microwave discharge, plasma jet
1. Introduction
In the last decade plasma-activated water (PAW), or more generally plasma-activated liquid(PAL)has received a lot of attention from the plasma medicine and plasma agriculture community due to its potential to induce oxidative stress to cells. By PAL it is meant the liquid which contains reactive species, mostly reactive oxygen and nitrogen species (RONS), generated by the interaction of active or afterglow plasma with the liquid. PAW has been found to have anti- microbial and antibacterial effect[1–9], which is thought to occur due to the synergetic effect between the RONS and/or pH of the solution[3,5]. Plasma activated buffered solution and cell culture media has also been studied for therapeutical aims[10–12], and it has been shown its potentials for cancer
therapy [11]. In the field of agriculture with PAW the improvement of seeds germination and plant growth have been targeted [13–15].
The lifetime of PAL has been found to be very different, varying from days to months, depending on the plasma source used. Several works define the PAL lifetime as its activity retention time [16–19], while others follow the lifetime of different RONS in the PAW[5,16,18–20]. The main long- lived RONS produced in PAL have been identified to be the H2O2, NO3− and NO2− [21]. In a 60ml ns pulsed DBD air plasma treated water the NO2−molecules could be detected up to 25min, while the concentration of H2O2decreased by a factor of 2[18]. On the other hand in a 10ml DBD activated water Trayloret al[5]have found that the lifetimes of H2O2 and nitrite are up to 4 d, while the nitrate concentration
Plasma Sources Sci. Technol.28(2019)095010(11pp) https://doi.org/10.1088/1361-6595/ab3c2f
increases slightly during the 7 d of observation. Juláket al [16]have observed the total disappearance of H2O2 (initial concentration of about 5 mg l−1)from the 10ml corona dis- charge treated water in 1 month. Shen et al [19] have fol- lowed the evolution of species concentration—0.81mg l−1of H2O2, 1.2mg l−1of NO2−and 14.6mg l−1of NO3−–in 10ml microjet activated water stored at different temperatures:
25°C, 4°C, −20°C and −80°C. At 25°C after 30 d the initial concentration of H2O2 decreased by a factor of 5, of NO2−by a factor of 8, while that of NO3−by a factor of 3. By lowering the storage temperature the recombination of H2O2 and NO2−decreased, and the freezing of NO2−could be rea- lized at−80°C. Julák et al [20] have stored the 30min air corona treated 1.5ml water at 4°C over 1year and have measured the decrease of the initial 126mg l−1 H2O2 to 41mg l−1.
Lukes et al [21] have shown that the concentration of species and their lifetime depend on the pH of treated water.
At acidic conditions (pH 3.3)lower concentrations of NO2− and H2O2, and higher concentrations of NO3−were detected as compared to conditions of pH 6.9 and 10.1. At the same time during the after-treatment period under acidic conditions the NO2− and H2O2concentrations decreased, and that of NO3− increased, while at higher pHs the concentrations did not change.
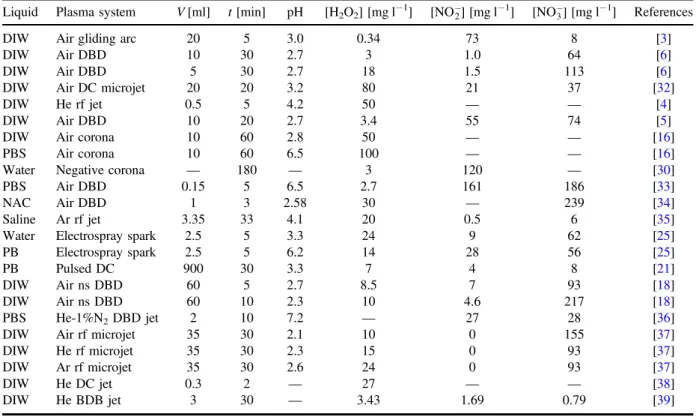
The typical concentrations reported in the literature for the main RONS are summarized in table 1. Several studies have been triggered by the plasma medicine applications, therefore a small quantity of liquids have been treated,
volumes of typical cell culture plates. Higher treated volumes range between 10 to 60ml, and depending on the plasma source used very different species concentrations are obtained. However, these works report typically one or two PAL conditions, giving no further suggestions for PAL composition tuning. In order to be able to identify the role of different species and to clarify the synergy effects in the interaction of PAL with biological systems, PAL with dif- ferent compositions would be welcomed, in what concerns the density ratios of different RONS. For tuning the PAW composition an attempt has been done by Ito et al [22] by using a He DBD jet with different shielding gases, thus obtaining ratios of [NO2−]/[H2O2] ranging between 0 and 0.18. However, here no information is given about the density of NO3−molecules, which can be also formed during storage from the reaction of NO2−with H2O2[21]. By transforming an air DBD into a DBD jet by flowing He through the array electrode, a slight tuning of the species concentration in the treated water has been achieved when varying the gas flow rate in the 0–8slm range [23]. Namely, in an 8ml 3min treated DIW the H2O2 concentration increased from 0.3 to 5.8mg l−1, the concentration of NO2−decreased from 5.5 to 1.4mg l−1 and that of NO3− varied between 19.8 and 13.6mg l−1, while the pH ranged between 2.4 and 2.7.
In the present work the tuning possibility of PAW composition through the treatment of purified water with a surface-wave microwave discharge and a kHz plasma jet is studied. Furthermore, the ageing of PAWs with different
Table 1.Typical plasma activated liquids found in the literature. Concentration of long lived radicals in PALs created with different plasma sources in deionized water(DIW), phosphate buffer saline solution(PBS), phosphate buffer(PB)and 5mmoll−1N-acetyl-cysteine in PBS (NAC), respectively.
Liquid Plasma system V[ml] t[min] pH [H2O2] [mg l−1] [NO-2][mg l−1] [NO-3][mg l−1] References
DIW Air gliding arc 20 5 3.0 0.34 73 8 [3]
DIW Air DBD 10 30 2.7 3 1.0 64 [6]
DIW Air DBD 5 30 2.7 18 1.5 113 [6]
DIW Air DC microjet 20 20 3.2 80 21 37 [32]
DIW He rf jet 0.5 5 4.2 50 — — [4]
DIW Air DBD 10 20 2.7 3.4 55 74 [5]
DIW Air corona 10 60 2.8 50 — — [16]
PBS Air corona 10 60 6.5 100 — — [16]
Water Negative corona — 180 — 3 120 — [30]
PBS Air DBD 0.15 5 6.5 2.7 161 186 [33]
NAC Air DBD 1 3 2.58 30 — 239 [34]
Saline Ar rf jet 3.35 33 4.1 20 0.5 6 [35]
Water Electrospray spark 2.5 5 3.3 24 9 62 [25]
PB Electrospray spark 2.5 5 6.2 14 28 56 [25]
PB Pulsed DC 900 30 3.3 7 4 8 [21]
DIW Air ns DBD 60 5 2.7 8.5 7 93 [18]
DIW Air ns DBD 60 10 2.3 10 4.6 217 [18]
PBS He-1%N2DBD jet 2 10 7.2 — 27 28 [36]
DIW Air rf microjet 35 30 2.1 10 0 155 [37]
DIW He rf microjet 35 30 2.3 15 0 93 [37]
DIW Ar rf microjet 35 30 2.6 24 0 93 [37]
DIW He DC jet 0.3 2 — 27 — — [38]
DIW He BDB jet 3 30 — 3.43 1.69 0.79 [39]
compositions are also followed, and solutions for controlling the PAW ageing are searched for.
2. Plasma systems and production of plasma activated water
Active species have been generated in purified water by putting the water surface in contact with the plasma plume of a kHz plasma jet and a surface-wave microwave discharge, respectively. The water samples are analyzed immediately after the treatment, as well as several times during the three months of storage. The samples are kept in closed containers (clearglass container from Macherey-Nagel GmbH)filled up to few mm below cap, at room temperature(20°C–22°C)and predominantly in dark.
The concentration of NO2−, NO3−and H2O2, and the pH of samples are measured with QUANTOFIX®test strips(Nitrate/
Nitrite 500: 10–500 mg l−1NO3−, 0.5–80 mg l−1NO-2;Nitrate/
Nitrite 100: 5–100mg l−1NO3−, 0.5–50mg l−1NO-2;Peroxide 25: 0.5–25 mg l−1; Peroxide 100: 0.5–25 mg l−1)and evaluated with the QUANTOFIX® Relax unit (by Macherey-Nagel, GmbH). The test strips calibrated by the producer to certified standard solutions allow fast analyzing without the waste of the sample, thus making possible to follow the ageing of PAWs even with high temporal resolution. On the other hand, the QUANTOFIX Relax reader allows quantitative analysis of strips with high accuracy3. The measuring error has been determined to be less than 10%(typically 6%–8%).
2.1. Plasma jet
The atmospheric pressure plasma jet consists of a quartz tube with the outer and inner diameters of 1.5 and 1 mm, respec- tively, and a copper wire of 100 microns diameter, which is inserted in the capillary and serves as the powered electrode [24]. The powered electrode is connected to a high voltage power supply, which provides a sinusoidal waveform of 28kHz with 12kV maximum voltage. The discharge is ignited in N2gas(99.996% purity), which is supplied into the capillary typically with aflow rate of 500sccm. The purified water—commercial purified water of Pharmaceutical degree (Pharmacopoeia Europaea, Ph. Eur. 9)with pH 6.5 from the KEMIG d.o.o. Croatian company—in Berzelius beaker is brought in contact with the plasma jet by placing the water surface from the capillary orifice at distances in the 1–10mm range. The treated volumes have been 25, 125and 200ml.
2.2. Surface-wave microwave discharge
The surface-wave microwave discharge is generated with the help of a surfatron launcher(Sairem, Surfatron 80)in a quartz tube of outer diameter 6mm and inner diameter 4mm, using
as a main gas Ar at gasflow rates of 1500–2000sccm. During experiments Ar-N2/O2 binary and ternary mixtures are also used with the O2and N2gasflow rates ranging between 10 and 100sccm. The input power is varied between 25 and 30W, while the reflected power can be up to a maximum of 1W. The quartz tube isfixed inside the surfatron in such a way, that downstream from the closing plate of the surfatron the edge of the quartz tube is at 14.5mm distance. This insures that at the powers and gasflow rates used the plasma plume outside the tube is long enough to allow different contact points with the water surface. A Berzelius beaker of 35mlfilled with 32ml of purified water is positioned below the plasma plume with the water surface being at 5.5, 8.5or 10.5mm distances from the edge of the quartz tube. The purified water is produced with the ELGA Purelab Option-R 7 purifier and is characterized by Total Organic Carbon (TOC) <20ppb, Bacteria <1CFU/ml, Inorganic-Typical
>15 MΩcm. In order to avoid the overheating of the quartz tube during treatments, compressed air is applied along the quartz tube with a gasflow rate of 8slm, which on the other hand has also shielding effect. The surface-wave microwave discharge being an electrodeless discharge can have a sig- nificant advantage by avoiding the contamination of liquid with nanoparticles originating from the sputtering of the electrodes, as observed in some cases [25]. Due to their advantages surface wave-microwave discharges have also been studied for biological applications [26].
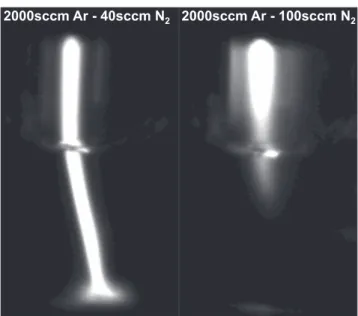
The surface-wave microwave discharges have also the advantage of the highflexibility in tuning the plasma com- position [27]. The surface-wave microwave discharge con- sists of a plasma column, characterized with a decreasing electron density profile along the column, with the critical electron density occurring at the end of it [28]. At atmo- spheric pressure the plasma column can extend over the discharge tube (with a slight change in the electron density profile at the exit of the quartz tube due to the change of the guiding dielectric [26]), as shown in figure 1. Due to this property, by changing the distance between the discharge tube and the water surface, different electron density can be achieved at the interaction surface. In our study, as a refer- ence condition it is chosen the 2000sccm Ar and 25W discharge, with the discharge tube-water surface distance of 5.5mm. In order to vary in the plasma plume the density of NO and NO2molecules (which contribute to the formation of nitrite and nitrate ions in the PAW), N2and O2gases can be added to Ar. The sustainment of the discharge and the length of the plasma column depend on the power absorp- tion of electrons from the electromagnetic field, which is determined by the electron collision frequencies[29]. When molecular gasses are added to argon, due to the change of the power absorption, larger input power is necessary to sustain a stable discharge, while the length of the plasma column also decreases, as illustrated in figure1. Therefore, using different Ar/N2/O2mixtures and treatment distances, both the electron and the NO and NO2densities can be tuned at the plasma-water interaction surface.
3 We have also performed test measurements on chemically prepared solution characterized as 0mg l−1H2O2, 2mg l−1NO2−and 50mg l−1NO3−. The strip measurements have been performed after freezing and defrosting the solution, and obtained concentrations of 0mg l−1H2O2, 2.1mg l−1NO2− and 55mg l−1NO3−.
3. Results and discussion
3.1. The PAW produced with the surface-wave microwave discharge
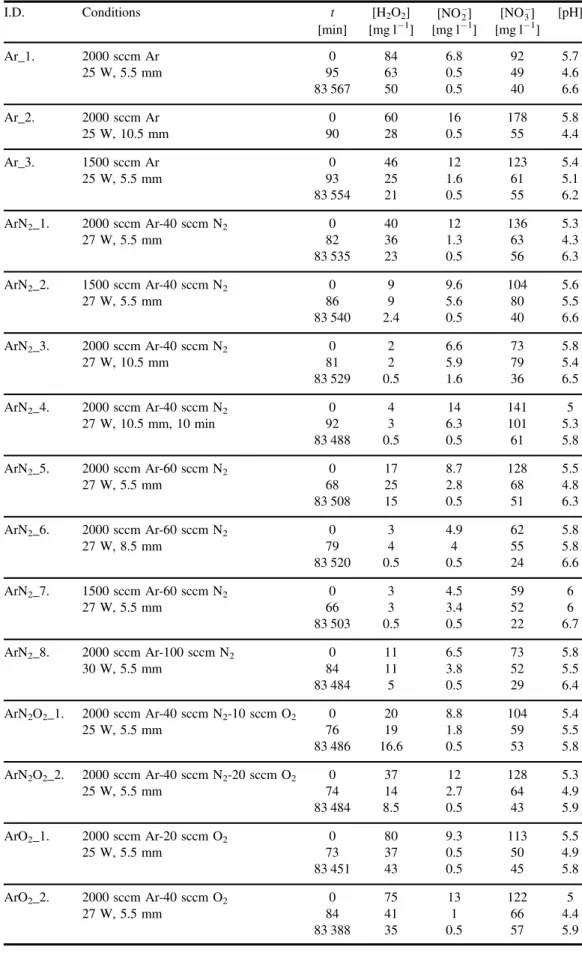
Table2shows the different treatment conditions applied and the characteristics of the generated plasma activated water.
First of all, different Ar discharge conditions have been tested by changing the gasflow rate and the treatment distance. As the plasma plume is characterized by a decreasing electron density profile, by changing the treatment distance the elec- tron density is also changed at the plume-water surface interaction point. The electrons interacting with water mole- cules at the gas–water interface can create OH radicals, which afterwards in the OH+OH⟶H2O2recombination reaction form H2O2. This is well illustrated by the obtained results, namely, at the lower treatment distance, where higher electron density occurs at the water surface, higher H2O2concentra- tion is obtained(condition Ar_1 versus Ar_2). By decreasing the gas flow rate (the Ar_3 condition), the plasma plume becomes slightly shorter, while more air is able to diffuse into the plume, which favoures the formation of nitrate and nitrite radicals.
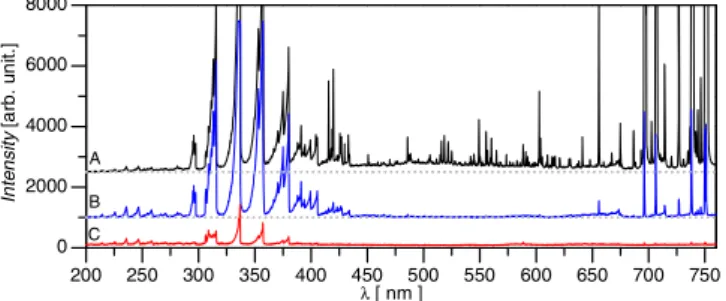
Figure 2 shows the spectra of the plume close to the water surface in the case of two different quartz tube-water surface distances. The intensity of the OH band(the OH(A–
X) transition (0, 0) bandhead at 308.5nm) is considerably lower comparing to the N2 bands and Ar lines intensity, suggesting, that the OH radicals are created at the gas–liquid interphase, instead of the plasma plume. The spectra show, that the emission of the Ar states excited by electrons(in the 602–760 nm spectral range)are lower at the higher treatment distance, indicating a lower electron density. Additionally, we can also observe the emission of the NOγ and NOβ bands (200–300 nm range)—which is a good indication for the presence of NO molecules—with higher intensity at the
higher treatment distance. Meanwhile at the lower treatment distance, there is a marked signal of the NO2green–yellow continuum, showing the presence of NO2 molecules. The dissolved NO and NO2molecules contribute to the creation of nitrate and nitrite radicals in PAW through the following reactions:
⟶ ( )
( )+ ( )+ -+ -+ +
NO2 aq NO2 aq H O2 l NO2 NO3 2H , 1
⟶ ( )
( )+ ( )+ -+ +
NOaq NO2 aq H O2 l 2NO2 2H , 2
⟶ ( )
( )+ ( ) -+ +
NOaq OHaq NO2 H , 3
⟶ ( )
( )+ ( ) -+ +
NO2 aq OHaq NO3 H . 4 Additionally, the formation of NO3−is also promoted through the NO2− +H2O2 + H+⟶ NO3−+ H2O+H+ reaction, which results in relatively lower NO2− concentration com- paring to NO3−.
By adding N2 to Ar (conditions Ar_N2 in table 2) the length of the plasma plume decreases, while the plasma becomes stable only at a higher 27W power. This effect is well reflected by the lower H2O2concentrations obtained with the Ar-N2discharges comparing to Ar discharges(see Ar_1 versus ArN2_1 condition). Figure3shows the spectra close to the water surface when adding 40sccm, 60sccm and 100sccm N2, respectively, to Ar in the case of 5.5mm treatment distance. Comparing to the spectra of the Ar dis- charge(figure2)the intensity of Ar lines gradually decreases with the N2addition, which also indicates the lowering of the electron density. With the addition of 100 sccm of N2 the emission intensity decreases significantly, which indicates, that the plasma plume becomes so short, that the water sur- face interacts with the plasma afterglow, as also illustrated by the plasma plume images infigure1. Along the afterglow the electron density drops fast, while the density of NO and NO2 radicals also decrease. This results, as expected, in a lower H2O2and nitrite/nitrate concentrations.
The NOγemission is also well observed in the afterglow region due to the fact that here the excited NO(A)molecules are created mostly through the three body recombination of N and O atoms. The afterglow conditions are also approached when increasing the treatment distance in the case of 40sccm and 60sccm N2mixture discharges, resulting in lower species concentrations in the PAW: ArN2_1 versus ArN2_3 condi- tions, and ArN2_5 versus ArN2_6, respectively. ArN2_6 and ArN2_7 conditions show, that similar effect can be obtained by decreasing the gas flow rate instead of changing the treatment distance. It is also found, that the doubling of the treatment time (ArN2_3. versus ArN2_4. condition) practi- cally doubles the active species concentrations in PAW.
When adding O2to the Ar-N2mixture, the discharge can be sustained at a lower power of 25W, similar to the case of pure Ar. Due to the lower input power and the different power absorption along the plasma column, the electron density along the plasma plume is lower than in the case of the 27W input power Ar-N2 mixture, which is well reflected by the lower H2O2concentration obtained in the PAW: ArN2O2_1 versus ArN2_1 in table 2. On the other hand, when O2 is added to the pure Ar, such in the case of 20sccm O2 to 2000sccm Ar (ArO2_1), the discharge’s structure is very
Figure 1.Image of the plasma plume in the case of 2000sccm Ar—
40sccm N227W and 2000sccm Ar—100sccm N230W surface- wave microwave discharges.
Table 2.The treatment conditions: gasflow rates, input power and quartz tube-water surface distance, and the surface-wave microwave discharge produced PAW’s characteristics at different ageing moments. The PAWs could be reproduced with a maximum error of 5%.
I.D. Conditions t [H2O2] [NO-2] [NO-3] [pH]
[min] [mg l−1] [mg l−1] [mg l−1]
Ar_1. 2000sccm Ar 0 84 6.8 92 5.7
25W, 5.5mm 95 63 0.5 49 4.6
83 567 50 0.5 40 6.6
Ar_2. 2000 sccm Ar 0 60 16 178 5.8
25W, 10.5mm 90 28 0.5 55 4.4
Ar_3. 1500sccm Ar 0 46 12 123 5.4
25W, 5.5mm 93 25 1.6 61 5.1
83 554 21 0.5 55 6.2
ArN2_1. 2000sccm Ar-40sccm N2 0 40 12 136 5.3
27W, 5.5mm 82 36 1.3 63 4.3
83 535 23 0.5 56 6.3
ArN2_2. 1500sccm Ar-40sccm N2 0 9 9.6 104 5.6
27W, 5.5mm 86 9 5.6 80 5.5
83 540 2.4 0.5 40 6.6
ArN2_3. 2000sccm Ar-40sccm N2 0 2 6.6 73 5.8
27W, 10.5mm 81 2 5.9 79 5.4
83 529 0.5 1.6 36 6.5
ArN2_4. 2000sccm Ar-40sccm N2 0 4 14 141 5
27W, 10.5mm, 10min 92 3 6.3 101 5.3
83 488 0.5 0.5 61 5.8
ArN2_5. 2000sccm Ar-60sccm N2 0 17 8.7 128 5.5
27W, 5.5mm 68 25 2.8 68 4.8
83 508 15 0.5 51 6.3
ArN2_6. 2000sccm Ar-60sccm N2 0 3 4.9 62 5.8
27W, 8.5mm 79 4 4 55 5.8
83 520 0.5 0.5 24 6.6
ArN2_7. 1500sccm Ar-60sccm N2 0 3 4.5 59 6
27W, 5.5mm 66 3 3.4 52 6
83 503 0.5 0.5 22 6.7
ArN2_8. 2000sccm Ar-100sccm N2 0 11 6.5 73 5.8
30W, 5.5mm 84 11 3.8 52 5.5
83 484 5 0.5 29 6.4
ArN2O2_1. 2000sccm Ar-40sccm N2-10sccm O2 0 20 8.8 104 5.4
25W, 5.5mm 76 19 1.8 59 5.5
83 486 16.6 0.5 53 5.8
ArN2O2_2. 2000sccm Ar-40sccm N2-20sccm O2 0 37 12 128 5.3
25W, 5.5mm 74 14 2.7 64 4.9
83 484 8.5 0.5 43 5.9
ArO2_1. 2000sccm Ar-20sccm O2 0 80 9.3 113 5.5
25W, 5.5mm 73 37 0.5 50 4.9
83 451 43 0.5 45 5.8
ArO2_2. 2000sccm Ar-40sccm O2 0 75 13 122 5
27W, 5.5mm 84 41 1 66 4.4
83 388 35 0.5 57 5.9
similar to that of the pure Ar discharge(Ar_1), which is also shown by the obtained similar H2O2concentrations(and the measured spectra, not shown here, where the emission intensity of Ar I lines were found to be similar as in the case of Ar discharge), while in the case of the Ar-O2 mixture higher nitrate/nitrite concentrations are obtained, due to the higher creation probability of the NO2 radicals in the gas phase. With the increase of the O2gasflow rate in the Ar-O2 mixture(ArO2_2)the density of NO2radicals can be further increased, resulting in higher nitrate and nitrite production in PAW.
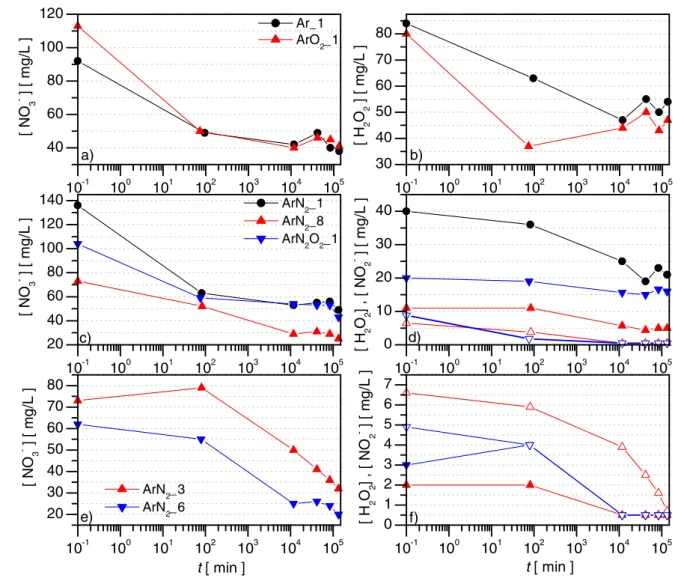
The ageing of the PAW at room temperature, already shown by the data presented in table2, is further illustrated in figure 4 at conditions with very different initial hydrogen peroxide levels in the PAW. The figures indicate that the ageing dynamics depends on the H2O2concentration, and in each case the concentrations stabilize after one week.
The most sensitive radical is found to be the NO2−, also due to its low concentration. In the case of initially high H2O2 concentrations the NO2− radicals recombine within the first hour, while at considerably lower H2O2 concentrations, figure4(d)and(f), the recombination of NO2−slows down. At very low initial H2O2 concentrations the NO2− can survive more than one month. This indicates, that the main recom- bination pathway for NO2−could be the NO2−+H2O2+H+ NO3−+H2O+H+process. This reaction is found to be effective in acidic conditions(pH<6)[30], a constant rate being reported for conditions with pH between 4 and 6 at 25°C [31]. In the case of H2O2 and NO3− radicals we can observe a sharp decrease of concentrations within the first
hour, when both initial concentrations are higher than about 60mg l−1, figures 4(a) and (b). At lower initial H2O2 con- centrations (10–40 mg l−1), figures 4(c) and (d), the recom- bination rates for both radicals become smaller, more pronouncedly in the case of H2O2. Furthermore, when the initial H2O2concentration is lower than 5mg l−1the H2O2 radicals disappear totally within one week.
Another important characteristics of PAW is the pH, which is also shown in table 2, as well as its post-discharge evolution. Comparing the different PAWs at t=0min, as expected based on the reactions (1)–(4), the pH correlates with the nitrite/nitrate concentrations, namely, at higher nitrate concentration lower pH is obtained. However, during the first hour of ageing, when a sharp decrease of con- centrations occurs, the pH also decreases, except for the conditions where the H2O2concentration is initially very low e.g. ArN2_4 and ArN2_6 conditions. This suggests the influence of thefirst phase H2O2recombination on the pH, i.e.
on the H+ ion concentration. In order to understand the complex dynamics of the system, a detailed investigation of the processes is needed, which will be the focus of a next work.
Figure 5(a) and (b) summarizes the different PAW compositions obtained with the treatments listed in table 2 right after the treatment and after one hour of storage, respectively. As already shown in figure 4, during the first hour both the nitrate and hydrogen peroxide concentrations decrease, resulting in a considerable change of the PAW’s composition. Figure 5 illustrates the possible PAWs to be obtained with a surface-wave microwave discharge. We note, that with doubling the treatment time, the doubling of the concentrations has been achieved (ArN2_3 versus ArN2_4).
Comparing to the condition with the largest H2O2 in figure 5(a) (84 mg l−1 H2O2 and 92 mg l−1 NO3−), higher H2O2 concentration and corresponding lower NO3− con- centration can be achieved by further decreasing the treatment distance or increasing the input power in the case of the Ar discharge. For the given condition, the corresponding NO3− concentration can be further decreased by increasing the Ar gasflow rate, which results in lower air inflow into the plasma plume from the surroundings. On the other extreme, at very low H2O2 concentrations, the treatments occur close to the afterglow conditions. By further increasing the treatment distance(or decreasing the input power), only neutral species would interact with the water surface, which results in H2O2 free PAWs. The nitrite-hydrogen peroxide concentration map, figure 5(b), shows the limit for the H2O2 content of PAW where NO2−radicals can survive longer than one hour, namely in the case of H2O2concentrations below 30mg l−1.
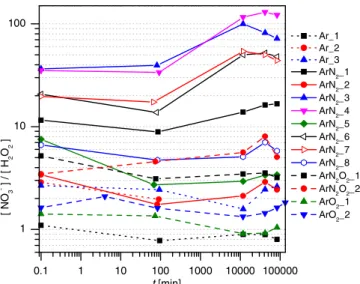
Finally,figure6shows the ratio of the nitrate to hydrogen peroxide concentration as a function of ageing for the dif- ferent treatment conditions as listed in table 2. By changing the treatment distance and the initial gas mixture composition of the discharge, the [NO3−]/[H2O2] concentration ratio can be varied over three orders of magnitude from about 0.5 to 150 (we note that the lowest detection limit of H2O2 is 0.5 mg l–1, thus in the ratio calculations the concentrations that are lower than that value are taken as 0.5). In the case of
Figure 2.Spectra of plasma plume close to the water surface for different quartz tube-water distances:(A)d=5.5mm and(B) d=10.5mm, in the case of the 2000 sccm Ar, 25 W discharge. The spectra are shifted in intensity for clarity.
Figure 3.Spectra of plasma plume close to the water surface for(A) 2000sccm Ar—40sccm N227W,(B)2000sccm Ar—60sccm N2
27W and(C)2000sccm Ar—100sccm N230W. The spectra are shifted in intensity for clarity.
the treatment conditions where initially(t=10 s)low H2O2 concentrations are obtained, the ageing has a more pro- nounced effect on the concentrations ratio, due to the strong recombination of H2O2, while the NO3− recombination is much slower(seefigures4(e)–(f)).
3.2. The PAW produced with the kHz plasma jet
Comparing to the surface-wave microwave discharge, the kHz plasma jet can be more easily ignited in molecular gases, such as nitrogen and oxygen, and consequently in air. For large scale applications, from the economical point of view, this system could have the advantage of using air or air like mixtures instead of more costly rare gases. Figure7shows the optical emission spectra of a nitrogen and an argon kHz plasma jet. In both cases the nitrogen band exhibit similar intensities, while in argon discharge a strong OH band (309 nm)emission also appears. This could be related to the difference in the electron density, which has also been reflected by the H2O2 concentrations obtained in PAW, namely higher concentration in the Ar discharge treated water. The emission intensity of the NOγ bands are also
stronger in the argon discharge, however, due to the strong quenching of the excited NO molecules by N2, this emission can indicate well the presence of NO molecules. In the pre- sent work the possibilities given by the nitrogen jet are investigated in detail.
First of all, the evolution of the PAW composition with the treatment time in different treated volumes is investigated.
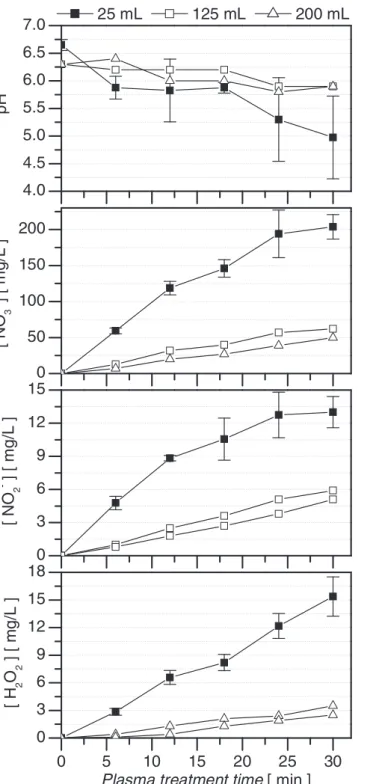
Figure 8 shows the concentrations of the nitrate, nitrite, hydrogen peroxide, as well as the pH as a function of treat- ment time in the case of 25, 125and 200ml treated water.
The concentrations have been measured at every six minutes during the treatment. It is found that during the treatment the H2O2 concentration increases linearly independently of the treated volume. On the other hand, the and NO3−and NO2− concentrations show a saturation at the lower 25ml treated volume, which can be related to the recombination processes involving H2O2, that is produced here in higher concentration.
This effect does not appear at the higher treated volumes, thanks to the lower H2O2concentrations obtained during the same treatment time. The pH is found to decrease linearly with the treatment time, which is related to the increase of the nitrite and nitrate concentrations. The error bars shown in
Figure 4.Evolution of radical concentration during PAW storage at room temperature for different treatment conditions. In the right column for the same conditions the closed symbols represent the concentration of H2O2, while the open symbols that of NO2−.
figure are obtained by averaging four independent sample treatments. The treatment of the smallest volume is the most sensitive case, the errors are due to the adjustment of the capillary orifice—water surface distance, which can slightly change also during treatment due to the water evaporation.
Figure9 shows the evolution of the concentrations and pH during the storage at room temperature of PAWs produced in different volumes. Similarly to the PAW produced by the surface-wave microwave discharge, the post-discharge
evolution of radicals in PAW strongly depends on the abso- lute concentrations. Accordingly, the sharpest first phase decrease can be observed in the smallest 25ml volume PAW, where the highest concentrations have been obtained. Espe- cially, the NO2−concentration drops fast, due to the recom- bination of NO2−with H2O2. In the larger, less concentrated volume, with the lowest initial H2O2concentration, the nitrite and nitrate recombination is more moderate, with the NO2− being preserved for months.
In the case of the nitrogen kHz plasma jet one controlling parameter can be the treatment distance. Figure10shows the concentrations obtained by treating the 25ml volume at dif- ferent capillary orifice to the water surface distances. As expected, with the decrease of the distance, due to the increase of the electron density the formation of H2O2radicals is strongly enhanced, while the nitrate and nitrite concentra- tions change just slightly. Accordingly, with this method the [NO3−]/[H2O2] concentration ratio could be varied in the 2–12 range. However the ageing tends to equalize this ratio.
3.3. Controlling the ageing of PAW
As we have seen, the most affected radical by storage is the NO2−, and its evolution strongly depends on the H2O2 con- centration. In order to preserve the NO2−, the concentration of H2O2and its recombination should be controlled. One possibi- lity is to rely on a Fenton type reaction, which controls the H2O2 recombination. This reaction is believed to have more pathways:
(i)the Fenton M2++H2O2 M3++OH+OH−or(ii)the catalase M2++ H2O2 MO2++ H2O, MO2+ +H2O2 M2++H2O+O2. In our study we use copper as a metal.
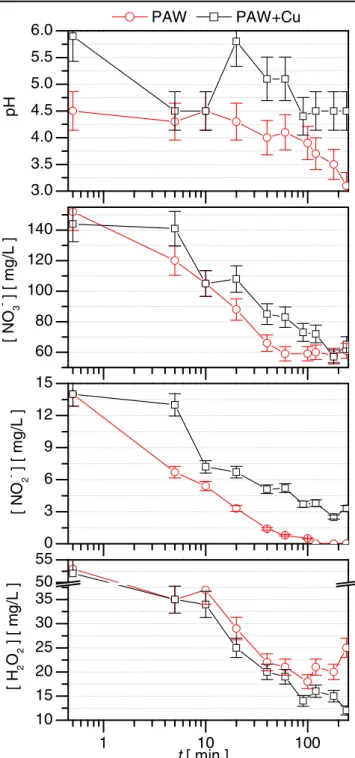
In order to test this effect, we compared the evolution of two different samples produced under same treatment con- ditions: (i) plasma-activated water (PAW) and (ii) plasma- activated water with a copper plate inserted during the treat- ment(PAW+Cu). The applied copper plate is 1mm thick of 70×10mm2size. Figure11 shows the ageing of the sam- ples activated with the surface-wave microwave discharge.
The results illustrate, that copper contributes to the increase of the H2O2 recombination, while it slows down that of the NO2−. In this way NO2−can be preserved longer(We note that the effect depends on the concentration of H2O2.). This indicates that the copper mediated H2O2 recombination changes the system’s chemical kinetics. In order to be able to control the ageing of PAW, a deeper understanding of the
Figure 5.The nitrate-hydrogen peroxide(a)and nitrite-hydrogen peroxide concentration(b)maps right after the plasma treatment (closed symbols)and one hour storage(open symbols). The data correspond to all the conditions listed in table2.
Figure 6.The ratio of the nitrate to peroxide concentration as a function of ageing time for the different treatment conditions as listed in table2.
Figure 7.The optical emission spectra of the argon(A)and nitrogen (B)kHz plasma jets recorder from the region right below the capillary exit.
chemical pathways is required, which can be the focus of a future work.
4. Summary
An atmospheric pressure surface-wave microwave discharge and a kHz plasma jet have been used to activate purified water
(W) and to study the possibility to tune the composition of plasma activated water(PAW) with the discharge and treat- ment conditions.
The surface-wave microwave discharge has been ignited in Ar and in Ar/N2/O2 binary and ternary mixtures with powers in the 25–30W range. The different gas mixture conditions allows to tune the electron and species densities at the plasma-water interaction point. The treatments have been conducted by putting 32ml W in contact with the plasma plume, with the water surface being at 5.5, 8.5 and 10.5mm
Figure 8.The evolution of the concentrations and the pH during 30min treatment with the nitrogen atmospheric pressure plasma jet in the case of different treated volumes. The discharge is sustained with 12kV and 28kHz sinusoidal waveform, and the capillary- water surface distance is 10mm.
Figure 9.Ageing at room temperature of PAWs obtained by 30min nitrogen plasma jet treatment.
distances from the edge of the discharge quartz tube. It is shown, that by varying the initial gas mixture composition and treatment distance, the absolute radical concentrations in the plasma activated water(PAW)can be varied in the range of 0.5–85mg l−1 for H2O2, 20–180mg l−1 for NO3− and 0.5–14mg l−1 for NO2−. The ageing of PAW is found to depend on the absolute concentration of radicals, and most specifically on the concentration of H2O2, which governsfirst of all the recombination of NO2−. When the initial con- centrations of H2O2 and NO3− are higher than about 60mg l−1, a sharp decrease of both concentrations occurs within the first hour, while the NO2− radicals recombine totally. At lower initial H2O2concentrations(10–40 mg l−1), the recombination rates for both H2O2 and NO3− become smaller, more pronouncedly in the case of H2O2. Finally, when the initial H2O2 concentration is lower than 5mg l−1 the H2O2radicals disappear totally within one week, while the NO2− can survive more than one month. It is further found, that the concentration ratio of NO3− and H2O2 radicals is varied over three orders of magnitude, which is preserved during months of storage at room temperature. The pH of PAWs right after the treatment have values between 5 and 6, and a correlation is found between the pH and the nitrite/
nitrate concentrations, namely, at higher nitrate concentration lower pH is obtained. During thefirst hour of ageing, in the PAWs where a sharp decrease of the concentrations occurred
—which exclude conditions where the H2O2concentration is initially very low—, the pH decreased to values between 4.4 and 5.5. However, at the latter stage of ageing, with the
stabilization of the concentrations the pH increased again to values between 5.8 and 6.7. A correlation is found between the pH variation and the H2O2recombination.
The kHz plasma jet has been ignited in N2 gas with a sinusoidal voltage waveform of 28kHz and maximum voltage of 12kV. With this source the effect of the treatment distance and treated volume on the PAW composition has been studied.
It is shown, that by varying the distance in the 1–10mm range, the[NO3−]/[H2O2]concentration ratio can be tuned within one order of magnitude, which is partially preserved during ageing.
At the same time, the absolute concentrations in the 25ml
Figure 10.Concentrations as a function of treatment distance within thefirst minute after treatment(full symbols)and after 50 000min (35 d)storage(open symbols)in the case of 25ml 10min plasma jet treatment.
Figure 11.Ageing of microwave produced PAWs: plasma-activated water(PAW)and plasma-activated water with a copper plate inserted during the treatment(PAW+Cu).
PAW vary in the 0.5–50mg l–1for H2O2, 15–130mg l−1for NO3− and 0.5–10mg l−1 for NO2−. With the increase of the treated volume up to 200ml, lower radical concentrations are achieved, with the H2O2reaching as low as 4mg l−1, which results in the fast recombination of H2O2and the preservation of NO2−for months.
In order to control the H2O2concentration and thus the NO2−radicals recombination, the application of a Fenton type reaction is suggested, where the H2O2 recombination is mediated by metal ions. By inserting a copper surface into PAW during or after plasma treatment, it is demonstrated that the recombination pathway of H2O2can be altered, and the NO2−radicals can be preserved longer.
Acknowledgments
The work has been supported by the Hungarian Science Foundation NKFIH, through project K-115805, by the Croatian Science Foundation, through project IP-2013-11- 2753 and by the Croatian—Hungarian bilateral project TéT_16-1-2016-0014.
ORCID iDs
Kinga Kutasi https://orcid.org/0000-0001-6082-1853 Dean Popović https://orcid.org/0000-0003-3906-3482 Nikša Krstulović https://orcid.org/0000-0001-6443-2417 Slobodan Milošević https://orcid.org/0000-0002- 4455-7869
References
[1] Kamgang-Youbi G, Herry J-M, Bellon-Fontaine M-N, Brisset J-L, Doubla A and Naïtali M 2007Appl. Environ.
Microbiol.734791
[2] Kamgang-Youbi G, Herry J-M, Brisset J-L,
Bellon-Fontaine M-N, Doubla A and Naïtali M 2008Appl.
Microbiol. Biotechnol.81449
[3] Naïtali M, Kamgang-Youbi G, Herry J-M,
Bellon-Fontaine M-N and Brisset J-L 2010Appl. Environ.
Microbiol.767662
[4] Ikawa S, Kitano K and Hamaguchi S 2010Plasma Process.
Polym.733
[5] Traylor M J, Pavlovich M J, Karim S, Hait P, Sakiyama Y, Clark D S and Graves D B 2011J. Phys. D: Appl. Phys.44 472001
[6] Oehmigen K, Hähnel M, Brandenburg R, Wilke C,
Weltmann K-D and von Woedtke T 2010Plasma Process.
Polym.7250
[7] Oehmigen K, Winter J, Hähnel M, Wilke C, Brandenburg R, Weltmann K-D and von Woedtke T 2011Plasma Process.
Polym.8904
[8] Kobayashi T, Iwata N, Oh J-S, Hashizume H, Ohta T, Takeda K, Ishikawa K, Hori M and Ito M 2017J. Phys. D:
Appl. Phys.50155208
[9] Tasaki T, Ohshima T, Usui E, Ikawa S, Kitano K, Maeda N and Momoi Y 2017Dent. Mater. J.36422 [10] Tanaka H, Mizuno M, Ishikawa K, Nakamura K, Kajiyama H,
Kano H, Kikkawa F and Hori M 2011Plasma Med.1265 [11] Utsumi F, Kajiyama H, Nakamura K, Tanaka H, Mizuno M,
Ishikawa K, Kondo H, Kano H, Hori M and Kikkawa F 2013PLoS One8e81576
[12] Takai E, Ohashi G, Yoshida T, Särgjerd K M, Zako T, Maeda M, Kitano K and Shiraki K 2014Appl. Phys. Lett.
104023701
[13] PuačN, Gherardi M and Shiratani M 2017Plasma Process.
Polym.151700174
[14] Sivachandiran L and Khacef A 2017RSC Adv.71822 [15] Thirumdas R, Kothakota A, Annapure U, Siliveru K,
Blundell R, Gatt R and Valdramidis V P 2018Trends Food Sci. Technol.7721?31
[16] Jukák J, Scholtz V, Kotúčová S and Janoušková O 2012Phys.
Med.28230
[17] Brisset J-L and Pawlat J 2016Plasma Chem. Plasma Process.
36355
[18] Laurita R, Barbieri D, Gherardi M, Colombo V and Lukes P 2015Clin. Plasma Med.353
[19] Shen J, Tian Y, Li Y, Ma R, Zhang Q, Zhang J and Fang J 2016Sci. Rep.628505
[20] Julák J, Hujacová A, Scholtz V, Khun J and Holada K 2018 Plasma Phys. Rep.44125
[21] Lukes P, Dolezalova E, Sisrova I and Clupek M 2014Plasma Sources Sci. Technol.23015019
[22] Ito T, Uchida G, Nakajima A, Takenaka K and Setsuhara Y 2017Japan. J. Appl. Phys.5601AC06
[23] Wang B, Liu D, Zhang Z, Li Q, Liu Z, Guo L, Wang X and Kong M G 2017J. Phys. D: Appl. Phys.50305202 [24] Zaplotnik R, Kregar Z, Bišćan M, Vesel A, Cvelbar U,
MozetičM and MiloševićS 2014Eur. Phys. Lett.10625001 [25] Machala Z, Tarabova B, Hensel K, Spetlikova E,
Sikurova L and Lukes P 2013Plasma Process. Polym.
10649
[26] Krcma F, Tsonev I, Smejkalová K, Truchlá D, Kozáková Z, Zhekova M, Marinova P, Bogdanov T and Benova E 2018 J. Phys. D: Appl. Phys.51414001
[27] Kutasi K, Noel C, Belmonte T and Guerra V 2016Plasma Sources Sci. Technol.25055014
[28] Moisan M and Zakrzewski Z 1991J. Phys. D: Appl. Phys.
241025
[29] Kutasi K, Sá P and Guerra V 2012J. Phys. D: Appl. Phys.45 195205
[30] Brisset J-L and Hnatiuc E 2012Plasma Chem. Plasma Process.32655
[31] Lobachev V L and Rudakov E S 2006Russ. Chem. Rev.
75375
[32] Liu Fet al2010Plasma Process. Polym.7231
[33] Pavlovich M J, Chang H-W, Sakiyama Y, Clark D S and Grave D B 2013J. Phys. D: Appl. Phys.46145202 [34] Ercan U K, Wang H, Ji H, Fridman G, Brooks A D and
Joshi S G 2013Plasma Process. Polym.10544 [35] van Gils C A J, Hofmann S, Boekema B K H L,
Brandenburg R and Bruggeman P J 2013J. Phys. D: Appl.
Phys.46175203
[36] Girard F, Badets V, Blanc S, Gazeli K, Marlin L, Authier L, Svarnas P, Sojic N, Clément F and Arbault S 2016RSC Adv.
678457
[37] Vlad I-E and Anghel S D 2017J. Electrostat.87284 [38] Chen Z, Liu D, Chen C, Xu D, Liu Z, Xia W, Rong M and
Kong M G 2018J. Phys. D: Appl. Phys.51325201 [39] Oh J-S, Szili J E, Ogawa K, Short R D, Ito M, Furuta H and
Hatta A 2018Japan. J. Appl. Phys.570102B9