Significant Effects in Bread-making Quality Associated with the Gene Cluster Glu-D3/Gli-D1 from the Bread Wheat
Cultivar Prointa Guazú
M. DeMichelis1, l.s. Vanzetti1,2, J.M. crescente1,2, M.M. nisi1, l. Pflüger3, c.t. Bainotti1, M.B. cuniBerti1, l.r. Mir1 and M. helguera1*
1INTA EEA Marcos Juárez, Ruta 12 S/N, 2580 Marcos Juárez, Córdoba, Argentina
2CONICET Av. Rivadavia 1917 C1033AAJ CABA, Argentina
3Instituto de Recursos Biológicos INTA Castelar, Las Cabañas y Los Reseros S/N, 1686 Hurlingham, Buenos Aires, Argentina
(Received 16 May 2018; Accepted 17 July 2018;
Communicated by F. Békés)
Seed storage proteins (gliadins and glutenins) play a key role in the determination of dough and bread-making quality in bread wheat. This is due to the interaction between high and low molecular weight glutenins subunits and gliadins, via complex inter- and intra- molecular bondings. In contrast to high molecular weight glutenins, low molecular weight glutenins and gliadins analysis is difficult due to the large number of expressed subunits and coding genes. For these reasons the role of individual proteins/subunits in the determination of wheat quality is less clear. In this work we studied the effect of gene clusters Glu-A3/
Gli-A1 and Glu-D3/Gli-D1 in bread-making quality parameters using 20 F4-6 families from the cross Prointa Guazú × Prointa Oasis, both cultivars carrying identical high molecular weight glutenins subunits composition and presence of 1BL/1RS wheat-rye translocation, but differing in Glu-A3/Glu-D3 low molecular weight glutenins subunits and Gli-A1/Gli-D1 gliadins patterns. ANCOVA analysis showed a significant contribution of the Glu-D3/Gli-D1 gene cluster provided by Prointa Guazú to gluten strength explained by mixograph param- eters MDS and PW, and Zeleny Test. Markers tagging Prointa Guazú Glu-D3/Gli-D1 alleles are available for strong gluten selection in breeding programs.
Keywords: bread-making quality, Glu-D3 and Gli-D1 loci, gluten-strength, gliadins-low molecular weight glutenins
Introduction
Bread wheat (Triticum aestivum L.) seed storage proteins play a key role in the determina- tion of viscoelastic properties of dough that allow it to be processed into a wide range of end-uses such as bread, noodles, cookies and cakes. Gliadins and glutenins are exten- sively studied as main components of wheat storage proteins and because of their impor- tance in determining dough rheological properties (Payne 1987). Gliadins are monomeric proteins related to dough extensibility and classified as α-, β-, λ- and ω-gliadins in order of decreasing mobility in acid polyacrylamide gel electrophoresis (Woychik et al. 1961).
*Corresponding author; E-mail: helguera.marcelo@inta.gob.ar
Most α- and β-gliadins are encoded at the Gli-2 loci, located on short arms of chromo- somes 6A, 6B and 6D, and most λ- and should be ω-gliadins instead of β-gliadins are encoded at the Gli-1 loci, on the short arms of chromosomes 1A, 1B and 1D. Glutenins are polymeric proteins stabilized by intra- and inter-molecular disulphide bonds with the latter resulting in the formation of the glutenin polymer responsible for the visco-elastic properties of dough. Glutenins are classified in two categories based on electrophoretic behaviour and genetic control: high molecular weight glutenin subunits (HMW-GS) en- coded by tightly-linked “x” and “y” type genes at the Glu-1 loci (Payne 1987) and low molecular weight glutenins subunits (LMW-GS), principally encoded by Glu-3 loci (Singh and Shepherd 1988). Allelic variation in loci encoding HMW-GS can be easily distinguished by sodium dodecyl sulfate-polyacrylamide gel electrophoresis (SDS- PAGE). This simplicity has facilitated the identification of specific HMW-GS and their contribution to bread-making quality. Numerical quality scores for each of the subunits were summed to create a Glu-1 quality score in order to systematically asses the bread- making quality of a given cultivar on the basis of its HMW-GS composition (Payne et al.
1987). Since then, Glu-1 quality score has been widely used to characterize wheat germ- plasm from diverse origins as Canada, Germany, USA and Japan among others (Lukow et al. 1989; Rogers et al. 1989; Lookhart et al. 1993; Nakamura et al. 1999). Besides HMW-GS composition additional factors affecting dough properties can be described, among them, (1) naturally occurring over-expression of HMW-GS producing a stronger dough, examples are the Glu-B1al and Glu-B1br alleles (Butow et al. 2004; Gao et al.
2012). (2) Presence of 1BL/1RS rye translocation with detrimental effect on bread-mak- ing quality, reducing mixing tolerance, loaf volume and producing a sticky dough (Gray- bosch 2001; Graybosch et al. 1993; Payne et al. 1987). 1AL/1RS translocation also di- minishes quality but the effect is not as severe as that observed with 1BL.1RS (Graybosch et al. 1993). (3) Highly polymorphic LMW-GS. In contrast with HMW-GS the specific role of LMW-GS in end-use quality has been more difficult to distinguish: the relative complexity of the electrophoretic separations interferes with assigning clear relationships with quality parameters (D’Ovidio and Masci 2004). Recent advances in the development of LMW-GS molecular markers allows the identification and characterization of com- plete sequences of all LMW-GS genes in any wheat variety (Zhang et al. 2011a; b; 2013).
The use of molecular data based on LMW-GS gene composition in the development and characterization of wheat segregating populations (Espí et al. 2014), near isogenic lines (Bonafede et al. 2015) and/or LMW-GS standards (Ibba et al. 2017) provides valuable information for a better understanding of the contribution of LMW-GS to the end-use quality and breeding.
With an annual production of 13.4 million tonnes (average production 2012–2016, FAOSTAT) Argentina plays an important role in the wheat market: six million tonnes are locally consumed and remaining production is for export, mainly to high quality demand- ing markets like Brazil among others. In this context, the availability and use of genetic resources to improve bread-making quality is highly desired for breeding purposes. First studies of HMW-GS characterization in local germplasm resulted in a high Glu-1 quality score (9.36) explained by indirect selection of alleles related with good bread quality by
breeding (Gianibelli et al. 2002). This work allowed the identification of varieties Prointa Guazú and Prointa Oasis, both showing same Glu-1 quality score = 6 explained by pres- ence of identical combination of HMW-GS 1/7 + 9/5 + 10 and 1BL/1RS rye transloca- tion. Interestingly, consistent data obtained from 18 locations (see Table S1*), showed a significant higher dough strength (p > 0.05) in Prointa Guazú than Prointa Oasis, meas- ured with the W parameter of Chopin Alveograph (W = 402.6 vs 319.4, respectively).
A possible explanation for the better performance in gluten strength of Prointa Guazú related to Prointa Oasis could arise from segregating LMW-GS and/or gliadins as both cultivars shared HMW-GS and 1BL/1RS rye translocation. In this work we (1) character- ized polymorphic LMW-GS and gliadins from Prointa Guazú and Prointa Oasis by SDS- PAGE, A-PAGE and molecular markers, (2) developed F4 families with segregating stor- age proteins, and (3) associated gene cluster Glu-D3/Gli-D1 from Prointa Guazú with improved dough strength.
Materials and Methods Plant materials and storage protein characterization
Argentine hard red spring wheat cultivars Prointa Guazú (JUP73/ZP//COC F75/3/
ALDAN’S’) and Prointa Oasis (OAS/TRM73) were selected to develop F4 families car- rying homozygous LMW-GS/gliadins polymorphic between parents. Selected cultivars share HMW-GS composition 1/7 + 9/5 + 10 (Gianibelli et al. 2002), which, combined with presence of 1BL/1RS rye translocation, generates a suboptimal Glu-1 index = 6.
Prointa Guazú (PG) was released in 1991 for high yield potential and very good bread making quality. Prointa Oasis (PO) was released in 1989 for very high yield potential but lower bread making quality (Table S1). PG was crossed to PO during the spring of 2003 in the greenhouse facility at INTA EEA Marcos Juárez, Argentina (–32.72, –62.1), and F1 seed was sown in fall 2004. During fall 2005 136 F2 plants were grown in greenhouse obtaining F3 seed that was harvested from each F2 plant separately. SDS-PAGE and A- PAGE analyses were used to identify segregating glutenin and gliadin protein patterns (two F3 seeds per F2 plant). Briefly, gliadins were extracted with 1.5 M dimethylforma- mide from wholemeal flour (single seed, two extractions per F3 family). After a brief centrifugation, the pellets of glutenins were solubilized and alkylated with 1.4% 4-vi- nylpyridine to be separated by SDS-PAGE as before (Moiraghi et al. 2013). Dimethylfor- mamide-extracted gliadins were separated by acid polyacrylamide gel electrophoresis (A-PAGE) according to Khan et al. (1985). In fall 2006, based on segregating B-LMW- GS (Caballero et al. 2004; D’Ovidio and Masci 2004) and CNN/CS ω-gliadins patterns (Masci et al. 1991; Pflüger et al. 2001; Lerner et al. 2009), twenty F3 families carrying homozygous parental or recombinant B-LMW-GS and ω-gliadins were selected and ad- vanced as 1 m rows for seed multiplication.
*Further details about the Electronic Supplementary Material (ESM) can be found at the end of the article.
Molecular tagging of segregating LMW-GS
Genomic DNA from selected F3 families was extracted according to Wining and Lan- gridge (1991). Glu-A3 alleles were amplified using primers previously described (Zhang et al. 2004). Glu-D3 sequences from PO and PG were obtained by direct sequencing of PCR products using primers previously designed (Zhao et al. 2004). Based on clustal alignment of obtained sequences and AY263369 (Xiaoyan 6 Glu-D3 coding sequence) cultivar-specific primer combinations were developed using Primer 3 (Untergasser et al.
2012). The amplified loci with primer sequences combinations, expected size, and refer- ences used in this study are listed in Table S2. The PCR reactions were performed in 25 ul volumes containing 1 unit of Taq DNA polymerase (Promega), 1 × PCR buffer, 1.5 mM MgCl2, 200 mM of each dNTP, 0.2 mM of each primer, and 100–150 ng of genomic DNA. PCR amplifications were as follows: 3 min at 94 °C and 39 cycles of 45 s at 94 °C, 40 s at 55 °C and 50 s at 72 °C. PCR products were analysed on 1.5% agarose gels in 1X SB Buffer (Brody and Kern 2004), stained with ethidium bromide (0.5 g/l) and visualized by UV light exposure.
Field trials
In three successive falls (second week of June, years, 2007, 2008, 2009), F3 selected families were planted in the experimental field of INTA EEA Marcos Juárez. Seeding rates were standardized based on seed size to 200 seeds m−2. Trials were grown under rainfed conditions and fertilized with phosphorus (57 kg P per ha), sulphur (15 kg S per ha), and 200 kg of nitrogen per ha. Pest and weed control was carried out with broad- range fungicides and herbicides. The trials were conducted as randomized complete block design with two replications, plot size was 3.0 m long by 7 rows wide. Because of plant cycle variation within selected families seed was hand harvested sequentially for a period of 15 days close to the end of spring.
Quality tests
Seed harvested from field trials 2007, 2008 and 2009 was used to determine bread-mak- ing quality parameters using standard American Association of Cereal Chemists proto- cols (AACC, 2000) or alternatively, Argentinean standard tests, at the Wheat Quality Laboratory in INTA EEA Marcos Juárez. Grain samples were milled into flour according to AACC 26-21A method; before that, grain protein content was obtained by NIR spec- troscopy according to the AACC 39-25 method. Zeleny sedimentation test was measured according to standard test IRAM 15875 ISO 5529-1992 and the AACC 54-40-A method was used to obtain mixograph parameters. The mixing parameters were calculated using the MixSmart software ver 1.0.404.
Statistical analyses
Significant associations between genetic components and bread-making quality parame- ters were analysed using ANCOVA with protein content as covariate to estimate the effect of protein quality independently of protein quantity, as previously reported (Branlard et al. 2001; Bonafede et al. 2015). Correlations among bread-making quality parameters were calculated using Pearson’s coefficient and multiple pairwise mean comparisons were conducted using LSD Fisher’s test. Statistical analyses were carried out with Infos- tat v2016 (Di Rienzo et al. 2016).
Results
Development of F3 families with segregating LMW-GS and gliadins
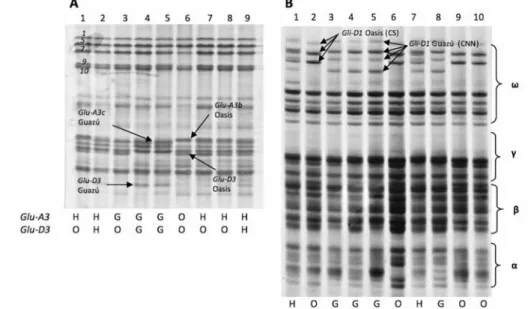
Information from four segregating LMW-GS bands (Glu-A3 and Glu-D3 loci) and two gliadins patterns (CNN/CS) was obtained from the 136 F2 plants generated from the cross PG × PO (Fig. 1A, B). Such information allowed the selection of five homozygous F3 families carrying PG LMW-GS bands and gliadin pattern CNN, 3 F3 families with PO LMW-GS bands combined with CS gliadin pattern, 7 F3 families with PO and PG LMW- GS bands combined with CNN gliadin pattern and 5 F3 families with PO and PG LMW-
Figure 1. Electrophoresis separation of storage proteins from F2 seeds of the cross Prointa Guazú × Prointa Oasis. In A, separation of glutenins by SDS-PAGE, conserved HMW-GS subunits 1/7 + 9/5 + 10 are indicated in numbers. Segregating LMW-GS from Glu-D3 and Glu-A3 genes are indicated in black arrows and in the bottom table. Lanes 5 and 6 are checks. In B, separation of gliadins by A-PAGE, segregating Cheyenne (CNN) and Chinese Spring (CS) ω-gliadin patterns are indicated in black arrows and in the bottom line. H heterozy-
gous. Lanes 5 and 6 are checks
GS bands combined with CS gliadin pattern (Table S3). Molecular data established PO as carrying Glu-A3b allele and PG Glu-A3c. Glu-A3 (Zhang et al. 2004) and Glu-D3 mark- ers developed in this study were used to screen F3 families and confirmed previous data.
A perfect cosegregation between PO and PG Glu-D3 molecular alleles and CS/CNN ω-gliadins patterns was observed confirming close genetic linkage between Glu-D3 and ω-gliadins (locus Gli-D1) previously reported (Singh and Shepherd 1988).
Correlation among quality parameters
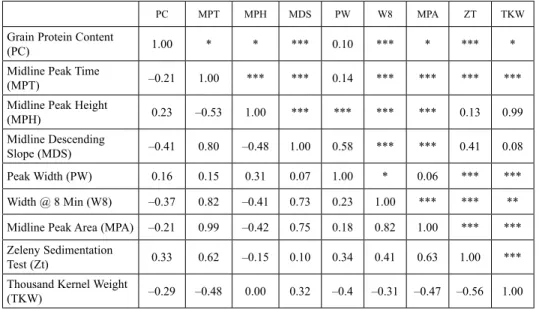
To establish relationships among quality parameters, correlations between all possible pairwise combinations of quality traits were estimated (Table 1). A highly significant and positive correlation was observed between mixograph parameters midline peak time (MPT) and midline peak area (MPA) (r = 0.99, p < 0.001) and MPA was excluded for further analyses.
Grain protein content (PC) showed positive correlations with Zeleny Sedimentation Test (ZT) and to a lesser degree, midline peak height (MPH) (Table 1). These positive correlations can be explained by the positive effect of protein content with ZT (Hrušková et al. 2006; Bonafede et al. 2015) and MPH (Martinant et al. 1998; Bonafede et al. 2015).
Also, PC was negatively correlated with MDS, width @ 8 min (W8), and to a lesser de- gree, MPT (Martinant et al. 1998; Bonafede et al. 2015). Also, and in agreement with previous data, PC was negatively correlated with TKW, reflecting a probable high yield
Table 1. Correlation among quality parameters from F3 families obtained from the cross Prointa Guazú × Prointa Oasis
PC MPT MPH MDS PW W8 MPA ZT TKW
Grain Protein Content
(PC) 1.00 * * *** 0.10 *** * *** *
Midline Peak Time
(MPT) –0.21 1.00 *** *** 0.14 *** *** *** ***
Midline Peak Height
(MPH) 0.23 –0.53 1.00 *** *** *** *** 0.13 0.99
Midline Descending
Slope (MDS) –0.41 0.80 –0.48 1.00 0.58 *** *** 0.41 0.08
Peak Width (PW) 0.16 0.15 0.31 0.07 1.00 * 0.06 *** ***
Width @ 8 Min (W8) –0.37 0.82 –0.41 0.73 0.23 1.00 *** *** **
Midline Peak Area (MPA) –0.21 0.99 –0.42 0.75 0.18 0.82 1.00 *** ***
Zeleny Sedimentation
Test (Zt) 0.33 0.62 –0.15 0.10 0.34 0.41 0.63 1.00 ***
Thousand Kernel Weight
(TKW) –0.29 –0.48 0.00 0.32 –0.4 –0.31 –0.47 –0.56 1.00
Values below the diagonal indicate the Pearson correlation coefficients and values above, corresponding P values.
Significance codes: *P < 0.05; **P < 0.01 and ***P < 0.001.
diluting protein content effect (Bonafede et al. 2015). No significant correlation was ob- served between PC and peak width (PW). A good predictor of gluten strength like MPT (Bonafede et al. 2015) showed positive and highly significant correlations with MDS, W8 and importantly, ZT, as ZT has also been positively correlated with gluten strength (Bran- lard and Dardevet 1985). Negative and highly significant correlations between MPT and MPH as well as Thousand Kernel Weight (TKW) were detected. Also, MDS and W8 showed highly significant correlation between them (Table 1).
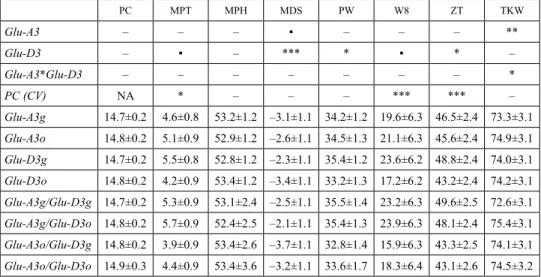
Contribution of segregating LMWGs and gliadins to quality parameters variation Our previous analysis showed significant correlations of PC with all tested quality param- eters except PW, therefore for a more precise evaluation of the protein quality, independ- ent of protein quantity, PC was used as a covariate for mixograph parameters, ZT and TKW as previously described (Branlard et al. 2001; Bonafede et al. 2015). As expected, in the case of protein content (PC) no significant contributions of Glu-A3 and Glu-D3 gene clusters, or Glu-A3 * Glu-D3 interaction, were observed (Table 2). A similar result was observed for parameters MPH, MPT and W8 (the last two ones with significant and highly significant interaction with PC as covariate). For MDS, highly significant differ- ences among genotypes (p < 0.001) were observed for Glu-D3, with lower MDS associ- ated with the presence of PG allele (–2.31) vs PO (–3.43). Higher values of MDS ob- served for PG can be related with a lower descending slope correlated with longer MPT (and W8) previously associated with stronger gluten (Bonafede et al. 2015). For PW,
Table 2. Analysis of covariance for quality parameters using PC as covariate from F3 families obtained from the cross Prointa Guazú × Prointa Oasis
PC MPT MPH MDS PW W8 ZT TKW
Glu-A3 – – – ▪ – – – **
Glu-D3 – ▪ – *** * ▪ * –
Glu-A3*Glu-D3 – – – – – – – *
PC (CV) NA * – – – *** *** –
Glu-A3g 14.7±0.2 4.6±0.8 53.2±1.2 –3.1±1.1 34.2±1.2 19.6±6.3 46.5±2.4 73.3±3.1 Glu-A3o 14.8±0.2 5.1±0.9 52.9±1.2 –2.6±1.1 34.5±1.3 21.1±6.3 45.6±2.4 74.9±3.1 Glu-D3g 14.7±0.2 5.5±0.8 52.8±1.2 –2.3±1.1 35.4±1.2 23.6±6.2 48.8±2.4 74.0±3.1 Glu-D3o 14.8±0.2 4.2±0.9 53.4±1.2 –3.4±1.1 33.2±1.3 17.2±6.2 43.2±2.4 74.2±3.1 Glu-A3g/Glu-D3g 14.7±0.2 5.3±0.9 53.1±2.4 –2.5±1.1 35.5±1.4 23.2±6.3 49.6±2.5 72.6±3.1 Glu-A3g/Glu-D3o 14.8±0.2 5.7±0.9 52.4±2.5 –2.1±1.1 35.4±1.3 23.9±6.3 48.1±2.4 75.4±3.1 Glu-A3o/Glu-D3g 14.8±0.2 3.9±0.9 53.4±2.6 –3.7±1.1 32.8±1.4 15.9±6.3 43.3±2.5 74.1±3.1 Glu-A3o/Glu-D3o 14.9±0.3 4.4±0.9 53.4±3.6 –3.2±1.1 33.6±1.7 18.3±6.4 43.1±2.6 74.5±3.2 Grain Protein Content (PC); Midline Peak Time (MPT); Midline Peak Height (MPH), Midline Descending Slope (MDS), Peak Width (PW), Width @ 8 Min (W8); Midline Peak Area (MPA); Zeleny Sedimentation Test (ZT); Thousand Kernel Weight (TKW). Significance codes: – p > 0.1; ▪ p < 0.1; *p < 0.05; **p < 0.01; ***P < 0.001; NA not available.
significant but lower differences among genotypes (p < 0.05) were observed for Glu-D3, with higher PW associated with PG allele (35.44) vs PO (33.22). PW did not show rele- vant correlations with additional mixograph parameters evaluated, displaying a highly significant correlation with ZT and TKW. For ZT, also significant differences among genotypes (p < 0.05) were detected for Glu-D3, with higher ZT values observed in geno- types carrying PG allele (48.85) vs PO allele (43.25). Higher ZT values have been posi- tively correlated with gluten strength (Branlard et al. 2001).
Discussion Molecular basis of segregating quality traits
Previous ANCOVA allowed us to dissect the contribution of Glu-D3/Gli-D1 alleles from PG allele to gluten strength, mostly explained by quality parameters MDS, PW and ZT with a marginal contribution (p < 0.1) to MPT and W8. Glu-A3/Gli-A1 alleles displayed a significant contribution (p < 0.01) to TKW and a marginal contribution (p < 0.1) to MDS (Table 2). Interestingly, molecular data established the segregation of Glu-A3c (PG) and Glu-A3b (PO) alleles. Previous data ranks “c” allele as a poor quality donor and “b” allele as good quality donor, being the “c” allele the most frequent for Glu-A3 locus considering wheat germplasm from Argentina (Lerner et al. 2009). Our data showed a subtle contribu- tion (p < 0.1) of Glu-A3 to MDS with lower MDS associated with presence of PO allele (–2.64, Glu-A3c) vs PG (–3.11, Glu-A3b) assuming that lower MDS values are correlated with stronger gluten. Remaining quality parameters MPT, MPH, PW, W8 and ZT were not affected by segregating Glu-A3 alleles (Table 2). In the case of Glu-D3 locus previous SDS-PAGE data described PO as carrying Glu-D3c allele with no information available about PG (Lerner et al. 2009). A recent study based on the development of a novel LMW- GS molecular marker system combined with full-length gene cloning data showed that Glu-D3 genes were extremely conserved among a micro core-collection of Chinese wheat germplasm, in comparison with Glu-A3 and Glu-B3 genes (Zhang et al. 2013). A clustal nucleotide analysis of Glu-D3 sequences obtained from PG and PO against reference sequences from eight Glu-D3 genes previously described (Zhang et al. 2013) showed highest homology values (98.91 to 99.04%) against allelic variants D3-432, D3-441, and D3-444 from D3-441 gene: PG allelic variant showed highest homology with D3-441 and D3-444 (99.04%) and PO with D3-432 (also 99.04%) (Table S4). A further study linking LMW-GS protein bands and gene sequences based on haplotypes agree with partial mo- lecular data and SDS-PAGE scoring for PO obtained in our study (D3-432 and Glu-D3c) as D3-432 is associated with Glu-D3c, and also Glu-D3d, Glu-D3e, Glu-D3i and Glu-D3l (Ibba et al. 2017). In the case of PG D3-444 and D3-441 alleles are associated with Glu- D3a, Glu-D3b, Glu-D3d, Glu-D3f, Glu-D3g, Glu-D3h, Glu-D3j, Glu-D3k and Glu-D3n alleles, therefore it is not possible to elucidate the precise Glu-D3 allele nomination for PG based on current data. Further studies considering an exhaustive characterization of PG Glu-D3 loci with tools like the LMW-GS molecular marker system (Zhang et al.
2011a) combined by sequence data from at least most polymorphic genes, for example
D3-444, D3-525 and D3-586 (Zhang et al. 2013) will provide valuable information for a better understanding of the molecular basis of the contribution to gluten strength associ- ated to Glu-D3 PG allelic variant and the development of diagnostic PCR markers. Even though Glu-D3 markers designed and used in our study were useful for the molecular characterization of segregating Glu-D3 LMW-GS bands in F2 and F3 families obtained from the hybridization PG × PO, our molecular markers are not a diagnostic tool as they can amplify the same PCR fragment from D3-441 and D3-444 genes associated with Glu- D3a, Glu-D3b, Glu-D3d, Glu-D3f, Glu-D3g, Glu-D3h, Glu-D3j, Glu-D3k and Glu-D3n alleles (Figure S1) also see Ibba et al. (2017).
Glu-D3 or Gli-D1?
In our study we found a significant associations between higher values of mixograph pa- rameter MPD and ZT, both positively associated with gluten strength, and the gene-clus- ter Glu-D3/Gli-D1 from PG (Table 4) segregating as a block and explained by close ge- netic linkage between Glu-D3 and ω-gliadins (Singh and Shepherd 1988). The recent release of the wheat genome reference sequence (RefSeq v1.0 https://urgi.versailles.inra.
fr/blast_iwgsc/blast.php) allowed us to precisely determine the physical organization of genes comprising Glu-D3 and Gli-D1 loci in Chinese Spring (Fig. S2). Blast analyses considering sequences from eight Glu-D3 LMW-GS genes previously described (Zhang et al. 2013) confirmed presence of all of them in RefSeq v1.0 differing in the gene order.
The telomeric region of 1DS chromosome arm covering the eight Glu-D3 LMW-GS genes involved nucleotides 84681 to 7156630 (1.57% of the 1D chromosome) and in- cluded one Gli-D1 gene coding for ω-gliadins (nucleotide 492837). Additional Gli-D1 loci were not detected in RefSeq v1.0. Our data confirms the physical linkage between Glu-D3 and Gli-D1 loci and the difficulty to dissect individual contributions of these genes to quality parameters. A possible midterm answer for this question could be found with strategies like exon capture combined with a precise gene annotation of Gli-1 and Glu-3 genes as strategy to capture the genetic variation for these genes in wheat germ- plasm. Moreover and since a breeding point of view, in this study we characterized a novel source of variation improving gluten strength coming from Glu-D3/Gli-D1 storage proteins present in PG. Molecular markers based on PG Glu-D3 sequence (Table S2) and/
or biochemical markers based on CNN pattern trackable by A-PAGE are valuable tools for marker assisted selection of gluten strength from an alternative source different from traditional HMW-GS within breeding programs.
Acknowledgements
This work was supported by the National Institute of Agricultural Technology, INTA Argentina, grant PNCYO1127041. JMC was granted by a National Council for Science and Technology, CONICET Argentina, doctoral fellowship. The authors thank the Inter- national Wheat Genome Sequencing Consortium (IWGSC) for pre-publication access to IWGSC RefSeq v1.0.
References
AACC. 2000. American Association of Cereal Chemists approved methods of analysis 10th ed. St. Paul, MN, Bonafede, M.D., Tranquilli, G., Pflüger, L.A., Peña, R.J., Dubcovsky, J. 2015. Effect of allelic variation at the USA.
Glu-3/Gli-1 loci on breadmaking quality parameters in hexaploid wheat (Triticum aestivum L.). J. Cereal Sci. 62:143–150.
Branlard, G., Dardevet, M. 1985. Diversity of grain proteins and bread wheat quality: I. Correlation between gliadin bands and flour quality characteristics. J. Cereal Sci. 3:329–343.
Branlard, G., Dardevet, M., Saccomano, R. 2001. Genetic diversity of wheat storage proteins and bread wheat quality. Euphytica 119:59–67.
Brody, J.R., Kern, S.E. 2004. Sodium boric acid: A Tris-free, cooler conductive medium for DNA electropho- resis. Biotechniques 36:214–216.
Butow, B.J., Gale, K.R., Ikea, J., Juhász, A., Bedő, Z., Tamás, L., Gianibelli, M.C. 2004. Dissemination of the highly expressed Bx7 glutenin subunit (Glu-B1al allele) in wheat as revealed by novel PCR markers and RP-HPLC. Theor. Appl. Genet. 109:1525–1535.
Caballero, L., Martín, L.M., Alvarez, J.B. 2004. Genetic variability of the low-molecular-weight glutenin subunits in spelt wheat (Triticum aestivum ssp. spelta L. em Thell.). Theor. Appl. Genet. 108:914–919.
D’Ovidio, R., Masci, S. 2004. The low-molecular-weight glutenin subunits of wheat gluten. J. Cereal Sci.
39:321–339.
Espí, A., Rodríguez-Quijano, M., Vázquez, J.F., Carrillo, J.M., Giraldo, P. 2014. Molecular characterization of Glu-B3 locus in wheat cultivars and segregating populations. J. Cereal Sci. 60:374–381.
Gao, X., Appelbee, M.J. Mekuria, G.T., Chalmers, K.J., Mather, D.E. 2012. A second “overexpression” allele at the Glu-B1 high-molecular-weight glutenin locus of wheat: Sequence characterisation and functional effects. Theor. Appl. Genet. 124:333–343.
Gianibelli, M.C., Echaide, M., Larroque, O.R., Carrillo, J.M., Dubcovsky, J. 2002. Biochemical and molecular characterisation of Glu-1 loci in Argentinean wheat cultivars. Euphytica 128:61–73.
Graybosch, R.A. 2001. Uneasy unions: Quality effects of rye chromatin transfers to wheat. J. Cereal Sci.
33:3–16.
Graybosch, R.A., Peterson, C.J., Hansen, L.E., Worrall, D., Shelton, D.R., Lukaszewski, A. 1993. Comparative Flour Quality and Protein Characteristics of 1BL/1RS and 1AL/1RS wheat-rye translocation lines. J. Cereal Sci. 17:95–106.
Hrušková, M., Švec, I., Jirsa, O. 2006. Correlation between milling and baking parameters of wheat varieties.
J. Food Eng. 77:439–444.
Ibba, M.I., Kiszonas, A.M., Guzmán, C., Morris, C.F. 2017. Definition of the low molecular weight glutenin subunit gene family members in a set of standard bread wheat (Triticum aestivum L.) varieties. J. Cereal Sci. 74:263–271.
Khan, K., Hamadar, A., Patek, J. 1985. Polyacrilamide gel electrophoresis for wheat variety identification:
effect of variables on gel properties. Cereal Chem. 62:310–313.
Lerner, S.E., Kolman, M.A., Rogers, W.J. 2009. Quality and endosperm storage protein variation in Argentinean grown bread wheat. I. Allelic diversity and discrimination between cultivars. J. Cereal Sci. 49:337–345.
Lookhart, G.L., Hagman, K., Kasarda, D.D. 1993. High molecular weight glutenin subunits of the most com- monly grown wheat cultivars in the U.S. in 1984. Plant Breed. 110:48–62.
Lukow, O.M., Payne, P.I., Tkachuk, R. 1989. The HMW glutenin subunit composition of Canadian wheat cultivars and their association with bread making quality. J. Sci. Food Agric. 46:451–460.
Martinant, J.P., Nicolas, Y., Bouguennec, A., Popineau, Y., Soulnier, L., Branlard, G. 1998. Relationships between Mixograph parameters and indices of wheat grain quality. J. Cereal Sci. 27:179–189.
Masci, S.M., Porceddu, E., Colaprico, G., Lafiandra, D. 1991. Comparison of the B and D subunits of glutenin encoded at the Glu-D3 locus in two biotypes of the common wheat cultivar Newton with different techno- logical characteristics. J. Cereal Sci. 14:35–46.
Moiraghi, M., Vanzetti, L., Pflüger, L., Helguera, M., Pérez, G.T. 2013. Effect of high molecular weight glu- tenins and rye translocations on soft wheat flour cookie quality. J. Cereal Sci. 58:424–430.
Nakamura, H., Inazu, A., Hirano, H. 1999. Allelic variation in high-molecular-weight glutenin subunit Loci of Glu-1 in Japanese common wheats. Euphytica 106:131–138.
Payne, P.I. 1987. Genetics of wheat storage proteins and the effect of allelic variation on bread-making quality.
Annu. Rev. Plant Physiol. 38:141–153.
Payne, P.I., Nightingale, M.A., Krattiger, A.F., Holt, L.M. 1987. The relationship between HMW glutenin subunit composition and the bread-making quality of British-grown wheat varieties. J. Sci. Food Agric.
40:51–65.
Pflüger, L.A., D’Ovidio, R., Margiotta, B., Peña, R., Mujeeb-Kazi, A., Lafiandra, D. 2001. Characterisation of high- and low-molecular weight glutenin subunits associated to the D genome of Aegilops tauschii in a collection of synthetic hexaploid wheats. Theor. Appl. Genet. 103:1293–1301.
Di Rienzo, J.A., Casanoves, F., Balzarini, M.G., Gonzalez, L., Tablada, M., Robledo, C.W. 2016. InfoStat versión 2016. FCA UNC, Argentina, http://www.infostat.com.ar.
Rogers, W., Payne, P., Harinder, K. 1989. The HMW glutenin subunit and gliadin compositions of German grown varieties and their relationship with bread-making quality. Plant Breed. 103:89–100.
Singh, N.K., Shepherd, K.W. 1988. Linkage mapping of genes controlling endosperm storage proteins in wheat.
Theor. Appl. Genet. 75:628–641.
Untergasser, A., Cutcutache, I., Koressaar, T., Ye, J., Faircloth, B.C., Remm, M., Rozen, S.G. 2012. Primer3- new capabilities and interfaces. Nucleic Acids Res.40:1–12.
Wining, S., Langridge, P. 1991. Identification and mapping of polymorphism in cereals based on polymerase chain reaction. Theor. Appl. Genet. 82:209–216.
Woychik, J.H., Boundy, J.A., Dimler, R.J. 1961. Starch gel electrophoresis of wheat gluten proteins with con- centrated urea. Arch. Biochem. Biophys. 94:477–482.
Zhang, W., Gianibelli, M.C., Rampling, L.R., Gale, K.R. 2004. Characterisation and marker development for low molecular weight glutenin genes from Glu-A3 alleles of bread wheat (Triticum aestivum L). Theor.
Appl. Genet. 108:1409–1419.
Zhang, X., Liu, D., Jiang, W., Guo, X., Yang, W., Sun, J., Ling, H., Zhang, A. 2011a. PCR-based isolation and identification of full-length low-molecular-weight glutenin subunit genes in bread wheat (Triticum aestivum L.). Theor. Appl. Genet. 123:1293–1305.
Zhang, X., Liu, D., Yang, W., Liu, K., Sun, J., Guo, X., Li, Y., Wang, D., Ling, H., Zhang, A. 2011b.
Development of a new marker system for identifying the complex members of the low-molecular-weight glutenin subunit gene family in bread wheat (Triticum aestivum L.). Theor. Appl. Genet. 122:1503–1516.
Zhang, X., Liu, D., Zhang, J., Jiang, W., Luo, G., Yang, W., Sun, J., Tong, Y., Cui, D., Zhang, A. 2013. Novel insights into the composition, variation, organization, and expression of the low-molecular-weight glutenin subunit gene family in common wheat. J. Exp. Bot. 64:2027–2040.
Zhao, H., Wang, R., Guo, A., Hu, S., Sun, G. 2004. Development of primers specific for LMW-GS genes located on chromosome 1D and molecular characterization of a gene from Glu-D3 complex locus in bread wheat. Hereditas 141:193–198.
Electronic Supplementary Material (ESM)
Electronic Supplementary Material (ESM) associated with this article can be found at the website of CRC at https://akademiai.com/loi/0806
Electronic Supplementary Table S1. Analysis of variance for gluten strength (W) and protein content (Protein) based on 18 locations of Regional Yield Trials including bread wheat cultivars Prointa Guazú and Prointa Oasis
Electronic Supplementary Table S2. Amplified loci and primer sequences combinations used in this study Electronic Supplementary Table S3. Glu-A3, Glu-D3 and Gli-D1 protein composition for F3 families devel-
oped in the present study
Electronic Supplementary Table S4. Percent Identity Matrix obtained from Glu-D3 gene sequences Electronic Supplementary Figure S1. CLUSTAL O multiple sequence alignment from Glu-D3 sequences used
in this study. Prointa Guazú and Prointa Oasis Glu-D3 Primer sequences are in bold and underlined Electronic Supplementary Figure S2. Physical organization of Gli-D1 and Glu-D3 loci in the telomeric region of 1D chromosome. At the bottom, chromosome arms are represented as black bars and centromere as blue oval. The extreme telomeric portion of the short chromosome arm (in red) is expanded to display in the upper portion of the figure Gli-D1 and Glu-D3 loci: from left to right accesion numbers, (1) FJ755315.1, JF339160.1, JX878083.1, Gua-Glu-D3, Oas-Glu-D3, FJ755316.1, JX878006.1, (2) Gli-D1, (3) JX878236.1, JX877778.1, (4) FJ755312.1, (5) JX877792.1, JX878008.1, JX878087.1, JX878053.1, JX878151.1, (6) JF339162.1, JF339178.1, JX877918.1, (7) JF339174.1, JX878225.1. Gua-Glu-D3 and Oas-Glu-D3 are sequences obtained from PCR fragments amplified from ‘Prointa Guazú’ and ‘Prointa Oasis’ genomic DNA using Glu-D3 specific
primers described in Table S2