P R I M A R Y R E S E A R C H P A P E R
Realized ecological niche-based occupancy–abundance patterns of benthic diatom traits
Edina Lengyel .Bea´ta Szabo´.Csilla Stenger-Kova´cs
Received: 30 March 2020 / Revised: 24 May 2020 / Accepted: 3 June 2020 / Published online: 13 June 2020 ÓThe Author(s) 2020
Abstract Nowadays, when aquatic habitats are threatened by human and climatic disturbances lead- ing to reductions in biodiversity and ecosystem functions, the study of the abundance–occupancy relationships of species traits and their underlying mechanisms is of great importance to future conser- vation management. To study the distribution patterns of benthic diatom traits, lakes were sampled during the summer and early autumn. Niche breadth, niche position (NP), regional occupancy and local abun- dances (LAs) of benthic diatom traits and their combinations were determined along different envi- ronmental gradients. Benthic diatom traits were iden- tified in all possible niche types (14% non-marginal–
narrow, 37% non-marginal–broad, 8% marginal–nar- row and 41% marginal–broad niche). On the basis of increased niche differentiation, it is possible to achieve an improved and more effective utilization of the eco-morphological concept of diatom traits. The relationships between the occupancy, abundance and niche characteristics suggest that the broader the
niche, the wider the distribution and the greater the LA; the more marginal the NP, the more restricted spatially the distribution and the lower the LA. With regard to the key factors driving the occupancy of benthic diatom traits in lentic ecosystems, the NP hypothesis proves to be the best predictor of its variation.
Keywords Niche breadthNiche positionLentic ecosystemDistribution
Introduction
In recent years, the acceleration of ecosystem degra- dation, together with a rapid and continuous decline in the Earth’s biodiversity, may be observed. These phenomena are caused by anthropogenic disturbances and climate change (Butchart et al.,2010), and by the fragmentation and homogenization of habitats (Bal- vanera et al., 2006; Cardinale et al., 2012), both of which exercise considerable influence on species distribution. Generally speaking, species distribution depends on an array of different factors, such as local environmental conditions, species dispersal and spe- cies interactions (Leibold et al.,2004). The success of a particular species is closely related to and dependent on its traits and tolerance (e.g. phenotypic plasticity by widening the ecological niche; Nicotra et al.,2010);
Handling Editor: Judit Padisa´k E. Lengyel (&)C. Stenger-Kova´cs
Department of Limnology, University of Pannonia, Egyetem u. 10, Veszpre´m 8200, Hungary e-mail: lengyele@almos.uni-pannon.hu B. Szabo´
Centre for Ecological Research, Balaton Limnological Institute, Klebelsberg Kuno u. 3, Tihany 8237, Hungary https://doi.org/10.1007/s10750-020-04324-9(0123456789().,-volV)( 0123456789().,-volV)
these are also recognized as key features in the spread of invasive species (Stachowicz et al.,1999; Gurvich et al., 2005). An understanding of the mechanisms underlying and driving distribution patterns is a key question in a situation, where the maintenance of ecosystem functions and services is the primary and urgent task of the day.
At the species level, a positive relationship between local mean abundance and regional distribution has been identified and recognized as the main macroe- cological pattern in the case of a variety of organisms (e.g. Gaston et al., 2000; Gaston,2003; Tales et al., 2004; Soininen & Heino, 2005; Heino & Virtanen, 2006; Frisk et al.,2011; Heino & Gro¨nroos,2014); a number of ecological hypotheses (including both sampling artefacts and real ecological-based ones) have been devised to account (summarized by Heino 2005). Among them, metapopulation dynamics and niche differentiation [niche breadth (NB) and position hypothesis] have come to be regarded as among the most powerful ecological notions concerning the influence of species distribution (e.g. Soininen &
Heino,2005; Rocha et al.,2018; Teittinen et al.,2018;
Vilmi et al.,2019). On the basis of the NB hypothesis (Brown, 1984), species with a wider tolerance range are regarded as generalist, and assumed to be more widespread. According to the niche position (NP) hypothesis (Hanski, 1993; Venier & Fahrig, 1996), species can be found in average (non-marginal posi- tion, meaning high habitat availability) or extreme (marginal position, meaning low habitat availability) environmental conditions, and this, in turn, results in different distributions of species: the higher the habitat availability, the wider the distribution. Metapopula- tion dynamics (Hanski, 1993, 1994) assumes that locally abundant species will have wider distribution due to their ability to colonize empty habitats and consequently, rescue their other populations.
Most of the research in aquatic sciences has focused on the distribution–occupancy relationships of species (e.g. Tales et al., 2004; Heino, 2005; Soininen &
Heino,2005; Heino & Soininen,2006; Siqueira et al., 2009; Tonkin et al.,2016; Rocha et al.,2018), while trait-based functional studies are relatively rare, having begun only relatively recently (such as Heino
& Gro¨nroos,2014; Heino & de Mendoza,2016; Heino
& Tolonen, 2018; Teittinen et al., 2018; Soininen et al.,2019; Vilmi et al.,2019). Functional approaches are very important, since a species’ contribution to
ecosystem functions is closely related to its functional traits (e.g. de Bello et al.,2010; Villna¨s et al.,2018).
The maintenance of ecosystem stability, functions and consequent services can be achieved by balancing compensatory processes of traits against some level of species loss (Walker, 1992; Walker,1995). In addi- tion, most of the niche-based researches related to lotic rather than lentic ecosystems generating further lack in this field. In turn, the process forming occupancy–
abundance relationship in lentic ecosystem is less complex than in lotic systems which could result in clearer patterns (Dent et al.,2002; Vilmi et al.,2019).
Diatoms are the key organisms in recent research focusing on the occupancy–abundance relationship in aquatic ecosystems (e.g. Soininen & Heino, 2005;
Heino & Soininen,2006; Rocha et al.,2018; Teittinen et al.,2018; Vilmi et al.,2019). Diatoms form a major algal group in both lotic and lentic environments, and are commonly the key organisms of phytobenthos in ecological status assessments (Stevenson & Pan, 1999). Additionally, diatoms have numerous advan- tages which make them good target organisms: they present a widespread and diverse group; they play a key role in food webs, primary production and the biogeochemical cycle; they are good bioindicators;
and they are also relatively easy to examine (e.g.
Stevenson & Pan,1999). Finally, diatoms are affected directly and indirectly by an array of environmental factors, such as pH, conductivity, nutrients (nitrogen and phosphorous), silica, temperature and habitat size (e.g. Stenger-Kova´cs et al.,2014; Lengyel et al.,2016;
Bolgovics et al.,2019).
The primary aim of the present study is to recognize the distribution patterns of a major aquatic group in the hope of overcoming the previously mentioned short- comings in this field. Therefore, to investigate the drivers of regional occupancy (RO) of functional diatom traits in lentic ecosystems, (i) niche character- istics (NP and NB) were determined along the main environmental gradients, and (ii) the local abundance (LA) of each trait was also specified. On the basis of recent and applied trait categories, some general assumptions were made. These were as follows:
(i) Higher niche differentiation (in terms of NB, as well as position) will be found in the case of combined traits than in that of the simple trait categories;
(ii) As in species-based studies, positive relation- ships may be predicted between RO and local mean abundances of traits;
(iii) Diatom traits will be clearly distinguishable into generalist/specialist and marginal/non- marginal traits on the basis of their niche.
Material and methods
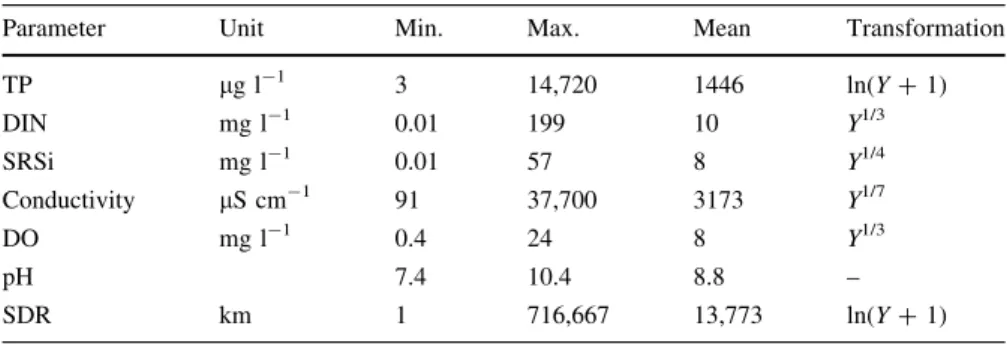
Altogether, 200 samples were collected from different lentic ecosystems between 2006 and 2017: 99 samples from soda pans, and 101 samples from freshwater lakes in Hungary and Germany. Sampling was restricted to the summer and early autumn period to eliminate the effects of seasonality. The lakes can be characterized by a broad range of their salinity (from freshwater to hyposaline), their trophic state (from oligo- to hypertrophic), their pH (from neutral to highly alkaline) and water body size (from shallow to deep with differing extents, Table1).
Water temperature (°C), pH, conductivity (lS cm-1), and dissolved oxygen (mg l-1) were measured in situ using a portable multimeter. In order to study the effect of lake size, the area–depth ratio (SDR) was used, obtained on the basis of OVF (General Direc- torate of Water Management, 2015; http://www.ovf.
hu/en/) and Szabo´ et al. (2017). In the laboratory, the concentrations of dissolved inorganic nitrogen (DIN, as the sum of nitrite, nitrate and ammonium, mg l-1), total phosphorus (TP, lg l-1) and soluble reactive silica (SRSi, mg l-1) were determined using spec- trophotometric methods, according to APHA (1998).
Benthic diatom communities were collected from the most characteristic substrates (mud in soda pans, stone in Lake Stechlin and reed in other lakes).
Samples were preserved in ethanol and prepared using
the hot hydrogen-peroxide method (Comite´ Europe´en de Normalisation, CEN, 2003); the diatom valves were then embedded in a mounting resin. At least 400 diatom valves were identified at species level under a light microscope (1,0009magnification, plan-apoc- hromat lens with DIC, Zeiss Axiovert 1) and the use of up-to-date taxonomic books. Each species was clas- sified by trait, employing diatom ecological guilds (Passy, 2007; Rimet & Bouchez, 2012b). Diatoms were classified further according to their morpholog- ical traits (Rimet & Bouchez,2012a) on the basis of their biovolume (S) and length/width ratio (LW).
Besides the basic traits, the various combinations of the traits were also investigated, following the eco- morphological concept found in B-Be´res et al. (2016).
The traits used in the present study are detailed in Table 2.
RO (% sample number, in where the given trait is presented) and mean LA (% average relative abun- dances of a given trait counted within a sample) were calculated for each diatom trait. NP (the distance between the average habitat conditions used by a species and the average habitat conditions of the studied region) and NB (index of tolerance to envi- ronmental conditions) for each trait and their combi- nations were determined by outlying mean index (OMI) analyses (Dole´dec et al.,2000). To distinguish the niches (non-marginal/marginal and narrow/broad niches), a corresponding percentage of variability set at 15% was employed, as in Dole´dec et al. (2000).
Monte-Carlo test using 1,000 random permutation was implemented for statistical significance comparing the observed species’ marginality and the simulated values. Before the analyses, in order to obtain a normal distribution, the transformation of the data was carried out: Hellinger transformation for diatoms, and further transformations (see Table 1) for environmen- tal variables. For the principal component analyses
Table 1 Main limnological parameters of the studied lakes and their applied transformations in the statistical analyses
Parameter Unit Min. Max. Mean Transformation
TP lg l-1 3 14,720 1446 ln(Y?1)
DIN mg l-1 0.01 199 10 Y1/3
SRSi mg l-1 0.01 57 8 Y1/4
Conductivity lS cm-1 91 37,700 3173 Y1/7
DO mg l-1 0.4 24 8 Y1/3
pH 7.4 10.4 8.8 –
SDR km 1 716,667 13,773 ln(Y?1)
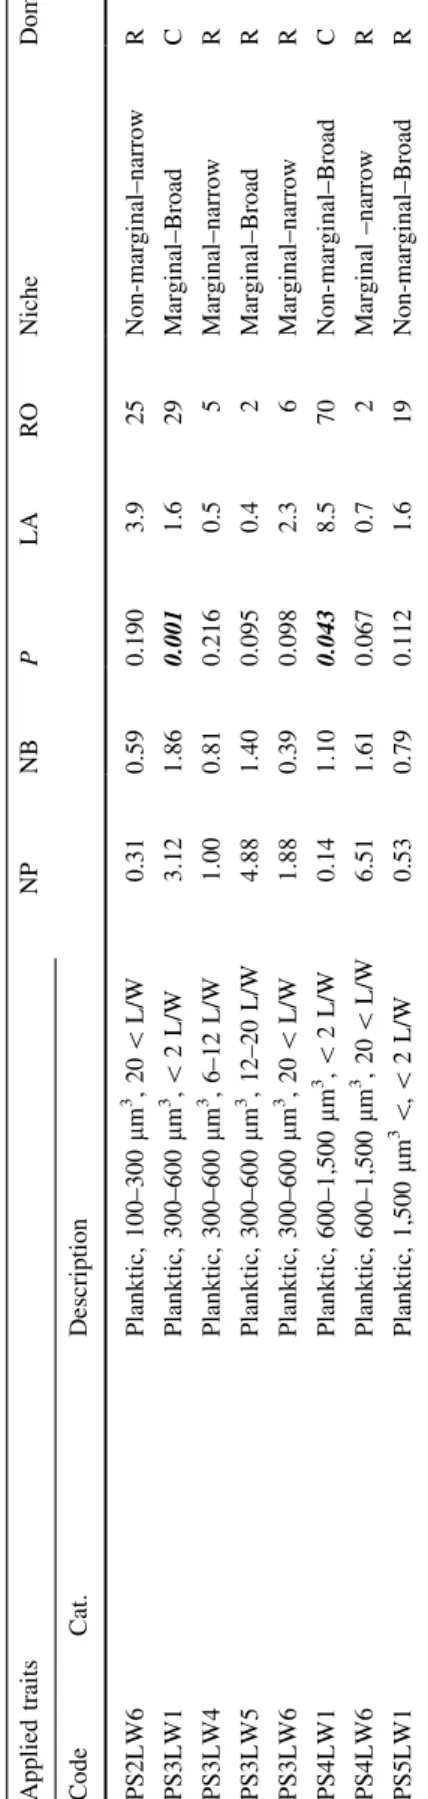
Table2Detailedfeaturesofthestudiedbenthicdiatomtraits(code,cat.:traitcategorytowherethetraitsbelong,description:meaningoftheappliedtraits),theresultsofOMI analyses(NPoutlyingmeanindex,NBtoleranceindex,PsignificancevaluesofMonte-Carlotest[significantvaluesareinbolditalic]),regionaloccupancy(RO,%),meanlocal abundance(LA,%),ecologicalnichetype(niche)anddominance(dom.,Wwidespread,Ccommon,Rrare)ofeachtrait AppliedtraitsNPNBPLARONicheDom. CodeCat.Description HGuildsHighprofile0.412.120.0019.781Non-marginal–BroadW LLowprofile0.852.950.00129.791Non-marginal–BroadW MMotile0.183.050.00158.2100Non-marginal–BroadW PPlanktic0.450.920.00210.769Non-marginal–BroadC LW1Morphologicaltraits (length:widthratio)\2L/W0.292.450.00115.087Non-marginal–BroadW LW22–4L/W0.273.190.00124.797Non-marginal–BroadW LW34–6L/W0.022.780.00141.999Non-marginal–BroadW LW46–12L/W0.133.840.00117.198Non-marginal–BroadW LW512–20L/W0.100.870.1341.856Non-marginal–narrowC LW620\L/W0.130.510.0307.156Non-marginal–narrowC S1Morphologicaltraits (biovolume)\100lm3 0.083.800.00232.498Non-marginal–BroadW S2100–300lm3 0.062.910.00128.699Non-marginal–BroadW S3300–600lm30.012.370.26116.796Non-marginal–BroadW S4600–1,500lm30.152.070.00110.989Non-marginal–BroadW S51,500lm3 \0.041.520.00115.197Non-marginal–BroadW HS1LW1Eco-morphological traits(combinations ofthemorphological traitsandguilds)
High,\100lm3 ,\2L/W7.040.000.4121.01Marginal–narrowR HS1LW2High,\100lm3 ,2–4L/W3.251.260.0473.13Marginal–narrowR HS1LW3High,\100lm3 ,4–6L/W0.250.930.2693.327Non-marginal–BroadC HS1LW4High,\100lm3 ,6–12L/W1.673.860.0033.813Marginal–BroadR HS2LW1High,100–300lm3 ,\2L/W4.190.970.0071.65Marginal–narrowR HS2LW2High,100–300lm3,2–4L/W0.801.180.1221.612Marginal–BroadR HS2LW3High,100–300lm3,4–6L/W0.031.420.6995.568Non-marginal–BroadC HS2LW4High,100–300lm3,6–12L/W2.423.450.00115.062Marginal–BroadC HS2LW5High,100–300lm3 ,12–20L/W0.770.880.2030.98Non-marginal–BroadR
Table2continued AppliedtraitsNPNBPLARONicheDom. CodeCat.Description HS2LW6High,100–300lm3 ,20\L/W1.090.620.5350.33Marginal–BroadR HS3LW2High,300–600lm3 ,2–4L/W1.301.020.0011.940Marginal–BroadC HS3LW3High,300–600lm3 ,4–6L/W0.400.500.0282.231Non-marginal–narrowC HS3LW4High,300–600lm3 ,6–12L/W0.500.890.0171.027Non-marginal–narrowC HS4LW1High,600–1,500lm3,\2L/W2.771.160.0490.54Marginal–BroadR HS4LW2High,600–1,500lm3,2–4L/W2.132.370.0011.229Marginal–BroadC HS4LW3High,600–1,500lm3 ,4–6L/W0.671.310.0019.157Non-marginal–BroadC HS4LW4High,600–1,500lm3 ,6–12L/W0.830.350.0762.517Marginal–narrowR HS4LW5High,600–1,500lm3 ,12–20L/W6.042.410.0361.33Marginal–BroadR HS5LW2High,1,500lm3 \,2–4L/W0.851.490.0034.236Marginal–BroadC HS5LW3High,1,500lm3 \,4–6L/W0.530.520.0082.631Non-marginal–narrowC HS5LW4High,1,500lm3 \,6–12L/W0.412.980.0081.130Non-marginal–BroadC HS5LW5High,1,500lm3\,12–20L/W0.190.590.3172.128Non-marginal–narrowC HS5LW6High,1,500lm3\,20\L/W1.090.880.0032.227Marginal–BroadC LS1LW1Low,\100lm3,\2L/W10.961.130.0013.615Marginal–narrowR LS1LW2Low,\100lm3 ,2–4L/W2.773.420.00111.149Marginal–BroadC LS1LW3Low,\100lm3 ,4–6L/W3.062.540.00114.948Marginal–BroadC LS2LW1Low,100–300lm3 ,\2L/W1.650.120.3534.69Marginal–narrowR LS2LW2Low,100–300lm3 ,2–4L/W0.151.260.0492.861Non-marginal–BroadC LS2LW3Low,100–300lm3,4–6L/W1.150.950.0014.128Marginal–BroadC LS2LW4Low,100–300lm3,6–12L/W1.400.380.7791.72Marginal–narrowR LS3LW1Low,300–600lm3,\2L/W1.190.950.0192.515Marginal–BroadR LS3LW2Low,300–600lm3 ,2–4L/W1.393.820.0012.851Marginal–BroadC LS3LW3Low,300–600lm3 ,4–6L/W0.590.830.0041.831Non-marginal–narrowC LS3LW4Low,300–600lm3 ,6–12L/W3.821.710.0011.626Marginal–BroadC LS4LW1Low,600–1,500lm3 ,\2L/W8.032.940.0011.07Marginal–BroadR LS4LW2Low,600–1,500lm3 ,2–4L/W0.440.720.0102.035Non-marginal–BroadC LS4LW3Low,600–1,500lm3,4–6L/W1.311.020.0463.313Marginal–BroadR LS5LW1Low,1,500lm3\,\2L/W2.511.530.0016.241Marginal–BroadC LS5LW2Low,1,500lm3\,2–4L/W0.690.880.0022.638Non-marginal–narrowC LS5LW3Low,1,500lm3 \,4–6L/W1.491.100.0400.89Marginal–BroadR
Table2continued AppliedtraitsNPNBPLARONicheDom. CodeCat.Description MS1LW1Motile,\100lm3 ,\2L/W0.840.340.1892.610Marginal–narrowR MS1LW2Motile,\100lm3 ,2–4L/W0.171.080.1723.140Non-marginal–BroadC MS1LW3Motile,\100lm3 ,4–6L/W3.233.240.0011.831Marginal–BroadC MS1LW5Motile,\100lm3 ,12–20L/W1.071.350.0650.89Marginal–BroadR MS2LW1Motile,100–300lm3,\2L/W1.390.710.0104.49Marginal–narrowR MS2LW2Motile,100–300lm3,2–4L/W3.783.250.0014.742Marginal–BroadC MS2LW3Motile,100–300lm3 ,4–6L/W1.911.200.0015.038Marginal–BroadC MS2LW4Motile,100–300lm3 ,6–12L/W0.340.460.0184.846Non-marginal–narrowC MS2LW5Motile,100–300lm3 ,12–20L/W1.431.780.0080.813Marginal–BroadR MS2LW6Motile,100–300lm3 ,20\L/W2.250.210.2620.92Marginal–narrowR MS3LW1Motile,300–600lm3 ,\2L/W2.970.000.8261.81Marginal–narrowR MS3LW2Motile,300–600lm3 ,2–4L/W0.100.720.2432.957Non-marginal–narrowC MS3LW3Motile,300–600lm3,4–6L/W0.312.350.00111.989Non-marginal–BroadW MS3LW4Motile,300–600lm3,6–12L/W1.790.880.0013.024Marginal–narrowR MS3LW5Motile,300–600lm3,12–20L/W0.773.060.2590.36Non-marginal–BroadR MS4LW1Motile,600–1,500lm3 ,\2L/W0.620.660.5320.95Non-marginal–narrowR MS4LW2Motile,600–1,500lm3 ,2–4L/W0.171.060.0333.054Non-marginal–BroadC MS4LW3Motile,600–1,500lm3 ,4–6L/W0.283.010.0016.083Non-marginal–BroadW MS4LW4Motile,600–1,500lm3 ,6–12L/W2.813.470.0011.642Marginal–BroadC MS4LW5Motile,600–1,500lm3,12–20L/W1.562.710.0200.77Marginal–BroadR MS4LW6Motile,600–1,500lm3,20\L/W0.510.510.0094.627Non-marginal–narrowC MS5LW1Motile,1,500lm3\,\2L/W0.771.000.0509.514Non-marginal–BroadR MS5LW2Motile,1,500lm3 \,2–4L/W0.041.200.4335.777Non-marginal–BroadW MS5LW3Motile,1,500lm3 \,4–6L/W0.352.100.0024.661Non-marginal–BroadC MS5LW4Motile,1,500lm3 \,6–12L/W0.221.020.0193.752Non-marginal–BroadC MS5LW5Motile,1,500lm3 \,12–20L/W1.362.160.1190.98Marginal–BroadR MS5LW6Motile,1,500lm3 \,20\L/W0.600.410.0274.522Non-marginal–narrowR PS1LW1Planktic,\100lm3,\2L/W0.630.370.2231.19Non-marginal–narrowR PS1LW4Planktic,\100lm3,6–12L/W2.770.140.5180.61Marginal–narrowR PS2LW1Planktic,100–300lm3,\2L/W1.641.880.0082.213Marginal–BroadR PS2LW4Planktic,100–300lm3 ,6–12L/W1.691.520.4241.52Marginal–BroadR
(PCA), the environmental parameters were standard- ized. Linear regression models were run to examine the relation between the niche parameters (NB and NP), the distributions and the mean LA of traits. Prior to the analyses, log transformation (log(x?1)) was used to improve the degree of normality. Variation partitioning was employed to reveal the importance of individual and shared effects of the three explanatory variables (such as NP, NB and mean LA) on the regional distribution of the different traits. All statis- tical analyses were performed in the 3.4.3 version of R statistical software (Team, 2010) using the vegan (Oksanen et al.,2012), ade4 (Bougeard & Dray,2018), adegraphics (Dray & Siberchicot,2018) and subniche packages (Karasiewicz et al.,2017).
Results
In the total of 200 samples, altogether 463 diatom species were identified belonging to 4 ecological guilds, 5 size traits, 6 LW traits and their 79 combined groups. On the basis of the OMI analysis, axis 1 and axis 2 were the most important axes, together explaining 68.84% of the variance in the abundance of the traits. The major variables were conductivity, TP, DIN for axis 1, while these for axis 2 were pH and SRSi (Fig.1).
Table2continued AppliedtraitsNPNBPLARONicheDom. CodeCat.Description PS2LW6Planktic,100–300lm3 ,20\L/W0.310.590.1903.925Non-marginal–narrowR PS3LW1Planktic,300–600lm3 ,\2L/W3.121.860.0011.629Marginal–BroadC PS3LW4Planktic,300–600lm3 ,6–12L/W1.000.810.2160.55Marginal–narrowR PS3LW5Planktic,300–600lm3 ,12–20L/W4.881.400.0950.42Marginal–BroadR PS3LW6Planktic,300–600lm3,20\L/W1.880.390.0982.36Marginal–narrowR PS4LW1Planktic,600–1,500lm3,\2L/W0.141.100.0438.570Non-marginal–BroadC PS4LW6Planktic,600–1,500lm3 ,20\L/W6.511.610.0670.72Marginal–narrowR PS5LW1Planktic,1,500lm3 \,\2L/W0.530.790.1121.619Non-marginal–BroadR
Fig. 1 Principal component analysis (PCA) of the measured environmental parameters (cond conductivity,DINdissolved inorganic nitrogen,DO dissolved oxygen,SDR surface:depth ratio,SRSisoluble reactive silica,TPtotal phosphorus)
The NP and NB of each trait, as well as their RO and mean LA are summarized in Table2. The inertia of the traits varied from 2.9 to 12.6. Among the 94 diatom traits only 63 (= 67%) traits proved to be having significant OMI values, to which the further analysis of niche parameters was restricted. Almost the half of the diatom traits (51%) can be characterized as occupying a non-marginal position (e.g. H, LW1, S1, MS3LW3), while 49% were found to be in a marginal position (e.g. LS3LW1, PS2LW1). On the basis of the NB values, 22% of the traits occupied a narrow niche (e.g. HS3LW4, MS4LW6, LS1LW1), and 78% a broad one (e.g. M, LW1, MS4LW5).
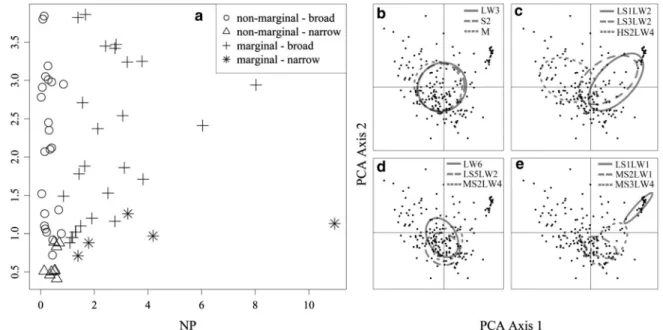
Considering the combinations of NP and NB, it was found that 14% of the traits had a non-marginal position and narrow niche, 37% a non-marginal position and broad niche (Fig.2). A further 5 diatom traits (8%) occupied niches which were both marginal and narrow, and 26 traits (41%) niches which were marginal and broad (Fig.2).
The RO of the traits ranged from 1% (e.g.
HS1LW1) to 100% (M), 40 traits were rare (MS3LW4, PS3LW4), 39 common (P, LW5, LW6) and 15 widespread (e.g. H, L, M, LW1–4, S1–5) (Table2). The mean LA varied between 0.3% (such as HS2LW6, MS3LW5) and 58.2% (M). With regard to
the relationship between these parameters (LA, RO), the RO proved to be positively and significantly related to mean LA (Fig. 3). NP was strongly and negatively related to occupancy (R2= 0.42 andP\ 0.0001), and to the LA (R2= 0.21 andP\0.0001) of
Fig. 2 Distribution of benthic diatom traits on the basis of their ecological niche types (a) and the ecological niches of the three most widespread diatom traits (for trait codes see Table2) found
in each niche type (b non-marginal/broad,cmarginal/broad, dnon-marginal/narrow,emarginal/narrow)
Fig. 3 Relationship between the proportion of regional occu- pancy and mean local abundance of benthic diatom traits (R2= 0.53 andP\0.0001) (axes are on logarithmic scales)
the traits (Fig.4). NB showed a significant but weak- positive relationship to the occupancy (R2= 0.06 and P= 0.03) and LA (R2= 0.11 andP= 0.005) of the traits (Fig.4).
As a result of the variation partitioning, NP was the most important variable accounting for variation in occupancy (individual effect: 16%), followed by mean LA (individual effect: 11%), whilst NB only had minor effects on it (individual effect: 2%) (Fig.5).
The greater part of the variation was shared between these explanatory variables, particularly between NP and mean LA (their shared effect: 31%), as well as between NB and mean LA (their shared effect: 12%).
Nevertheless, 35% of variation in occupancy remained unexplained by the variables studied here.
Discussion
Similarly to other organisms, diatoms living in every type of aquatic environment are facing climatic changes, variations in environmental conditions, increases in environmental stress and vanishing habi- tat (e.g. Dokulil et al.,2010; Mitsch, 2013; Lengyel et al.,2020). Since the success of the various species is closely related to their traits, the investigation of their abundance–occupancy relationship and the underlying Fig. 4 Relationships between niche parameters and regional occupancy (a,b) and mean local abundance (c,d) of benthic diatom traits (axes are on logarithmic scales)
Fig. 5 Partitioning of variation in the occupancy of benthic diatom traits between the three explanatory variables (NPniche position, NB niche breadth, LA mean local abundance).
Individual and shared fractions are shown as percentages of total variation on the basis of adjustedR2values
mechanism are very important in the making of future projections and the formulation of suitable conserva- tion plans to maintain biodiversity and ecosystem functions. This study provides fresh information about the distribution patterns of the diatom traits in lake ecosystems on the basis of the most typical determi- nant environmental parameters.
The few existing examples of research focusing on trait-based approaches have concluded that biological traits—mainly size and life-forms—can affect occu- pancy and/or abundance (Verberk et al.,2010; Passy, 2012; Heino & Gro¨nroos,2014; Rocha et al.,2018):
colonial and attached species tended to be more abundant and widespread than non-colonial and non- attached species (Heino & Soininen, 2006; Passy, 2016). Additionally, species of similar size and displaying similar life forms tend to display similar occupancies and abundance (Rocha et al.,2018; Vilmi et al., 2019). As far as organisms with a passive dispersal ability (such as diatoms) are concerned, cell size is generally negatively related to distribution due to the ability of small species to maintain larger populations, to produce more propagules, to achieve more effective dispersion, to be better competitors for all nutrients and to have better resource utilization (Kristiansen,1996; Soininen & Heino,2005; Heino &
Soininen, 2006; Edwards et al.,2011; Passy, 2012).
The results of the present study show up a disparate niche differentiation between the different trait cate- gories. The simple, non-combined trait categories (such as guilds, biovolume and length/width ratio) have a great degree of overlap in their niches (inertia varied between 5.1 and 7.8), implying their decreased niche differentiation. Although the categorization of the main traits was based on clear and significant features, such as differences in nutrient uptake ability or resistance to physical disturbances due to the growth form of guilds (e.g. Passy, 2007), these separations do not appear to be sufficient to be reflected in their degree of niche differentiation.
Almost all categories can be characterized as occupy- ing a niche which is both central and broad, with high abundance leading to negligible effects on the differ- ent distributions (all of them are widespread or common) found in present study. Similar results have been arrived at by other researchers: the distribution of subarctic diatom species differed only slightly between life-forms (like motile, adnate, pedunculate and colonial forms), and not at all between guilds
(Teittinen et al., 2018); furthermore, the biological traits of stream insects also seemed to be unimportant in the degree of predictability of species distribution (Heino & de Mendoza, 2016; Heino & Tolonen, 2018). Instead of the main trait categories, the better and more effective utilization of the eco-morpholog- ical concept of diatom traits (B-Be´res et al.,2016) is presented in a way similar to that found in some recent research (e.g. B-Be´res et al., 2016; Stenger-Kova´cs et al.,2018), since smaller amount of overlap in their niches was found (inertia varied from 2.9 to 12.6), implying an increased niche differentiation between them.
With regard to the driving factors of the distribution patterns of functional traits, as has been the case in other species-based studies focusing on a variety of organisms (e.g. Soininen & Heino,2005; Rocha et al., 2018; Teittinen et al., 2018; Vilmi et al., 2019) the results presented here show that (i) the relationship between occupancy and abundance is significantly positive, and (ii) the regional occurrence of the functional traits of diatoms is related to niche charac- teristics (such as NP and NB) and LA s, respectively.
A positive relation with NB suggests that generalist functional traits (that is, those having a broad tolerance range) had wider distribution and were locally more abundant than specialist traits (those having a narrow tolerance range). A negative relationship with NP implies that traits characterized by a marginal NP tend to be less widely distributed and less locally abundant than traits in non-marginal positions. As has been previously reported, the findings of the present study generally agree on the importance of niche character- istics in distribution and LA (e.g. Heino,2005; Heino
& Soininen, 2006; Heino & Gro¨nroos,2014; Rocha et al., 2018; Teittinen et al., 2018). Only a few researchers have concluded that niche characteristics are not suitable predictors of LA, due to their more stochastic nature and proneness to error than is the case with occupancy (e.g. Heino & Gro¨nroos,2014;
Tonkin et al.,2016; Rocha et al.,2018). Also as in the present study, it has been found that niche-based mechanisms can dominate and be significant in a positive occupancy–abundance relationship in cases where multiple-drainage environments with steep environmental gradients (Passy, 2012) are examined on the regional scale (Bra¨ndle & Brandl, 2001).
Nevertheless, in the case of diatom traits, besides niche characteristics, LA is also a key factor in driving
their occupancy in lentic ecosystems. The possibility of time-dependent dispersal in relatively isolated habitats such as lakes situated in different drainage basins, together with the passive propagation of diatoms leads to an assumption of the negligible effects of metapopulation dynamics on the basis of the conclusions of Heino & Gro¨nroos (2014). In contrast to this, the results arrived at here using the trait-based approach reinforce the conclusions of earlier studies, including those conducted in the same region and focusing on benthic diatom species, in which meta- community dynamics were recognized in the form of a mass-effect concept (Szabo´ et al.,2019) and species- sorting (Szabo´ et al.,2018).
On the basis of the individual contributions of the ecological theories studied here, the NP hypothesis is the best predictor of variation in occupancy of diatom traits, followed by metapopulation dynamics and finally the NB hypothesis. The occupancy patterns observed here—that the NP hypothesis overrode the NB—are in accordance with general ecological find- ings (e.g. Tales et al., 2004; Heino, 2005; Heino &
Soininen,2006; Rocha et al.,2018) and are likely to be dependent on spatial extents. Sites belonging to different catchments allow the presence of more non-marginal niches, and therefore lead to the justi- fication of the NP hypothesis, while within one catchment NB is usually more important than NP, due to the possibility of the real separation of generalist and specialist characteristics (Heino,2005;
Siqueira et al., 2009; Heino & Gro¨nroos, 2014).
Therefore, the greater predictive power of NB over NP has rarely been encountered in studies focusing distribution patterns, such as in the case of diatom species in subarctic ponds (Teittinen et al.,2018).
The results of the present study carry important ecological significance from the point of view of conservation. On the basis of recent trait-based research, some diatom traits can indeed be used as indicators of environmental changes: motile, small sized diatom traits with lower LW categories for higher conductivity (Stenger-Kova´cs et al.,2018), and low-profile diatom traits with small cell size and lower LW categories for a healthy ecological status in streams (Stenger-Kova´cs et al., 2020). These trait combinations are usually characterized by a marginal NP, and their distribution is limited due to the key driving role of NP in the occupancy patterns of diatom traits. A marginal position is often associated with
rarity, and therefore, these traits are more vulnerable to human- or climate-induced environmental changes (as well as being potential victims of extension) than widespread or non-marginal traits. The preservation of these diatom traits is very important for the future, and may be achieved by, for instance, the extension of protected status to a wide range of habitat conditions, since aside from their importance in ecological status assessments, less common traits may have significant effects on invasion events, or on the maintenance of ecosystem function and stability, as has already been concluded to be the case in terrestrial and marine ecosystems (Lyons & Schwartz,2001; Ellingsen et al., 2007).
Acknowledgements Open access funding provided by University of Pannonia (PE). We thank Attila Pellinger, Andra´s Ambrus, Ga´bor Taka´cs, Pe´ter Kugler (Fert}o-Hansa´g Hungarian National Park), and Tama´s Sa´pi, Csaba Pignicki, Sa´ndor Kova´cs (Kiskunsa´gi Hungarian National Park) for their assistance in the sampling. We also thank the current and former colleagues and students of the Department of Limnology (University of Pannonia) for the field sampling and laboratory analyses. Special thanks to Paul Thatcher for proofreading. This study was supported by the Hungarian National Science Foundation (OTKA K81599), The National Research Development and Innovation Office (NKFIH K120595), The Sze´chenyi 2020 under the EFOP 3.6.1-16-2016-00015. This research was supported from the Higher Educational Institutional Excellence Program 2019 the Grant of the Hungarian Ministry for Innovation and Technology (Grant Number NKFIH-1158-6/2019).
Open Access This article is licensed under a Creative Com- mons Attribution 4.0 International License, which permits use, sharing, adaptation, distribution and reproduction in any med- ium or format, as long as you give appropriate credit to the original author(s) and the source, provide a link to the Creative Commons licence, and indicate if changes were made. The images or other third party material in this article are included in the article’s Creative Commons licence, unless indicated otherwise in a credit line to the material. If material is not included in the article’s Creative Commons licence and your intended use is not permitted by statutory regulation or exceeds the permitted use, you will need to obtain permission directly from the copyright holder. To view a copy of this licence, visit http://creativecommons.org/licenses/by/4.0/.
References
APHA, 1998. Standard Methods for the Examination of Water and Wastewater, 20th ed. United Book Press, Baltimore.
Balvanera, P., A. B. Pfisterer, N. Buchmann, J. S. He, T.
Nakashizuka, D. Raffaelli & B. Schmid, 2006. Quantifying
the evidence for biodiversity effects on ecosystem func- tioning and services. Ecology Letters 9: 1146–1156.
B-Be´res, V., A´ . Luka´cs, P. To¨ro¨k, Z. Ko´kai, Z. Nova´k, T. Enik}o, B. To´thme´re´sz & I. Ba´csi, 2016. Combined eco-morpho- logical functional groups are reliable indicators of coloni- sation processes of benthic diatom assemblages in a lowland stream. Ecological Indicators 64: 31–38.
Bolgovics, A´ ., B. Vikto´ria, G. Va´rbı´ro´, E. A´. Krasznai-K, E´.
A´ cs, K. T. Kiss & G. Borics, 2019. Groups of small lakes maintain larger microalgal diversity than large ones. Sci- ence of the Total Environment 678: 162–172.
Bougeard, S. & S. Dray, 2018. Supervised multiblock analysis in R with the ade4 package. Journal of Statistical Software 86: 1–17.
Bra¨ndle, M. & R. Brandl, 2001. Distribution, abundance and niche breadth of birds: scale matters. Global Ecology and Biogeography 10: 173–177.
Brown, J. H., 1984. On the relationship between abundance and distribution of species. The American Naturalist 124:
255–279.
Butchart, S. H., M. Walpole, B. Collen, A. Van Strien, J.
P. Scharlemann, R. E. Almond, J. E. Baillie, B. Bomhard, C. Brown & J. Bruno, 2010. Global biodiversity: indicators of recent declines. Science 328: 1164–1168.
Cardinale, B. J., J. E. Duffy, A. Gonzalez, D. U. Hooper, C.
Perrings, P. Venail, A. Narwani, G. M. Mace, D. Tilman &
D. A. Wardle, 2012. Biodiversity loss and its impact on humanity. Nature 486: 59–67.
Comite´ Europe´en de Normalisation (CEN), 2003. Water Quality – Guidance Standard for the Routine Sampling and Pre- treatment of Benthic Diatoms from Rivers. EN 13946.
de Bello, F., S. Lavorel, S. Dı´az, R. Harrington, J. H. Cornelis- sen, R. D. Bardgett, M. P. Berg, P. Cipriotti, C. K. Feld &
D. Hering, 2010. Towards an assessment of multiple ecosystem processes and services via functional traits.
Biodiversity and Conservation 19: 2873–2893.
Dent, C. L., G. S. Cumming & S. R. Carpenter, 2002. Multiple states in river and lake ecosystems. Philosophical Trans- actions of the Royal Society of London Series B: Biolog- ical Sciences 357: 635–645.
Dokulil, M. T., K. Teubner, A. Jagsch, U. Nickus, R. Adrian, D.
Straile, T. Jankowski, A. Herzig & J. Padisa´k, 2010. The impact of climate change on lakes in Central Europe. In George, G. (ed.), The Impact of Climate Change on European Lakes. Springer, Dordrecht: 387–409.
Dole´dec, S., D. Chessel & C. Gimaret-Carpentier, 2000. Niche separation in community analysis: a new method. Ecology 81: 2914–2927.
Dray, S. & A. Siberchicot, 2018. An S4 Lattice-Based Package for the Representation of Multivariate Data. R Package Version 1.0-15 [available on internet athttps://CRAN.R- project.org/package=adegraphics].
Edwards, K. F., C. A. Klausmeier & E. Litchman, 2011. Evi- dence for a three-way trade-off between nitrogen and phosphorus competitive abilities and cell size in phyto- plankton. Ecology 92: 2085–2095.
Ellingsen, K. E., J. E. Hewitt & S. F. Thrush, 2007. Rare species, habitat diversity and functional redundancy in marine benthos. Journal of Sea Research 58: 291–301.
Frisk, M. G., D. E. Duplisea & V. M. Trenkel, 2011. Exploring the abundance–occupancy relationships for the Georges
Bank finfish and shellfish community from 1963 to 2006.
Ecological Applications 21: 227–240.
Gaston, K. J., 2003. The Structure and Dynamics of Geographic Ranges. Oxford University Press, New York.
Gaston, K. J., T. M. Blackburn, J. J. Greenwood, R. D. Gregory, R. M. Quinn & J. H. Lawton, 2000. Abundance–occupancy relationships. Journal of Applied Ecology 37: 39–59.
Gurvich, D. E., P. A. Tecco & S. Dı´az, 2005. Plant invasions in undisturbed ecosystems: the triggering attribute approach.
Journal of Vegetation Science 16: 723–728.
Hanski, I., 1993. Three explanations of the positive relationship between distribution and abundance of species. In Ricklefs, R. E. & D. Schluter (eds), Species Diversity in Ecological Communities: Historical and Geographical Perspectives.
University of Chicago Press, Chicago: 108–116.
Hanski, I., 1994. A practical model of metapopulation dynam- ics. Journal of Animal Ecology 62: 151–162.
Heino, J., 2005. Positive relationship between regional distri- bution and local abundance in stream insects: a conse- quence of niche breadth or niche position? Ecography 28:
345–354.
Heino, J. & G. de Mendoza, 2016. Predictability of stream insect distributions is dependent on niche position, but not on biological traits or taxonomic relatedness of species.
Ecography 39: 1216–1226.
Heino, J. & M. Gro¨nroos, 2014. Untangling the relationships among regional occupancy, species traits, and niche char- acteristics in stream invertebrates. Ecology and Evolution 4: 1931–1942.
Heino, J. & J. Soininen, 2006. Regional occupancy in unicellular eukaryotes: a reflection of niche breadth, habitat avail- ability or size-related dispersal capacity? Freshwater Biology 51: 672–685.
Heino, J. & K. T. Tolonen, 2018. Ecological niche features override biological traits and taxonomic relatedness as predictors of occupancy and abundance in lake littoral macroinvertebrates. Ecography 41: 2092–2103.
Heino, J. & R. Virtanen, 2006. Relationships between distri- bution and abundance vary with spatial scale and ecolog- ical group in stream bryophytes. Freshwater Biology 51:
1879–1889.
Karasiewicz, S., S. Dole´dec & S. Lefebvre, 2017. Within out- lying mean indexes: refining the OMI analysis for the realized niche decomposition. PeerJ 5: e3364.
Kristiansen, J., 1996. 16. Dispersal of freshwater algae – a review. Hydrobiologia 336: 151–157.
Leibold, M. A., M. Holyoak, N. Mouquet, P. Amarasekare, J.
M. Chase, M. F. Hoopes, R. D. Holt, J. B. Shurin, R. Law &
D. Tilman, 2004. The metacommunity concept: a frame- work for multi-scale community ecology. Ecology Letters 7: 601–613.
Lengyel, E., J. Padisa´k, E´ . Hajnal, B. Szabo´, A. Pellinger & C.
Stenger-Kova´cs, 2016. Application of benthic diatoms to assess efficiency of conservation management: a case study on the example of three reconstructed soda pans, Hungary.
Hydrobiologia 777: 95–110.
Lengyel, E., D. La´za´r, A. J. Tra´jer & C. Stenger-Kova´cs, 2020.
Climate change projections for Carpathian soda pans on the basis of photosynthesis evidence from typical diatom species. Science of the Total Environment 710: 136241.