Ecological Indicators 130 (2021) 108105
Available online 17 August 2021
1470-160X/© 2021 The Authors. Published by Elsevier Ltd. This is an open access article under the CC BY-NC-ND license
(http://creativecommons.org/licenses/by-nc-nd/4.0/).
Applicability of diatom metabarcoding in the ecological status assessment of Hungarian lotic and soda pan habitats
M onika Duleba ´
a, Ang ´ ela F ¨ oldi
a, Adrienn Micsinai
b, G ´ abor V ´ arbír ´ o
c, Anita Mohr
b, Rita Sipos
b, Gyula Szab o ´
b, Krisztina Buczk ´ o
a, Zsuzsa Tr ´ abert
a, Keve T. Kiss
a, Tibor Bír ´ o
d, Edit Vadkerti
d, Eva ´ Acs ´
a,d,*aCentre for Ecological Research, Institute of Aquatic Ecology, Karolina út 29., Budapest H-1113, Hungary
bBiomi Ltd, G¨od¨ollo, Hungary ˝
cCentre for Ecological Research, Institute of Aquatic Ecology, Department of Tisza Research, Debrecen, Hungary
dUniversity of Public Service, Faculty of Water Sciences, Department of Water Supply and Sewerage, Baja, Hungary
A R T I C L E I N F O Keywords:
Diatom Metabarcoding Morphology
Ecological status assessment Running waters
Soda pans
A B S T R A C T
Diatoms are widely applied in the ecological status assessment of aquatic ecosystems using indices calculated from pollution sensitivity and indicator values of species. Traditional, morphology-based identification of species requires in-depth taxonomic knowledge and expertise. Identifying taxa according to their barcode sequences obtained with high-throughput sequencing (metabarcoding) would be a promising alternative. In this pilot study, we tested the applicability of metabarcoding of benthic diatom assemblages for the ecological status assessment of Hungarian water bodies, comparing its performance to that of morphology-based identification of species. The barcode region of the rbcL gene was investigated in samples from running waters with various trophic states and unique lentic habitats, namely soda pans. For running waters, the Specific Pollution Sensitivity Index (IPS) and for soda pans the H index and the Indice Biologique Diatom´ees (IBD) were calculated from the morphology- and sequence-based abundances. The ecological quality ratio was determined for running waters. Overall, more infrageneric taxa were found with microscopy than with metabarcoding in the lotic and lentic samples. The correspondence between taxon lists detected by the two methods was relatively low but increased considerably in the case of morphologically dominant taxa. Community composition based on microscopy and DNA sequence analysis showed a significant correlation and was determined by the same main environmental drivers.
Morphology-based indices strongly correlated with sequence-based indices. Both aspects indicated the same ecological status class for more than half of the lotic samples. In other cases, a status shift from good to moderate was frequent, a phenomenon that could prove problematic because the Water Framework Directive prescribes intervention for waters with a moderate or worse status. Considering discrepancies between the results obtained with microscopy and metabarcoding, using both methods in parallel could be proposed until the reference database has been suitably updated.
1. Introduction
Humans influence aquatic ecosystems in many ways through ur- banisation (Søndergaard and Jeppesen, 2007), transport, agriculture and industrial activities. These involve physical (e.g. hydro- morphological modifications; Elosegi and Sabater, 2013), chemical (various kinds of pollutions originating from point and diffuse sources;
Nikanorov and Stradomskaya, 2007; Wen et al., 2017) and biological impacts (e.g. introduction of alien species; Richardson, 2011).
Considering the risk anthropogenic loading poses to aquatic ecosystems, it is important to detect its extent and effects reliably. Physicochemical measurements may be affected by pollution that was introduced just before sampling, but such intermittent pollution events have a less pronounced effect on indicator organism communities (Szczepocka and Szulc, 2009). It has been shown that communities of aquatic organisms such as macroinvertebrates (Johnson et al., 1993) or diatoms (Carayon et al., 2019; Hambrook Berkman and Porter, 2004; Makovinsk´a et al., 2014) can integrate the effects of environmental pressures that have
* Corresponding author at: University of Public Service, Faculty of Water Sciences, Department of Water Supply and Sewerage, Baja, Hungary.
E-mail address: acs.eva@uni-nke.hu (´E. Acs). ´
Contents lists available at ScienceDirect
Ecological Indicators
journal homepage: www.elsevier.com/locate/ecolind
https://doi.org/10.1016/j.ecolind.2021.108105
Received 2 July 2021; Received in revised form 9 August 2021; Accepted 10 August 2021
lasted for longer periods and, therefore, are better indicators of water quality than physicochemical measurement values that reflect instan- taneous conditions.
Diatoms are eukaryotic single-celled photosynthetic organisms that have a silica cell wall called frustule (Round et al., 1990). These algae constitute a frequently dominant group in aquatic ecosystems in pelagic and benthic habitats and play a significant role in biogeochemical cycling of elements, especially silicon (Burliga and Kociolek, 2016).
They exhibit great species diversity (Mann and Vanormelingen, 2013), a short generation time (Round et al., 1990) and the ability to respond directly and sensitively to environmental changes (Lobo et al., 2016).
These characteristics allow researchers to use diatoms as indicators in the ecological status assessment of aquatic ecosystems (Ector et al., 2004; Lobo et al., 2016), for which they have been applied since the late 1940s (Rimet, 2012). In 2000, in the European Union Water Framework Directive (European Commission, 2000) benthic diatoms were chosen as one of five biological elements based on which ecological status of surface waters should be assessed. This assessment uses diatom indices calculated from the pollution sensitivity and indicator values as well as relative abundances of diatom taxa in benthic communities (Berthon et al., 2011). The accurate identification of species is essential for the assessment. Traditionally, the identification of diatom species has been based on the morphological features of the frustule (Round et al., 1990) that can be investigated under a light microscope or a scanning electron microscope in the case of small or similar taxa. However, morphology- based species identification is labour-intensive and requires in-depth taxonomic knowledge and expertise (Rimet and Bouchez, 2012). Intro- duction of molecular methods to diatom community analysis offers a new approach allowing objective and specific species identification.
Short DNA sequences called barcodes (Hebert et al., 2003) can be used to distinguish species. Metabarcoding combines barcodes and high- throughput sequencing (HTS) to identify species in community sam- ples (Taberlet et al., 2012). A reliable and curated reference library in which the taxonomic assignment of sequences is unambiguous is required for this endeavour (Rimet et al., 2019; Rimet et al., 2016). This process builds more upon current state-of-the-art knowledge than another concept according to which sequences originated from meta- barcoding without taxonomic assignment can be used in ecological status assessment (Tapolczai et al., 2021; Tapolczai et al., 2019). How- ever, this requires a verification study to assign an ecological profile to these units that for many of the species are known.
An important question is the selection of the suitable DNA region that holds enough taxonomic information to provide species-level res- olution. Until now, two possible candidates have been recommended for diatoms: the nuclear 18S rRNA gene (18S rDNA) (Visco et al., 2015;
Zimmermann et al., 2015; Zimmermann et al., 2014) and the plastid rbcL gene (Kermarrec et al., 2014; Kermarrec et al., 2013b; Vasselon et al., 2017). Of the two, rbcL has the advantages of high taxonomic resolving power and the larger and more comprehensive reference database (Apoth´eloz-Perret-Gentil et al., 2020; Kermarrec et al., 2013a).
Several studies have been conducted to test metabarcoding in the ecological status assessment of waters of various areas (Bailet et al., 2019; Borrego-Ramos et al., 2021; Kelly, 2019; Mora et al., 2019;
Mort´agua et al., 2019). Metabarcoding of benthic diatom assemblages of Hungarian waters has been carried out in two studies. First, during the Fourth Joint Danube Survey (JDS4), phytobenthic samples from the entire section of the River Danube were compared based on both mi- croscopy and environmental DNA (eDNA) analysis (Zimmermann et al., 2020). Tapolczai et al. (2021) applied a taxonomy-free approach without assigning exact sequence variants to traditional taxonomy to assess the effect of land-use on diatom assemblages.
In this paper we present a pilot study to assess the performance of morphological investigation and metabarcoding in the ecological status assessment of Hungarian waters from a diverse set of lotic environments and soda pans.
2. Materials and methods 2.1. Sampling
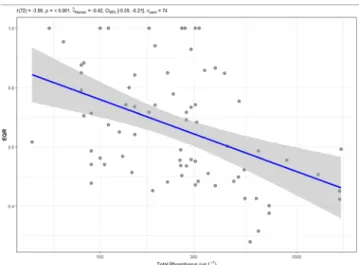
Samples were taken in the framework of a monitoring project with the aim of assessing the ecological status of Hungarian lotic and lentic environments based on benthic diatom assemblages. When selecting lotic environments, the principal selection criterion was to include samples from different trophic statuses. Trophic status was determined based on the total phosphorous concentration that significantly (p <
0.001) and negatively correlated with morphology-based ecological quality ratio (Pearson correlation coefficient: − 0.42, Fig. 1). Most of the sampled running waters were calcareous, but four siliceous streams were among them. Besides, they have various catchment size (from small to very large), landscape (hilly-mountainous, hilly and lowland) and altitude (from high to low), as well as sediments grain size (coarse and medium-fine) (Supplementary Table 1). Lake samples were taken from soda pans, which represent a unique type of habitat in the Car- pathian Basin (T´oth et al., 2014) regarding their physical and chemical characteristics, the inhabiting biota, distribution and vulnerability. Soda pans are the only natural saline waters in Central Europe, the Carpathian basin their westernmost occurrence in Eurasia (Horv´ath et al., 2013).
These habitats provide specific environmental conditions such as high salinity, alkalinity and turbidity, hypertrophic conditions, in case of astatic ponds fluctuating water level and temperature (Boros et al., 2017) that maintain a unique biota consisting of taxa with specific tol- erances and requirements. Many endemic and rare species can be found in these environments (Vad et al., 2017). The number of soda pans has seriously declined since the 18th century (Horv´ath et al., 2013) because of climate change and catchment activities e.g. water course diversion, dredging, excessive pumping of surface freshwater or ground water (Stenger-Kovacs et al., 2014). Worse ecological status of soda pans in ´ most cases means decreasing sodic character (Foldi et al., 2018). ¨
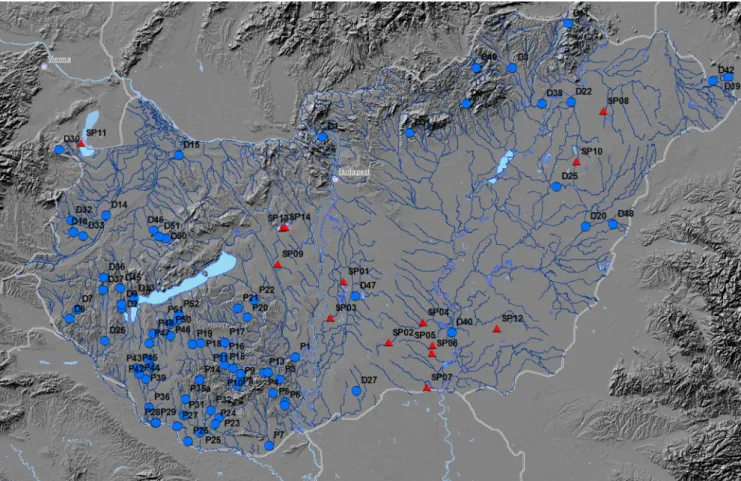
Ninety-three samples were selected for metabarcoding in parallel to morphological investigation. These involved 79 samples from rivers and streams selected along a trophic gradient as well as 14 samples from soda pans (Fig. 2, Supplementary Table 1). The samplings from rivers and streams were carried out from late March–early April until the end of April 2019; the samplings from soda pans were carried out in May–June 2019, except for Lake Kakassz´eki, where the sample was taken at the beginning of October 2019 due to the drying of the lake in late spring–summer. Samplings were carried out according to MSZ EN
Fig. 1.The relationship between the total phosphorous (TP) concentration and the ecological quality ratio (EQR) calculated based on the microscopic in- vestigations. Results of statistical tests are indicated in the upper part of the figure: Student’s t test with significance (p) value, Pearson correlation coeffi- cient (ȓPearson), 95% confidence interval (CI95%) and number of elements (npairs).
13946:2014 standard (Hungarian Standards Institution, 2014). Samples were taken from substrates most typical to the sampling site paying attention to that the sampled substrate should be in the euphotic zone and under water presumably for 4–6 weeks before the sampling. In lotic habitats, epilithic samples were taken from five randomly chosen cob- bles; if these were absent, other available substrates, mainly emergent macrophytes, rarely dead-wood or artificial substrates (e.g. brick), were sampled. In the case of soda pans, epiphytic samples were taken from five randomly chosen stems of green common reed (Phragmites australis (Cav.) Trin. ex Steud.), a10-cm section of the stems starting at 10 cm below the water surface was cut. For all kinds of substrates, the five random repeats were integrated into one composite sample and biofilm from them was scraped with a toothbrush into tap water. The acquired slurry was homogenised and divided into two parts. For DNA analysis, 2–3 ml was pipetted into a 15-ml sterile plastic centrifuge tube that was filled with absolute ethanol (final ethanol concentration ≥70%), then stored at 4◦C until processing. The rest of the slurry was preserved with formaldehyde (4% final concentration) for microscopic investigation (European Committee for Standardisation, 2002).
2.2. Environmental variables
Within the framework of the project, several environmental vari- ables were measured, of which eight were used in our analyses. pH, dissolved oxygen content (Diss_O, mg l−1) and conductivity (cond, µS cm−1) were measured in situ with a portable multiparameter digital meter (Multi 350i-WTW, Germany). For further laboratory analysis, 1 L water sample was taken and stored cooled until processing. Samples were taken by tube sampler from the trophic layer (2.5 ×Secchi depth) at the deepest parts of the lakes. In the case of water bodies where the maximum depth (Zmax) was <2 m, the whole water column has been
sampled. In rivers samples were taken from the thalweg. From this sample, total nitrogen (TN, mg l−1; MSZ EN 12260:2004; Hungarian Standards Institution, 2004), total phosphorous concentration (TP, mg l−1, MSZ EN ISO 11885:2009; Hungarian Standards Institution, 2009), chlorophyll a concentration (CHA µg l−1, MSZ ISO 10260:1993; Hun- garian Standards Institution, 1993), chemical oxygen demand (COD mg l−1, ISO 15705:2002; International Organization for Standardization, 2002) and biological oxygen demand (BOD, mg l−1, MSZ ISO 6060:1991; Hungarian Standards Institution, 1992) were measured ac- cording to the national standard.
2.3. Morphological investigation
Diatom valves were cleaned using hydrogen peroxide and hydro- chloric acid, washed in distilled water and then mounted with Naphrax mountant (European Committee for Standardisation, 2002). Diatom taxa were identified under a Zeiss Z2 Axio Imager microscope equipped with differential interference contrast (DIC) at a magnification of 1600×. The minimum number of values identified to the species or genus level was 400 for rivers and stream samples and 500 for soda pan samples.
In the case a species where identification under the light microscope was uncertain (because of their small size or similarity), we applied scanning electron microscopy. For this endeavour, cleaned valves were filtered onto an Isopore polycarbonate membrane filter with a 3-μm pore diameter (Merck Millipore), fixed on metal stubs with double-sided carbon tape, painted in spots with conductive silver paint (NO-VOC Silver Paint, SPI Supplies) and coated with gold using a rotary-pumped spatter coater Quorum Q150R S. The prepared samples were investi- gated with a Zeiss EVO MA 10 scanning electron microscope operated at 10 kV and 10 mm working distance using secondary electron detectors.
Fig. 2.Map of the sampling sites: blue dots represent rivers and stream and red triangles indicate soda pans. Description and codes of sampling sites can be found in Supplementary Table 1.
2.4. Metabarcoding
DNA was extracted from samples using the NucleoSpin Soil Kit (Macherey-Nagel) following the protocol by Vautier et al. (2020) with a modification that the mixture of the two kinds of lysis buffer provided in the kit was applied in a 1:1 ratio.
Polymerase chain reactions (PCR), library preparation and sequencing were performed by amplifying a 312 base pair (bp) partial target of the rbcL gene using gene-specific primers (Vasselon et al., 2017) with Illumina overhang P5/P7 adapters (Table 1).
Forward and reverse primers were mixed in equimolar quantities and used as the RbcL-Forward-Primer mix and the RbcL-Reverse-Primer Mix to amplify the 312 bp rbcL gene target in a single multiplex PCR. The final reaction volume was 25 µl, including 12.5 µl Q5® High-Fidelity 2X Master Mix (New England Biolabs), 5 µl each of the 2 µM Forward and the 2 µM Reverse Primer mixes, 1 µl of the DNA sample, and 1.5 µl of the molecular-biology-grade water (Lonza). The PCR was carried out in an Applied Biosystems Veriti 96-well thermal cycler with the following thermal profile: initial denaturation at 95◦C for 3 min; 25 cycles of 98◦C for 30 sec, 55◦C for 40 sec and 72◦C for 30 sec; and final extension at 72◦C for 5 min. If this protocol returned poor results, the PCR reaction was repeated with an increased cycle number of up to 30.
The PCR products were purified using 1.0x AMPure XP magnetic beads (Beckman Coulter) according to the manufacturer’s instructions and eluted in 25 µl of Buffer EB (Qiagen). Concentrations were quanti- fied by using a Qubit™ 4 Fluorometer (Invitrogen) with the Qubit™
dsDNA HS Assay Kit. Cleaned PCR products were diluted to equimolar concentrations for indexing reactions.
Nextera DNA CD Indexes (96 Index, 96 Samples) were sourced from Merck with P5/P7 adapters and P7/P5 tags attached (Table 2). Index reactions were performed in a 50 µl final volume including 25 µl Q5®
High-Fidelity 2X Master Mix (New England Biolabs), 5 µl of each 1 µM index primer, 5 µl of cleaned PCR product from the first PCR reaction and 10 µl of molecular-biology-grade water. The thermal profile was the following: initial denaturation at 95◦C for 3 min; 8 cycle of 98◦C for 30 sec, 55◦C for 40 sec and 72◦C for 30 sec; and final extension at 72◦C for 5 min.
The PCR products were purified using 1.2x AMPure magnetic beads according to the manufacturer’s instructions and eluted in 25 µl of Buffer EB. Quality and concentration control of the samples was performed with a Qubit™ 4 Fluorometer using the Qubit™ dsDNA HS Assay Kit reagents (concentration) and with an Agilent TapeStation System 4150 (Agilent) using the Agilent High Sensitivity D1000 ScreenTape Assay Reagents. Cleaned PCR products were diluted to a similar concentration and pooled properly. The final library pool was checked for size and concentration and diluted to a 4 nM starting concentration for the run on the Illumina MiSeq system. After denaturation and dilution, sequencing was performed using the Illumina MiSeq V2 (500) Reagent Kit and a 2 × 250 bp read length.
2.5. Bioinformatics analysis
For bioinformatics analysis, we used a workflow by Keck et al.
(2019) that follows the official DADA2 pipeline, which is a custom script to process Illumina MiSeq HTS data directly (Callahan et al., 2016). The
modified script includes specific needs and has proven to work well for diatom metabarcoding with rbcL (Keck et al., 2019).
Primer sequences were removed from R1 and R2 reads with cutadapt (Martin, 2011). The read quality profile was inspected and it indicated good quality. R1 and R2 reads were trimmed to 200 and 170 nucleotides (nt), respectively, and then filtered using the criteria of zero ambiguous nucleotides and a maximum of two expected errors. A parametric error model was learnt from the data by alternating estimation of the error rates and inference of sample composition until they converged on a jointly consistent solution. The estimated error rates were a good fit to the observed rates and, as expected, the error rates dropped as the quality increased. Then R1 and R2 reads were dereplicated and filtered with the core sample inference algorithm of DADA2. Paired forward and reverse reads were aligned and merged to one contig sequence. Chi- maeras were removed. The read numbers of samples were tracked after each step of the pipeline. In one sample (D41), only raw reads were found; in another sample (D22), 47% of the merged sequences were lost after removing chimaeras. Therefore, these samples were removed from further analysis. The taxonomic assignment step was done using Diat.
barcode version 9.2 (Rimet et al., 2019) as the reference database and a minimum bootstrap confidence of 75 for assigning a taxonomic level.
This method searches short, 8-nt-long sequences in target and reference sequences and identifies target as the species of the database for which the sequence shows the greatest identity with the target. Read numbers were corrected according to cell biovolume using the correction factor developed by Vasselon et al. (2018).
2.6. Statistical analysis
We used relative abundances to compare the results of the morphological investigation and metabarcoding. In each sample, we investigated the number of taxa shared by the two approaches and the number of taxa that were dominant (their relative abundance was at least 5%) according to microscopy and recorded in the sample also by metabarcoding.
Number of taxa detected based on morphology as well as based on DNA sequences were illustrated on Venn diagram using ‘draw.pairwise.
venn’ function in VennDiagram package (Chen, 2018) in R environment (R Core Team, 2020).
The Bray–Curtis dissimilarity index was calculated between samples identified based on morphology and DNA, then linear correlation be- tween the two matrices was calculated using Mantel’s permutation test with 999 permutations.
To reveal the relationship between environmental variables and the composition of diatom assemblages based on morphology and DNA, redundancy analysis (RDA) was performed. These analyses were per- formed in case of lotic samples. Number of soda pan samples was considered to be too low for this. RDA was carried out in the R envi- ronment (R Core Team, 2020) with the vegan package (Oksanen et al., 2018).
The map was created with ArcMap ESRI.
The following diatom indices were used: for rivers and streams, the Specific Pollution Sensitivity Index (IPS; Coste as cited in Cemagref, 1982) and the multimetric index IPSITI (V´arbíro et al., 2012), for soda ´ pans, the H index (Ziemann et al., 2001) and the Indice Biologique Table 1
Primers used for the rbcL polymerase chain reaction.
Name Illumina overhang P5 tag (5′→ 3′) Locus-specific primer sequence (5′→ 3′)
Diat_rbcL_708F_1 TCGTCGGCAGCGTCAGATGTGTATAAGAGACAG AGGTGAAGTAAAAGGTTCWTACTTAAA
Diat_rbcL_708F_2 TCGTCGGCAGCGTCAGATGTGTATAAGAGACAG AGGTGAAGTTAAAGGTTCWTAYTTAAA
Diat_rbcL_708F_3 TCGTCGGCAGCGTCAGATGTGTATAAGAGACAG AGGTGAAACTAAAGGTTCWTACTTAAA
Name Illumina overhang P7 tag (5′→ 3′) Locus-specific primer sequence (5′→ 3′)
R3_1R GTCTCGTGGGCTCGGAGATGTGTATAAGAGACAG CCTTCTAATTTACCWACWACTG
R3_2R GTCTCGTGGGCTCGGAGATGTGTATAAGAGACAG CCTTCTAATTTACCWACAACAG
Diatom´ees (IBD; Coste and Prygiel, 1998; Lenoir and Coste, 1996; Pry- giel, 2000). The IPS, the Austrian Saprobic Index (SI; Rott et al., 1997) and the Austrian Trophic Index (TI; Rott et al., 1999) were calculated using OMNIDIA 6.0.8 (Lecointe et al., 1993). In addition, Van Dam halobity values of taxa (Van Dam et al., 1994) required for calculating the H index (Acs et al., 2015; F´ ¨oldi et al., 2018) were obtained from the database of the program. The IPSITI was calculated according to the following equation:
IPSITI=IPS+SI+TI
3 .
For the running waters the ecological quality ratio (EQR) was calculated from the indices following the recommendations by V´arbíro ´ et al. (2012). Briefly, each sampled water body was rated to types ac- cording to landscape, altitude, geology, sediment and catchment size.
The types of the sampled waters are provided in Supplementary Table 1.
Adequate diatom index to be used was chosen according to type of water body (Table 3.). The value of the index indicated an ecological status class for which a transforming equation belonged to (Table 3). Index value (x) was converted into EQR (y) with this equation.
Number of soda pan samples was considered to be too low for drawing consequences on metabarcoding effect on ecological status assessment in case of these habitats.
The relationship between diatom indices as well as EQR values ob- tained based on the results of the two approaches – morphology and metabarcoding (with and without the correction factor) – was deter- mined and Pearson’s product-moment correlation were calculated using the package ggstatsplot (Patil, 2021) in the R environment (R Core Team, 2020). Scatterplots with statistical results were made using the function ‘ggscatterstats’, boxplots with the function ‘ggbetweenstats’.
The number of cases that occurred when the ecological class indicated by morphological investigation differed from the class indicated by metabarcoding was investigated and illustrated on a classification table.
To identify which taxa cause the main difference between morphology- and DNA-based indices, similarity percentage (SIMPER) analyses were carried with the PAST software (Hammer et al., 2001).
3. Results
3.1. Morphological investigations
For overall identification, there were 347 species belonging to 80
genera and 28 families in rivers and streams and 139 species and infraspecific taxa belonging to 34 genera and 17 families in soda pans. In lotic samples, there were 19–83 (mean 42) taxa per sample and in soda pan samples, there were 11–41 (mean 23) taxa per sample.
In rivers and streams, the five most abundant taxa were Achnanthi- dium minutissimum (Kützing) Czarnecki, Navicula gregaria Donkin, Pla- nothidium frequentissimum (Lange-Bertalot) Lange-Bertalot, Amphora pediculus (Kützing) Grunow and Planothidium lanceolatum (Br´ebisson ex Kützing) Lange-Bertalot. In soda pans, the five most abundant taxa were Nitzschia paleacea (Grunow) Grunow in Van Heurck, A. minutissimum, Nitzschia aurariae Cholnoky, Nitzschia perminuta (Grunow) M. Peragallo and Nitzschia reskoi Acs, Duleba, C.E. Wetzel ´ & Ector.
The morphology-based IPS values of rivers and streams ranged from 5.6 to 18.4, the H index of soda pans varied from 3.5 to 13.5 and the IBD ranged from 1.2 to 18.1. Using microscopic counting for calculation of indices, the trophic status of the running waters was: 21 high, 17 good, 34 moderate and 3 poor.
3.2. Metabarcoding
After the final step of the bioinformatics processing, there were a total of 1,049,315 reads (886,099 reads in rivers and streams and 163,216 reads in soda pans) with an average of 11,283 reads per sample (11,216 reads in rivers and streams and 11,659 reads in soda pans).
These constituted a total of 1,412 amplicon sequence variants (ASVs) of which 277 (47,983 reads) did not belong to the phylum Bacillariophyta (seven non-Bacillariophyta ASVs were assigned at the species level, namely Vaucheria bursata (O.F. Müller) C.Agardh, a xanthophycean alga). Among the 1,135 Bacillariophyta ASVs, 612 (54%) were assigned at the species level, 198 (17%) at only the genus level and 38 (3%) at only the family level. The remaining (25%) were assigned at only the order or higher level.
In rivers and streams, 190 species were obtained (belonging to 69 genera and 8 families), with 5–65 species (mean 36) per sample. In soda pans, 118 species were obtained (belonging to 36 genera and 7 families), with 11–41 species (mean 23) per sample. In rivers and streams, A. minutissimum, A. pediculus, Mayamaea permitis (Hustedt) Bruder &
Medlin, N. gregaria and Nitzschia media Hantzsch were the most abun- dant species after applying the correction factor. In soda pans, A. minutissimum, Nitzschia supralitorea Lange-Bertalot, N. reskoi, Gom- phonema saprophilum (Lange-Bertalot & Reichardt) Abarca, R. Jahn, J.
Zimmermann & Enke and Nitzschia palea (Kützing) W. Smith were the Table 2
Index primers used in polymerase chain reactions.
Name Illumina P7 adapter (5′→ 3′) i7 index (5′→ 3′) Illumina P7 tag (5′→ 3′)
H701 CAAGCAGAAGACGGCATACGAGAT TCGCCTTA GTCTCGTGGGCTCGG
H702 CAAGCAGAAGACGGCATACGAGAT CTAGTACG GTCTCGTGGGCTCGG
H703 CAAGCAGAAGACGGCATACGAGAT TTCTGCCT GTCTCGTGGGCTCGG
H705 CAAGCAGAAGACGGCATACGAGAT AGGAGTCC GTCTCGTGGGCTCGG
H707 CAAGCAGAAGACGGCATACGAGAT GTAGAGAG GTCTCGTGGGCTCGG
H723 CAAGCAGAAGACGGCATACGAGAT GAGCGCTA GTCTCGTGGGCTCGG
H706 CAAGCAGAAGACGGCATACGAGAT CATGCCTA GTCTCGTGGGCTCGG
H712 CAAGCAGAAGACGGCATACGAGAT TCCTCTAC GTCTCGTGGGCTCGG
H720 CAAGCAGAAGACGGCATACGAGAT AGGCTCCG GTCTCGTGGGCTCGG
H710 CAAGCAGAAGACGGCATACGAGAT CAGCCTCG GTCTCGTGGGCTCGG
H711 CAAGCAGAAGACGGCATACGAGAT TGCCTCTT GTCTCGTGGGCTCGG
H714 CAAGCAGAAGACGGCATACGAGAT TCATGAGC GTCTCGTGGGCTCGG
Name Illumina P5 adapter (5′→ 3′) i5 index (5′→ 3′) Illumina P5 tag (5′→ 3′)
H505 AATGATACGGCGACCACCGAGATCTACAC GTAAGGAG TCGTCGGCAGCGTC
H517 AATGATACGGCGACCACCGAGATCTACAC GCGTAAGA TCGTCGGCAGCGTC
H506 AATGATACGGCGACCACCGAGATCTACAC ACTGCATA TCGTCGGCAGCGTC
H503 AATGATACGGCGACCACCGAGATCTACAC TATCCTCT TCGTCGGCAGCGTC
H516 AATGATACGGCGACCACCGAGATCTACAC CCTAGAGT TCGTCGGCAGCGTC
H522 AATGATACGGCGACCACCGAGATCTACAC TTATGCGA TCGTCGGCAGCGTC
H513 AATGATACGGCGACCACCGAGATCTACAC TCGACTAG TCGTCGGCAGCGTC
H510 AATGATACGGCGACCACCGAGATCTACAC CGTCTAAT TCGTCGGCAGCGTC
most abundant species after the application of the correction factor.
The DNA-based IPS values of rivers and streams ranged from 3.7 to 18.6 using original read numbers and from 5.1 to 18.6 with cell- biovolume-corrected read numbers. Without read number correction, the H index of soda pans was from 5.5 to 14.9 and the IBD was from 2.2 to 14.2. With correction, the H index varied from 5.2 to 13.8 and the IBD varied from 2.3 to 18.7. Based on uncorrected sequence data, the ecological status of the running waters was: 5 high, 21 good, 45 mod- erate and 4 poor. When the data were corrected, 13 were high, 14 were good, 40 were moderate and 8 were poor.
3.3. Comparison of the morphological and metabarcoding analyses Overall, there were 481 species and intraspecific taxa identified in lotic habitats and 153 in soda pans based on morphological and/or DNA sequence analysis. In case of both running waters and soda pans more taxa were found with microscope than with metabarcoding and about a quarter of taxa were detected with both methods (Fig. 3). In rivers and streams, 5%–47% (mean 25%) of taxa observed under there microscope were detected based on sequences; in the case of dominant species (relative abundance greater than 5%), this portion was 25%–100%
(mean 70%). In soda pans, 17%–42% (mean 26%) of taxa identified morphologically were found based on metabarcoding (Fig. 4A); in the case of dominant species, this portion was 20%–100% (mean 56%) (Fig. 4B).
The Mantel test was applied to compare the structure of communities identified by the two methods. It revealed significant correlation for both the lotic samples (Pearson’s product-moment correlation =0.5143, p =0.001) and soda pan samples (Pearson’s product-moment correla- tion =0.6704, p =0.001). The correlation was stronger for lotic samples when corrected read numbers were compared to morphology-based abundances; for soda pan samples, however, the outcome was more or less the same (Pearson’s product-moment correlation = 0.6261 and 0.6658, respectively, p =0.001 for both).
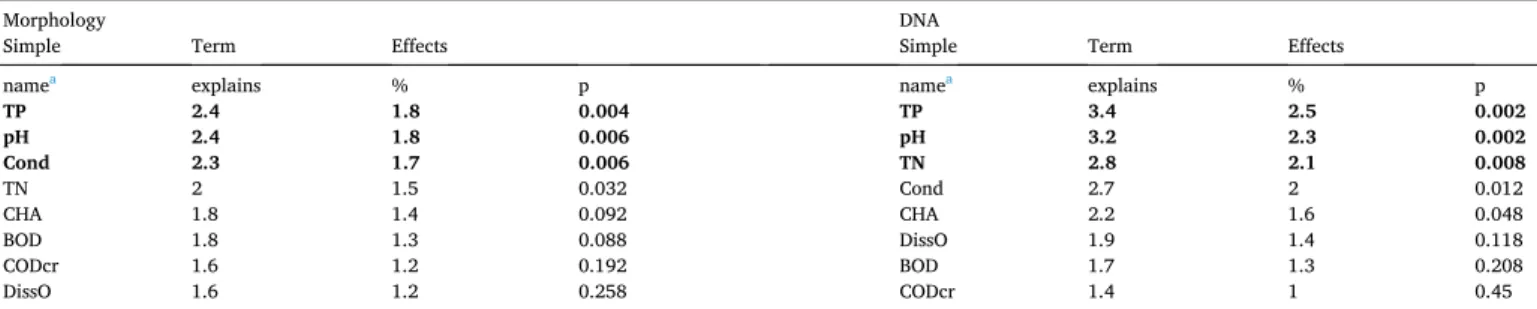
RDA showed that the most important variables explaining the rela- tionship between the diatom community and environmental variables in running waters were: TP, pH and conductivity in the case of morphology and TP (Fig. 5A, Table 4), pH and TN in the case of DNA sequences (Fig. 5B, Table 4). Both morphology-based and corrected DNA-based analyses showed a similar distribution of samples, namely large rivers formed a group overlapping with other running waters (Fig. 5).
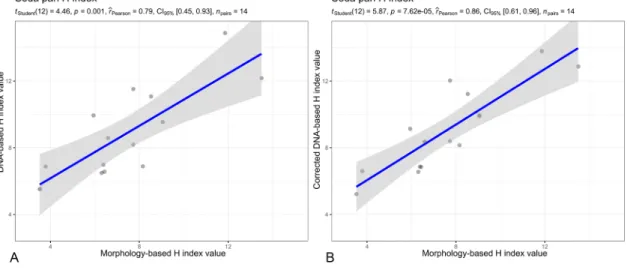
For both lotic and lentic samples, the morphology-based indices showed a significant (p <0.01) positive correlation with the DNA-based indices calculated either from uncorrected or cell-biovolume-corrected read numbers, correlation with corrected DNA-based indices was a bit stronger than with the uncorrected DNA-based indices (Figs. 6A and B, 7, Pearson correlation coefficients are indicated on the corresponding figures).
Morphology-based EQR values calculated for lotic habitats were usually higher than ecological quality ratio based on DNA sequences, EQR for uncorrected or corrected read numbers were more or less the same (Fig. 6C). Morphology-based EQR also showed a significant (p <
0.01) positive correlation with EQR for both uncorrected and corrected read numbers (Pearson correlation coefficients: 0.74 and 0.81, respectively).
Comparing the ecological status calculated using morphological and Table 3
Indices, index boundaries and equations used to calculate the ecological quality ratio (EQR) according to the type of water. Sample information (type classifi- cations) can be found in Supplementary Table 1. In equations x is the value of the diatom index to be transformed, y is the EQR value.
Type Indexa Equation Index
boundaries EQRb range 1S Reference IPS y =0.1176 ×x
– 1.0588
≥16.4
High y =0.1176 ×x
– 1.0588
≥15.8 0.8 ≤EQR
Good y =0.1176 ×x
– 1.0588
≥14.1 0.6 ≤ EQR <0.8
Moderate y =0.0426 ×x ≥9.4 0.4 ≤
EQR <0.6
Poor y =0.0426 ×x ≥4.7 0.2 ≤
EQR <0.4
Bad y =0.0426 ×x ≥0 0 ≤EQR
<0.2
2S, 2M Reference IPSITI y =0.0909 ×x – 0.4545 ≥14.3
High y =0.0909 ×x
– 0.4545
≥13.8 0.8 ≤EQR
Good y =0.0909 ×x
– 0.4545
≥11.6 0.6 ≤ EQR <0.8 Moderate y =0.0519 ×x
+0.0017 ≥7.7 0.4 ≤
EQR <0.6
Poor y =0.0519 ×x
+0.0017 ≥3.9 0.2 ≤
EQR <0.4
Bad y =0.0519 ×x
+0.0017
≥0 0 ≤EQR
<0.2
3S, 3M,
5S, 5M Reference IPSITI y =0.25 ×x – 2.175
≥12.2
High y =0.25 ×x –
2.175 ≥11.9 0.8 ≤EQR
Good y =0.25 ×x –
2.175
≥11.1 0.6 ≤ EQR <0.8 Moderate y =0.0541 ×x ≥7.4 0.4 ≤
EQR <0.6
Poor y =0.0541 ×x ≥3.7 0.2 ≤
EQR <0.4
Bad y =0.0541 ×x ≥0 0 ≤EQR
<0.2
4L Reference IPSITI y =0.0556 ×x – 0.1167
≥16.6
High y =0.0556 ×x
– 0.1167
≥16.5 0.8 ≤EQR
Good y =0.0556 ×x
– 0.1167 ≥12.9 0.6 ≤
EQR <0.8 Moderate y =0.0465 ×x ≥8.6 0.4 ≤
EQR <0.6
Poor y =0.0465 ×x ≥4.3 0.2 ≤
EQR <0.4
Bad y =0.0465 ×x ≥0 0 ≤EQR
<0.2
6S, 6M Reference IPSITI y =0.125 ×x – 0.7
≥12.5
High y =0.125 ×x –
0.7
≥12.0 0.8 ≤EQR
Good y =0.125 ×x –
0.7 ≥10.4 0.6 ≤
EQR <0.8 Moderate y =0.058 ×x –
0.0019
≥6.9 0.4 ≤ EQR <0.6
Poor y =0.058 ×x –
0.0019
≥3.5 0.2 ≤ EQR <0.4
Bad y =0.058 ×x –
0.0019
≥0 0 ≤EQR
<0.2
7L, 8N Reference IPSITI y =0.0465 ×x
+0.2279 ≥12.6
High y =0.0465 ×x
+0.2279
≥12.3 0.8 ≤EQR
Good y =0.0465 ×x
+0.2279
≥8.0 0.6 ≤ EQR <0.8 Moderate y =0.0755 ×x
– 0.0025 ≥5.3 0.4 ≤
EQR <0.6
Poor y =0.0755 ×x
– 0.0025
≥2.7 0.2 ≤ EQR <0.4
Table 3 (continued)
Type Indexa Equation Index
boundaries EQRb range
Bad y =0.0755 ×x
– 0.0025
≥0 0 ≤EQR
<0.2 a IPS, Specific Pollution Sensitivity Index; IPSITI, multimetric index calculated from the IPS, the Austrian Saprobic Index and the Austrian Trophic Index.
b EQR, ecological quality ratio.
DNA results of lotic habitats revealed that the status was the same in more than 60% of the samples (47); this number was slightly higher using the correction factor (49 samples). In the other samples, meta- barcoding generally showed one class worse (28% of the samples without correction, 29% with correction), namely a shift from the good to the moderate class occurred frequently. More than one class shift
(from high to moderate) was observed in a few samples. Cases when DNA indicated a better class than morphology were very rare (Table 5).
The ecological status indicated by morphology rather than DNA se- quences seemed to correspond better to TP. Specifically, TP was 0.045–0.51 mg/l (mean 0.192 mg/l) in waters with a good or high status according to the morphological analysis, while it was 0.09–1.687 mg/l Fig. 3. Venn diagram of the number of taxa detected based on morphology under the microscope and with DNA sequence analysis in samples of rivers and streams (A) as well as soda pans (B).
Fig. 4.(A) Boxplot of the number of taxa detected with both morphology and DNA sequence analysis. (B) Boxplot of the portion of taxa that were dominant in morphological analysis and were also detected based on DNA sequence analysis. Median values (μ) and number of elements (n) are indicated on the panels.
Fig. 5. Position of the samples in the factorial plane of the correlated environmental variables based on (A) morphology and (B) DNA sequence analysis. The arrow lengths represent the relative importance of each variable in the redundancy analysis and the direction of the arrows indicates variable correlations. The shaded areas indicate samples from large rivers.
(mean 0.508 mg/l) in habitats with a moderate or poor status. In sam- ples that were assigned to a good or high status according to morphology but a moderate status based on corrected DNA data, TP was low (0.045–0.51 mg/l, mean 0.199 mg/l), similarly to those waters that had a good or high status based on both methods (0.055–0.385 mg/l, mean
0.189 mg/l). TP was higher in samples that indicated a moderate status with both methods: 0.09–1.687 mg/l (mean 0.508 mg/l).
SIMPER analysis showed that in running waters A. pediculus, A. minutissimum, M. permitis, P. lanceolatum, P. frequentissimum and Planothidium victori P.M. Novis, J. Braidwood & C. Kilroy contributed Table 4
Variance explained by the environmental variables.
Morphology DNA
Simple Term Effects Simple Term Effects
namea explains % p namea explains % p
TP 2.4 1.8 0.004 TP 3.4 2.5 0.002
pH 2.4 1.8 0.006 pH 3.2 2.3 0.002
Cond 2.3 1.7 0.006 TN 2.8 2.1 0.008
TN 2 1.5 0.032 Cond 2.7 2 0.012
CHA 1.8 1.4 0.092 CHA 2.2 1.6 0.048
BOD 1.8 1.3 0.088 DissO 1.9 1.4 0.118
CODcr 1.6 1.2 0.192 BOD 1.7 1.3 0.208
DissO 1.6 1.2 0.258 CODcr 1.4 1 0.45
aDiss_O, dissolved oxygen content (mg l−1); Cond, conductivity (µS cm−1); TN, total nitrogen (mg l−1); TP, total phosphorous concentration (mg l−1); CHA, chlorophyll a concentration (µg l−1); COD, chemical oxygen demand (mg l−1); BOD, biological oxygen demand (mg l−1).
Fig. 6. (A, B) Scatterplots of the morphology-based and DNA-based Specific Pollution Sensitivity Index (IPS) values in rivers and streams. DNA-based indices were calculated using either uncorrected read numbers (A) or read numbers corrected with correction factor (B) developed by Vasselon et al. (2018). Results of statistical tests are indicated in the upper part of the panels A and B: Student’s t test with significance (p) value, Pearson correlation coefficient (ȓPearson), 95% confidence interval (CI95%) and number of elements (npairs). (C) Box plots illustrating the ecological quality ratio (EQR) values calculated from morphology as well as uncor- rected and corrected DNA-based results. Median values (μ) and number of elements (n) are indicated on the panel.
Fig. 7. Scatterplot of morphology-based and DNA-based H index values (A, B) and Indice Biologique Diatom´ees (IBD) (C, D) values in soda pans. For (A) and (C), DNA-based indices were calculated from uncorrected read numbers. For (B) and (D), DNA-based indices were calculated from read numbers corrected with the correction factor developed by Vasselon et al. (2018). Results of statistical tests are indicated in the upper part of the panels: Student’s t test with significance (p) value, Pearson correlation coefficient (ȓPearson), 95% confidence interval (CI95%) and number of elements (npairs).
Table 5
Classification table of ecological status classes of lotic habitats indicated by morphological and DNA sequence results. A green background indicates no shift, a yellow background shows a one-class shift and an orange background shows a two-class shift.
more than 5% of the discrepancies between morphology- and DNA- based community composition in the samples that had a worse ecolog- ical status according to DNA sequences. Among these, A. minutissimum had the highest IPS sensitivity value and the lowest TI and SI sensitivity values, indicating good quality in contrast to M. permitis, which had the lowest IPS and the highest TI and SI sensitivity values, indicating worse status. In soda pans, N. paleacea, N. perminuta, N. supralitorea, A. minutissimum, G. saprophilum and N. reskoi contributed more than 5%
of the discrepancies. All of these species are oligohalobic with the exception of N. reskoi, which is mesohalobic. The abundance of oligo- halobic taxa decreased while the abundance of mesohalobic species increased the H index value.
4. Discussion
As shown in previous studies, metabarcoding offers a promising opportunity to complement microscopic evaluation of lentic and lotic algal communities (Mora et al., 2019; Mort´agua et al., 2019). However, there are several steps that should be standardised and validated in the HTS procedure to use it in the ecological status assessment, including the choice of the barcode region, sample processing (DNA extraction, PCR primers, amplification protocol, sequencing technology) and bioinfor- matics analysis (see Rivera et al. (2018), and references therein).
Although efforts have been made by several authors to develop standard methods, a comparison of these factors was not the scope of the present study. For our investigation, we chose the rbcL gene due to its high taxonomic resolution power (Apoth´eloz-Perret-Gentil et al., 2020) and the curated database, Diat.barcode (Rimet et al., 2019), contains more diatom rbcL sequences (4,713) that belong to more taxa than 18S rDNA (2,563 sequences of 792 taxa). We applied the barcode region, extrac- tion and amplification suggested by Vasselon et al. (2017) and bioin- formatics analysis suggested by Keck et al. (2019) on samples from rivers and streams of different biological types and soda pans. We compared these data to the results of morphological investigation that are currently accepted and used for diatom-based monitoring in Hungary (Szil´agyi et al., 2008).
Microscopy and metabarcoding showed significant correlation regarding both the community compositions (indicated by Mantel test) and diatom indices (indicated by Pearson correlation); in addition, the distribution of the samples was similar and the same main driver (TP) was revealed. Other studies have shown similar significant correlations between morphology- and DNA-based diatom indices in samples from various environments, for example, rivers in various conditions in France and Switzerland (the Swiss Diatom Index, DI-CH, Apoth´eloz- Perret-Gentil et al., 2020), the United Kingdom (the Trophic Diatom Index for Lakes, TDIL; Kelly et al., 2020), Catalan rivers (the IPS; P´erez- Burillo et al., 2020), streams and lakes of Fennoscandia (the IPS; Bailet et al., 2019) and shallow ponds within the Duero river basin (the TDI;
Borrego-Ramos et al., 2021). Similarly to the mentioned authors, we found discrepancies between community compositions obtained with different analyses. Several taxa observed microscopically could not be detected with metabarcoding and vice versa, a factor that considerably affected the index calculation.
Overall, more taxa were detected with morphological analysis than with metabarcoding. This finding is consistent with Mortagua et al. ´ (2019) and Bailet et al. (2019) and is in contrast to Kelly et al. (2020).
There was about 25% overlap between the number of species detected microscopically and with metabarcoding; however, most of the devi- ating species had a low abundance. Multiple explanations could be given regarding the difference in detecting taxa by two different methods.
Incompleteness of the reference database, incomplete extraction of DNA from cells, the presence of substances inhibiting PCR amplification, non- annealing of primers, observation of empty frustules, inhomogeneous distribution of taxa in the samples and morphologically variable taxa with low sequence variation can lead to biases, resulting in several taxa that could only be found with or in higher abundance based on
microscopy. On the other hand, species detected only or in higher abundance based on DNA sequencing could be explained by the destruction of weak cell walls during cleaning, cryptic or semi-cryptic species, detection of extracellular DNA or resting stages as well as inhomogeneous distribution of taxa in the samples. These possibilities are discussed in the following sections.
4.1. The reference database
Incompleteness of the reference database is likely the main reason for the differences between the taxonomic composition identified based on morphological features and DNA sequences. Several authors have encountered such a phenomena (Apoth´eloz-Perret-Gentil et al., 2020;
Bailet et al., 2019; Borrego-Ramos et al., 2021; Rivera et al., 2018). A large part of the taxa detected by microscopic counting in the riverine and soda pan samples (60% and 32%, respectively) was not recorded in the database: Aulacoseira pusilla (Meister) Tuji et Houki, Luticola acid- oclinata Lange-Bertalot, Navicula metareichardtiana Lange-Bertalot &
Kusber nom. nov., Nitzschia archibaldii Lange-Bertalot, Nitzschia liebeth- ruthii Rabenhorst, Nitzschia palea (Kützing) W. Smith var. debilis (Kütz- ing) Grunow in Cleve & Grunow, Nitzschia sociabilis Hustedt, Nitzschia subtilis Grunow in Cleve et Grunow and Sellaphora atomoides Wetzel &
Van de Vijver were dominant in more than one of the running water samples, and Craticula elkab (O. Müller ex O. Müller) Lange-Bertalot Kusber & Cocquyt, Halamphora kevei Levkov and Ulnaria grunowii (Lange-Bertalot et Ulrich) Cantonati et Lange-Bertalot in Kusber et al.
were dominant in more than one of the soda pan samples. Other taxa not recorded in the database were rare species that occurred in only a few samples and were dominant in no more than one sample. We expected that a higher proportion of the species found in rivers and streams would be recorded in the database because the main species coverage is for temperate species (Bailet et al., 2019). Presumably, these taxa could be found in the sequences identified at the genus or higher level (Mort´agua et al., 2019). In some cases, incompleteness did not mean the lack of species but the lack of a sequence variant. Although clustering sequences into operational taxonomic units (OTUs) before taxonomic assessment can cause loss of genetic information (Keck et al., 2017), searching for exact matches (as the DADA2 pipeline does) can also be a limitation.
This was the case with N. paleacea in some samples in which this species was not found searching for exact matches with records of the database, but searching sequences identified at the genus level in the NCBI Gen- Bank revealed 99% similarity. In the case of Tabularia fasciculata (Agardh)Williams et Round, only two sequence variants were available in the reference database and these proved to be too short for compar- ison. Primer specificity or preferential amplification of some taxa could also cause differences (Bailet et al., 2019; Kermarrec et al., 2013a).
Another question is the intraspecific variability of the studied region and the coincidence between sequence differences and morphological subspecies/varieties/forms (Mora et al., 2019). For many species, a sequence of only one intraspecific taxon was available in the database, but another intraspecific taxon of the species was observed under the microscope. This factor is significant especially when different variants indicate different ecological status. For example, N. palea var. debilis indicates better ecological status than other N. palea varieties and was dominant in two samples based on morphology, but its sequences were identified as N. palea. Moreover, some subspecies and varieties were later raised to the species level based on only morphological analysis – for example, N. media and M. permitis according to Reichardt (2018) – or were reassigned to other species – for example, Nitzschia palea var.
tenuirostris became Nitzschia capeitellata var. tenuirostris (Bukhtiyarova, 1995).
Bailet et al. (2019) pointed out that misidentifications in the refer- ence database also leads to discrepancies between morphology- and DNA-based species compositions. Therefore, they emphasised the importance of continuous verification and curation of the reference database. This is particularly important considering the changing
taxonomy of diatoms. In several of our samples, N. reskoi was a dominant species that was not found among sequences when using a previous version of Diat.barcode (v7). Instead Nitzschia frustulum (Kützing) Gru- now was in high abundance based on sequences. This was because the TCC949 strain was identified as N. frustulum and it was updated as N. reskoi in the later version. Using version 9.2 allowed us to identify these sequences as N. reskoi.
4.2. Misidentification of similar or small species and cryptic species Misidentification can occur in microscopic investigation (Bailet et al., 2019), especially in the case of cryptic species (morphologically similar but different based on molecular methods; Mann and Evans, 2007) or when the distinguishing feature between similar taxa is not unambiguous in its description (Borrego-Ramos et al., 2021) or it can be seen only with an electron microscope. Nitzschia dissipata (Kützing) Rabenhorst and its former variant, N. media – now raised to the species level – sometimes cannot be easily separated (it depends on the closeness of raphe keel to valve edge, valve linearity; (Reichardt, 2018). This situation presumably occurred when N. dissipata was found based on microscopic analysis and N. media was identified according to sequence analysis. P. frequentissimum was often identified in our samples morphologically while P. victori was detected with metabarcoding.
P. victori resembles P. frequentissimum, and the main difference between them is their rbcL sequence (Jahn et al., 2017; Novis et al., 2012).
4.3. Environmental effect on morphology and phenotypic plasticity Environmental variables can affect valve ontogeny resulting in morphological changes (Cox, 2014). This can make microscopic iden- tification more difficult but does not affect the DNA sequence.
Extreme environmental conditions like low current velocity, drought, high temperature, ultraviolet radiation, mechanical damage by grazers, crowding, high salinity, a high level of nutrients, heavy metal contamination, toxic compounds or culturing can modify valve morphology in various ways, causing abnormal cells that can be used as indicators of environmental stress (Falasco et al., 2009, and references therein). In some of our samples, teratological forms of some species (A. minutissimum, Gomphonema micropus Kützing, Navicula tripunctata (O.F. Müller) Bory and Nitzschia inconspicua Grunow) were observed under the microscope in low proportions. In all of these samples, the normal form of the species was also found based on both aspects. The causes of teratological development of valves are still not fully under- stood. Previously, researchers had considered it was not induced by genetic changes because abnormal cells restored their normal morphology after sexual reproduction (Falasco et al., 2009). However, this theory has been challenged by Coquill´e and Morin (2019), whose experiments on Gomphonema gracile Ehrenberg suggest the heritability of the teratological character. Therefore, it is still unknown which DNA regions are affected by teratology and, therefore, it is unknown whether it could be detected with metabarcoding.
4.4. Cell biovolume, life form and cell wall resistance
Researchers have shown that the copy number of the chloroplast- encoded rbcL gene is related to the cell biovolume; therefore, a correc- tion factor has been developed to avoid this problem (Vasselon et al., 2018). When we applied this correction, we mitigated differences be- tween abundances of species obtained with the two methods, particu- larly in the case of the small-celled A. minutissimum, whose abundance is often underestimated based on rbcL read numbers. These findings are consistent with the results reported by Bailet et al. (2019); Mort´agua et al. (2019); and Borrego-Ramos et al. (2021) and confirm the benefit of applying the correction factor.
Several diatom species can form different kinds of colonies (Rimet and Bouchez, 2012) and this life form could affect the distribution of
cells of a taxon in samples. For example, Melosira varians Agardh forms chains; thus, not only cells but chains can get into the subsample dedi- cated to microscopy or another set aside for DNA analysis, leading to larger differences in relative abundances.
Detectability of species also depends on the thickness and resistance of their cell wall. The differences between thin-walled species like Fis- tulifera saprophila (Lange-Bertalot & Bonik) Lange-Bertalot and M. permitis are hard to observe under a light microscope; moreover, they can be destroyed during oxidising cleaning of frustules. By contrast, its wall enhances the extraction of its DNA, a fact that resulted in higher abundance based on sequences compared with morphology in our investigation as well as the studies by Kelly et al. (2020); P´erez-Burillo et al. (2020); and Borrego-Ramos et al. (2021).
4.5. Biases related to the properties of the samples
Organisms in a biofilm live in a matrix of extracellular polymeric substances (EPS) containing proteins, exopolysaccharides, metal ions, nucleic acids, lipids, and humic substances (Kumar et al., 2020). This matrix can retain extracellular DNA that can be detected only with metabarcoding and empty frustules that can be observed under a mi- croscope (Borrego-Ramos et al., 2021; Mora et al., 2019; Rivera et al., 2018).
In some of our samples, species that were recorded in the reference database and were found dominant under the microscope were not detected with metabarcoding. This was the case with A. minutissimum. It was found in 76 lotic and 8 soda pan samples with microscope and/or metabarcoding and in 63 and 6 samples, respectively, with both methods. In most cases when only one of the methods detected it, A. minutissimum had a low abundance (<1%). However, in three samples it was dominant (10.2%–41.7%) based on morphological analysis but not detected based on DNA sequences. Moreover, other Achnanthidium sequences were not observed in those samples. Because A. minutissimum has a high sensitivity value (5), its absence could cause shifts in the DNA- based IPS, indicating a status worse than the morphology-based index.
We hypothesise that the valves seen under the microscope belonged to dead or dying cells with DNA that was too degraded and PCR primers could not anneal to it. Mora et al. (2019) and Rivera et al. (2018) dis- cussed dead cells as a possible source of deviation between morpho- logical and metabarcoding results. They considered dead cells to be transported from a location other than the target assemblage (Mora et al., 2019) or settle from plankton (Rivera et al., 2018). Considering that A. minutissimum is a prostrate, low-profile diatom (Rimet and Bouchez, 2012) and a pioneer species during colonisation (Johnson et al., 1997), it cannot be ruled out that its cells gradually died as other species immigrated but its valves remained in the biofilm matrix.
Another explanation could be that primers perhaps could not anneal because of mutations in binding sites.
Diatoms can form resting stages to overcome periods adverse to growth (Kooistra et al., 2007), from which DNA could be extracted (Piredda et al., 2017), but species could not be identified in this form under the light microscope. In the samples there can be substances such as polysaccharides, humic acids that can inhibit PCR amplification but were not removed during DNA purification (Semenov, 2021).
5. Conclusions
In the present study, we evaluated the performance of metabarcod- ing in ecological status assessment of Hungarian waters and compared it to the validated morphology-based method. We found significant cor- relations between the two methods regarding community composition, diatom indices and the relationship with environmental variables.
However, there were considerable discrepancies in species composition that can only be partly mitigated using correction according to cell biovolume. Discrepancies in species compositions led to contradictory ecological status assessment: a considerable part of the running water