Voting Based Sensor Fault Detection for Dissimilar Aircraft Position Measurements During Final Approach
Tamas Grof1 and Peter Bauer1
Abstract— In this work a fault-detection algorithm for air- craft position measurements is proposed using redundant sensor information during landing scenarios. The real flight data which is used in the course of the development and testing phase was collected in the framework of the VISION EU H2020 research project. The aircraft’s position measurements were provided by an onboard GPS unit with SBAS correction, an Inertial- Barometric-Camera sensor fusion based ESKF algorithm and a simulated ILS unit which was modeled in a Matlab/Simulink environment. The simulated ILS values were generated with the use of the real SBAS position measurements. Taking the properties of the data sets into account a simple threshold and voting logic based fault detection algorithm was proposed.
Corrupted ILS and SBAS measurements were artificially gener- ated with real fault properties. Category I Precision Approach requirements are considered to test the error models and the developed fault-detection algorithm. Considering the real flight data the threshold and voting logic parameters were tuned accordingly. For testing the developed algorithm a Monte-Carlo simulation was constructed to test the efficiency of the algorithm with different parameter sets. Finally, the results are compared to the Category I requirements focusing on the Integrity risk, Continuity risk and Time-To-Alert specifications.
I. INTRODUCTION
Aerospace applications require a certain level of redun- dancy ([12], [18]) as the mandatory levels of safety can only be achieved by redundant systems. Considerable number of research is carried out in the field of using the visual infor- mation as a redundant source in aerospace applications such as [3] and [14]. The latter considers the visual information as the third redundant source of the aircraft’s position besides the GPS and the ILS (Instrumental Landing System) during landing scenarios. Different methods are considered in order for the redundant sources to provide the required levels of the safety ([12], [18], [10], [6]). Filtering out the corrupted sensory information can be achieved by using redundant systems. Measuring the same variable with an N number of independent sensors and assuming that among them M sensors can operate with a satisfactory level of accuracy, then the faulty unit can be found by using suitable algorithms such as voting logics or statistical methods. By pairing up the measurements of the redundant sensors and applying a score system based on the deviation between the pairs, the faulty sensor can be ruled out. Existing voting logic algorithms
*This is the author version of article published at SYSTOL 2021 Conference (IEEE).c This paper was supported by the J´anos Bolyai Research Scholarship of the Hungarian Academy of Sciences. The research presented in this paper was funded by the Higher Education Institutional Excellence Program.
1Tamas Grof and Peter Bauer are with Systems and Control Laboratory, Institute for Computer Science and Control (SZTAKI), Budapest, Hungary (e-mail: bauer.peter@sztaki.hu).
include the two out three method where it is assumed that out of three working sensors two can provide accurate information. Profiting from the measurements of the camera sensor has been a topic of interest in several fields. Equipping the aircraft with a visual sensor gives another source of information regarding the aircraft’s position during final approach scenarios. As it was mentioned, with 3 independent sensors the voting logic based fault detection algorithm can be implemented. Excessive research can be found on the subject of developing voting logic algorithms. For similar sources [17], [1] uses binary values which represent exact voting. In [9], [8] dissimilar sources are used for the voting logic algorithm which represent inexact voting. Dissimilar noise levels can make the threshold selection challenging as in ([10], [6]). One possible way to overcome this is the application of a soft voting with properly tuned Fuzzy sets ([6]) however, that method does not directly consider the information about signal noise levels. In [15] and [16]
GPS,Vision and Barometric sensor information is used in a tightly coupled Error-State Kalman Filter (ESKF) estimator and the fault detection is handled in the framework of the ESKF system.
The current work continues a research that was presented in [4] as an IFAC World Congress 2020 conference paper.
In that work three simulated sensor sources are considered (GPS, ILS, Vision) with different outputs and noise levels.
That research considered the different noise intensity levels of the sensors and aimed to provide a Z-test-based two out of three (2oo3) voting logic for dissimilar sensor sources and compare it to conventional thresholding method for the positioning of a landing aircraft. The simulated sensor units in [4] had different noise intensity levels. The uncertainty of the pure Camera measurements greatly surpass the noise levels of the ILS and GPS units. Therefore, the use of the statistical method was required.
This paper aims to further improve the results that were presented in [4] by using real flight data obtained in the framework of the VISION EU H2020 research project.
During the test flights the aircraft was equipped with a GPS unit, an Inertial Measurement Unit (IMU), a Baromet- ric sensor and a Camera sensor. Considering the available data, a Camera-IMU-Barometric based ESKF algorithm was constructed which complements the GPS measurements. For the third source of information a Simulink based ILS unit was chosen. Parting from the simulation the ESKF greatly improves the noise levels of the Camera sensor which results in the soruces having relatively similar noise characteris- tics. In this study the sources are loosely coupled as each
Fig. 1. Septfonds runway and VISION K-50 test aircraft
source provides position information about the aircraft in an independent manner. The goal of the paper is to provide reliable and simple fault detection algorithm for position measurements without the necessity to specify the sources.
Due to those facts a simple threshold and voting logic based algorithm is proposed.
The structure of the article is as follows: Section II introduces the sensor units that were used during the flight data collection. Section III presents the error models that are used to corrupt the nominal measurements. Section IV summarizes the Category I Precision Approach requirements which are utilized for examining the error models and the results of the testing phase. In section V the fault detection algorithm is detailed considering the voting logic algorithm and threshold selection. Finally, section VII concludes the paper.
II. SENSOR UNITS
The real flight data which is used in the course of the development and testing phase was collected in the frame- work of the VISION EU H2020 research project. The flight data sets were collected at a runway in Septfonds, France during the summer of 2019 with the specifically developed K-50 test aircraft. Eight test flights were performed but two of them provided corrupted flight data. Therefore only six sufficient data sets are available for the purpose of testing the developed algorithm. The test aircraft and the Septfonds runway can be seen in Figure 1. During the test flights the aircraft was equipped with several sensor units in order to collect the necessary measurements for future testing and simulation scenarios. The onboard system recorded the measurements from the GPS, IMU, Barometric and Camera sensors. During the test flights, the sensors operated with different sampling frequencies. The IMU and the SBAS unit ran at 50Hz and 20Hz respectively. The camera had higher processing times with 10Hz. Although the barometric sensor had similar sampling frequency as the IMU unit, the provided values are quantized. Thus new values arrive with an effective frequency of approximately 2Hz. The problem of the different sampling frequencies will be addressed in the sequel.
A. IMU-Camera-Barometric sensor based ESKF filter In a different study of the authors which is submitted and currently under revision in Elsevier Control Engineer- ing Practice, an ESKF algorithm was proposed for aircraft state estimation during landing scenarios assuming unknown runway sizes. The ESKF algorithm fuses the measurements of the Inertial Measurement Unit, the Barometric sensor and the Camera sensors to obtain the desired states of the aircraft which includes position, velocity, orientation, possible sensor biases and the width of the unknown threshold line. The obtained position values from that study are used in this work as an independent source. The filter was constructed in a way that it provides the position values in a Runway relative system.
In the ESKF framework the filter’ prediction process operates with the IMU’s freqeuncy, while the correction step is executed when new Camera information becomes available. Therefore, the sampling frequency for the the ESKF algorithm matches the frequency of the IMU unit.
B. GPS measurements using SBAS correction
During the test flight, the GPS measurements were cor- rected by a Satellite Based Augmentation System (SBAS) that greatly improves the precision of the GPS measurements.
[5] gave a detailed presentation about GBAS/SBAS systems.
The presentation declares that the SBAS and Ground Based Augmentation System (GBAS) technology is ready to be applied in automated landing as it meets the precision requirements. Therefore, the SBAS technology can be con- sidered accurate enough for autopilot systems. [13] provide research on GNSS with augmentation systems such as SBAS which is considered as the successor of the ILS regarding precision levels.
From the available sensory information the SBAS cor- rected GPS unit can provide standalone position and velocity information. The position values are provided as Latitude- Longitude-Altitude values while the velocity measurements are recorded as horizontal and vertical speed values with a corresponding heading angle to clarify the direction of the aircraft. The LLA measurements are then transformed into Runway relative position values using the necessary trans- formations. Similarly, the recorded horizontal and vertical velocity values were transformed into the Runway frame.
Since the SBAS unit has a sampling frequency of 20Hz a numerical integration method was used to match the sampling frequency of the ESKF filter with 50Hz. As it was mentioned the SBAS provides the velocity of the aircraft and with that additional information the NED position values between SBAS measurements can be approximated using the following formula:
P(t+∆tP) =P(t) +V(t)·∆tP (1) Where P(t+∆tP) is the approximated position value between two measurements. According to the sampling frequencies of the ESKF and the SBAS units, ∆t can be assumed as 0.01s, 0.02s, 0.03sor 0.04s. Therefore the values
Fig. 2. SBAS measurement propagation for 50Hz
obtained by the numerical integration can be considered accurate. Figure 2 illustrates the process where the red signal refers to the original SBAS values while the green line represents the predicted SBAS values between the two original measurements.
C. Insturmental Landing System
The ILS uses radio waves to guide the incoming aircraft onto the runway. The ILS measures the aircraft’s position in terms of deviation from the glideslope and localizer refer- ences. The localizer provides information about the aircraft’s horizontal position with respect to the runway, while the deviation from the nominal 3◦glideslope is the vertical offset from the designated landing slope.
Unfortunately, in the framework of the VISION EU H2020 research project, the test aircraft and the airport were not equipped with an ILS sensor, therefore no real ILS measure- ments are available for this study. During the development phase, in order to solve this problem the ILS measurements were simulated in a Matlab/Simulink environment with the SBAS measurements as input variables. That way the the ILS sensor’s information depends on the SBAS measurements.
Important to note that, if no offset weighs on the measure- ments then the only difference between the ILS and SBAS signals is the dissimilar Gaussian noise which weighs on the measurements.
Therefore, the signals can be decomposed to a nominal and error components. Assuming that the ILS would provide reasonably accurate measurements, then the nominal part of the SBAS and the ILS would be similar. Using that fact, the above mentioned problem was countered by applying a cubic smoothing spline for the SBAS measurements. That way the additional Gaussian noise that distorts the SBAS signal can be removed and the nominal part of the SBAS measurement mostly recovered. Lastly, additional noise is added to the nominal part. The noise values that are added in that model were acquired using real ILS characteristics and parameters by [2] in the VISION project.
The following conversion is used to obtain the deviation in the glideslope and localizer references from the SBAS measurements:
dYloc=−YRWY
dZgld=−ZRWY−(−XRWY+ttd)·tanγ (2) WhereXRWY,YRWY andZRWY refer to the position data from the SBAS unit in the mentioned runway relative coordinate
system, γ is the glide slope angle while ttd is the distance of the touchdown point from the runway threshold.dYloc is the localizer deviation anddZgld is the glide deviation (both considered in meter unit). After the conversion additional noise is added to the signals.
In order to compare the different outputs of the GPS, ILS and ESKF systems some common parameters are needed.
The ESKF provides position information in a runway relative system while the SBAS yields LLA coordinates as output.
Finally, the ILS measures the deviation from the glideslope and localizer references. During the development phase, it was decided that the applied common parameters should be the values provided by the ILS. Therefore, outputs of the other systems have to be transformed into the common format.
III. SIMULATED ERROR MODES
The sensory information from the data sets are considered nominal. In order to test the algorithm with inaccurate mea- surements, the data sets were corrupted using the Simulink simulation. In every simulated error scenario additional bias and/or noise values were added to the nominal signals. In case of the ILS system the simulated error model is comes from measurements of real landing scenarios (by Electronic Navigation Research Institute, Japan (ENRI)). The model assumes an object to be placed near the runway which causes perturbation in the ILS system. The ILS fault generation algorithm has two modes in total in accordance with the position of the interfering object. The simulated error values depend on the distance of aircraft and the runway’s threshold.
The two ILS error models are denoted asENRI1andENRI2 modes in the context of this paper.
The GPS error simulation block again from ENRI has five error modes in total. The modes include the SBAS system operating with only four satellites, SBAS with ionospheric perturbation and three GPS modes such as regular, four satellite and large range error modes. The mentioned GPS error modes are denoted as SBAS2, SBAS3,SBAS-1,SBAS- 2 andSBAS-3respectively in the context of this paper. The inputs of the error model includes the position of the aircraft, the position of the receiver station and the date of the flight.
The magnitude of deviation from the nominal mode varies between the different modes.
In case of the ESKF measurement two possible error scenarios were considered. Firstly, a loose horizontal camera mounting was considered which corrupts the known relation between the Camera and Body systems and therefore has a negative impact on the position estimations. It was assumed that the magnitude of the camera angle error scales with the aircraft’s acceleration. However, due to the characteristics of the ESKF estimator the corrupted camera angles were filtered out and appeared in the Yaw angle estimations while the position values were slightly affected.
Figure 3. shows that the perturbation which affects the mounting of the camera in the Body coordinate system appears in the Yaw angle estimation. As it can be seen, correcting the estimated Yaw angles with the angle error
4 4.2 4.4 4.6 4.8 5 5.2 5.4 5.6 5.8 6 -10
-5 0 5
Camera angle error [°]
4 4.2 4.4 4.6 4.8 5 5.2 5.4 5.6 5.8 6
Time [s]
-10 0 10
Yaw angle [°]
ESKF w/o camera angle error ESKF w/ camera angle error ESKF w/ corrected camera angle error
Fig. 3. Camera angle perturbation for ESKF error scenario
values, the corrected measurements follow the reference values.
Another attempt was made by perturbating the input values from the IMU unit. By jamming the IMU unit, the input acceleration values were not updated in the ESKF. However, showing the robustness of the filter, the position estimations were slightly affected, and the corrupted acceleration values appeared in the form of acceleration bias.
Due the robustness of the ESKF estimator, it was decided that only the ILS and GPS error modes will be be used in the framework of this paper.
IV. REQUIREMENTS
As aerospace applications are safety critical, certain re- quirements are need to be met during landing scenarios in order to ensure the safety of the aircraft and its environment.
Existing Category I Precision Approach requirements are the following:
Horizontal Accuracy = 16m, Vertical Accuracy = 4m, Integrity risk = 1−2·10−7per approach, Time−To− Alert=6sandContinuity risk=1−8·10−6per15s.
In the next step of development phase, the mentioned error modes were examined with respect to the Horizontal and Vertical accuracy values to determine which error modes breach the safety requirements. As it was mentioned, six data sets are available from the test flights. Figures 4. and 5 display the perturbated data sets. Each case of flight data were corrupted with every available error mode (five modes for the GPS, and two modes for the ILS values). The figures show that only the SBAS error modes breach the Category I requirements and the violation is isolated to the glide modes.
The perturbated ILS values are well below the Category I accuracy limits for both localizer and glide cases. Due to those facts, the aim of the fault detection algorithm is to determine the faults which violate the defined accuracy values. Hence in this study the focus is to identify the possible faults in the SBAS measurements.
The mentioned Integrity and Continuity risk values equal the possibilities for the False Alarm and Missed detection similarly to [7]:
-400 -350 -300 -250 -200 -150 -100 -50
Distance to Runway [m]
0 10 20
Glide error [m]
Error modes glide
SBAS2 SBAS3 SBAS-1 SBAS-2 SBAS-3 ENRI1 ENRI2 Accuracy limit
Fig. 4. SBAS error modes compared to the Accuracy limits
-400 -350 -300 -250 -200 -150 -100 -50
Distance to Runway [m]
0 5 10 15
Localizer error [m]
Error modes localizer
ENRI1 ENRI2 SBAS2 SBAS3 SBAS-1 SBAS-2 SBAS-3 Accuracy limit
Fig. 5. ILS error modes compared to the Accuracy limits
PFA=P(data>T HS|no error)·P(no error) (3) PMD=P(error>Limit)P(data<T HS|error)P(error) (4) WherePFA is the probability of a false alarm, while PMD is the probability of a missed detection scenario. In aerospace applications P(no error) is the probability of a fault free flight and its value is assumed as P(no error) =1. On the other hand, P(error) represent the possibility of an error scenario such as satellite failures and its value is known in advance. P(data>T HS|no error) is defined as the probability of the measurement exceeding the specified threshold limit in an error free scenario. The likelihood of the measurement being lesser than the threshold is defined as P(data<T HS|error). During the development phase the goal is to minimize the P(data>T HS|no error) and P(error>Limit)probabilities in order to reduce the number of false alarms and missed detections. That goal can be achieved by applying a voting logic algorithm and estab- lishing a sufficient threshold.
V. THRESHOLD AND VOTING LOGIC BASED FAULT DETECTION ALGORITHM
The first step in implementing the simple thresholding algorithm is to find a nominal noise threshold for each system. In real life applications the real position values are unknown therefore pairwise comparison of system out- puts should be done. The pairings are compared to their respective threshold values in order to detect outliers and faulty scenarios. In this paper for the thresholding method the following sensor pairings are considered: SBAS-ILS pair (SvsI), ESKF-SBAS pair (EvsS) and ILS-ESKF pair (IvsE).
As the SBAS error models contain stochastic processes a Monte-Carlo simulation was carried out in order to find satisfactory threshold values for the sensor pairings. After
0 1 2 3 4 5 6 7 0
0.2
0.4 Recursive Faulty glide EvsS
0 1 2 3 4 5 6 7
0 0.5 1
P(data<THS | error) [-]
Recursive Faulty glide IvsS
CDF THS
Fig. 6. Cumulative distribution function forP(data<T HS|error)
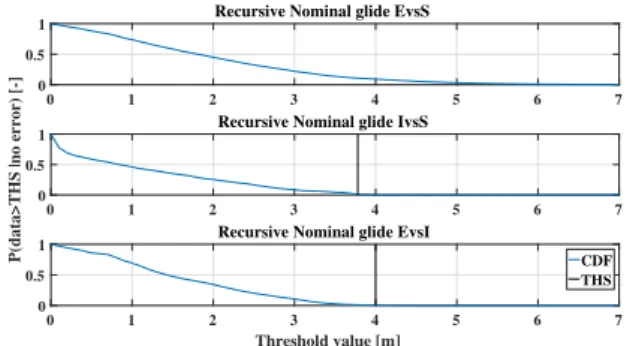
obtaining sufficient amount of data, the threshold values can be selected by using the Cumulative distribution functions of the pairings as it can be seen in Figures 6 and 7.
Violation of a pair indicates that a pairing exceeds the predefined threshold value. However, the violation can be caused by a sudden spike or outlier in the measurements. To counter that phenomenon before the threshold selection and the pairwise comparison of the signals, a recursive mean formula was applied to the measurement for the sake of decreasing the effects of the noise values which are distorting the signals. The following formula was used for calculating the recursive mean:
µt=t−1
t ·µt−1+1
t ·xt (5)
Another solution for countering spikes in the data is to apply up-down counters. For each subsystem there is an assigned count value which monitors the performance of that subsystem. As the glide (gld) and localizer (loc) positions are handled separately six up-down counter values are defined as SBASgld,ILSgld,CAMgld,SBASloc,ILSlocand lastlyCAMloc. However, as it was stated in IV., in this study the focus is to determine faults in the SBAS glide subsystem, as the other error modes fall below the specified requirements.
Upon violation of the threshold limits, a specified rule system is applied with the following rules:
1) If all three pairings stay below the thresholds all of the count values are decreased by the downcount parameter if they are non-zero.
2) If only one pair exceeds the given threshold there is no way to determine which one of the two sub-systems is defective so the count values dont change, except the third one is decreased by the downcountparameter.
3) If two pairs exceed the given threshold the sub-system which is featured in both can be considered the one causing the error. In that case the algorithm increases the count of that system by anupcountparameter while decreases the other two.
4) As a worst case scenario, if all the pairings exceed their nominal thresholds, all three of the count values will be increased.
The parameters of the voting logic algorithm are the UPcount,DOWNcountandENDcountvalues. The mentioned Time-To-Alert requirement in section IV aids the tuning of the voting logic parameters.
0 1 2 3 4 5 6 7
0 0.5
1 Recursive Nominal glide EvsS
0 1 2 3 4 5 6 7
0 0.5 1
P(data>THS |no error) [-]
Recursive Nominal glide IvsS
0 1 2 3 4 5 6 7
Threshold value [m]
0 0.5
1 Recursive Nominal glide EvsI
CDF THS
Fig. 7. Cumulative distribution function forP(data>T HS|no error)
SvsE SvsI EvsI Up Down End
Batch Nr1. 5.3m 4m 4m 10 5 100
Batch Nr2. 3.3m 3.78m 4.5m 2 1 100
Batch Nr3. 3.3m 3.78m 4.5m 2 1 200
Batch Nr4. 4.3m 3.78m 4.5m 2 1 200
Batch Nr5. 5.1m 3.78m 4.5m 2 1 100
Batch Nr6. 5.3m 3.78m 4.5m 2 1 100
TABLE I
MONTECARLO TEST CAMPAIGN PARAMETERS
VI. REAL FLIGHT DATA BASEDMONTECARLO SIMULATION
The developed fault detection algorithm was tested with the mentioned real flight data with simulated error modes. As it was stated the error models contain stochastic processes therefore a Monte Carlo simulation testing was designed in order to thoroughly analyze the developed process. The threshold selection and the voting logic algorithm was de- tailed in Section V. During the Monte Carlo test campaign different test batches were considered with various Threshold limits and different voting logic parameters. As the algorithm operates at a frequency of 50Hz, the Time-To-Alert time- span can be calculated by the following formula: EndU p ·0.02s.
Which results in 0.2s, 1sand 2sfor the batches.
Table I. shows the parameters for the Monte Carlo simula- tion.SvsE,SvsIandEvsIrefer to the applied threshold values between the subsystem in case of the glide comparison.
WhileUp,Down andEnd indicate the specification for the voting logic algorithm.
Table II. displays the results of the Monte Carlo simulation campaign for the different batches. The correct decision ratio falls between 94−98%, while a clear trade-off can be seen
Correct False Alarm Missed det Batch Nr1. 94.01%(1461) 0.45%(7) 5.53%(86) Batch Nr2. 97.7%(1565) 1.31%(21) 0.99%(16) Batch Nr3. 97.7%(1313) 0.97%(13) 1.33%(18) Batch Nr4. 96.3%(1502) 0.898%(14) 2.82%(44) Batch Nr5. 95.02%(1699) 0.17%(3) 4.81%(86) Batch Nr6. 95.1%(1712) 0.17%(3) 4.81%(85)
TABLE II
MONTECARLO TEST CAMPAIGN RESULTS
1 2 3 4 5 6 7 8 9 10 Time-To-Alert [s]
0.82 0.84 0.86 0.88 0.9 0.92 0.94 0.96 0.98
TTA probability [-]
Time-To-Alert probabilites
Batch1 Batch2 Batch3 Batch4
Fig. 8. Batch 6 Time-To-Alert occurrences
Integrity risk Continuity risk TTA Batch Nr1. 1.152·10−7 4.5·10−3 0.2s Batch Nr2. 0.21·10−7 13.1·10−3 1s Batch Nr3. 0.28·10−7 9.7·10−3 2s Batch Nr4. 0.59·10−7 8.98·10−3 2s Batch Nr5. 1.001·10−7 1.7·10−3 1s Batch Nr65. 0.984·10−7 1.7·10−3 1s
TABLE III
RESULTS COMPARED TO THECAT IREQUIREMENTS
between the false alarm and missed detection ratios. Higher threshold values and increased Time-To-Alert period result in increased number of missed detection, while lower threshold and decreased TTA parameters raise the number of false alarms.
In Section IV the Category I requirements were summa- rized which included Integrity and Continuity risk probabili- ties. Worst case Integrity risk occurs whenPMD=P(error>
Limit)P(data<T HS|error)P(error)reaches its maxima. As it was discussed P(error>Limit) equals 1 and P(data<
T HS|error) equals the Missed detection ratio in Table II.
In this paper SBAS faults are considered as the ILS error models does not exceed the specified Alert Limit values.
The probabilities for the internal SBAS error modes can be found in [11]. The highest error mode probability is when the SBAS correction malfunctions and only the regular GPS mode operates correctly (SBAS-1 mode). Hence in this study the worst case P(error) corresponds to the probability of an internal SBAS error. An internal SBAS error can occur due to several reasons such as clock failures (excessive acceleration), low signal power, ephemeris error, signal de- formation failure, code carrier divergence. Each threat has a P(error) =10−4 per one hour, which translates into a cumulativeP(error) =5·10−4per one hour. Projecting that value for a 15 sec interval results inP(error) =2.083·10−6 per 15sec.
Figure 8 shows the probability for the Time-To-Alert values in case of the faulty scenarios. It displays that the 6s TTA limit is satisfied in more than 97% of the fault scenarios for Batch 6. Table III. shows that the Integrity risk requirement is satisfied for all tested threshold values and voting logic parameters. Since in every batch there are some false alarm, the continuity risk remains higher than the specified requirement. In order to reach the desired level
of continuity the thresholds need to be increased which would cause more miss detection and as a result the integrity risk would exceed the desired levels.From a safety critical standpoint, surpassing the continuity risk would result in increased number of aborted landings. However, in case of an SBAS error in a 2 out of 3 voting logic system the other 2 sources are assumed to operate sufficiently and such the final approach maneuver can continue.
VII. CONCLUSIONS
In this work two statistical algorithms are presented to pro- vide reliable fault detection of aircraft position measurements from redundant sensor information during final approach.
The aircraft’s position can be determined via ILS, GPS with SBAS correction and an Error State Kalman Filter which incorporates the measurements of an Inertial Measurement Unit, Barometric and Camera sensors. The SBAS and ESKF measurements were collected in a real flight test, while the ILS was simulated based on the smoothed SBAS readings in a Matlab/Simulink environment. Real fault characteristic based error models are introduced which are used to corrupt the nominal measurements. Category I Precision Approach requirements are presented to develop and tune the threshold and voting logic based fault detection algorithm. The Monte Carlo test campaign showed that the Integrity risk and Time- To-Alert requirements are achievable for every parameter set while the continuity risk exceeds the required levels off safety.
REFERENCES
[1] P. Balasubramanian, K. Prasad, and N. E. Mastorakis, “A Fault Tolerance Improved Majority Voter for TMR System Architectures,”
WSEAS Transactions on Circuits and Systems, vol. 15, 2016. [Online].
Available: http://arxiv.org/abs/1605.03771
[2] J. E. Electronic Navigation Research Institute, “Enri webpage.”
[Online]. Available: https://www.enri.go.jp/eiwac.html
[3] V. Gibert, F. Plestan, L. Burlion, J. Boada-Bauxell, and A. Chriette,
“Visual estimation of deviations for the civil aircraft landing,”Control Engineering Practice, vol. 75, pp. 17 – 25, 2018.
[4] T. Grof and P. Bauer, “Voting-based fault detection for aircraft position measurements with dissimilar observations,” inIn: 1st Virtual IFAC World Congress (IFAC-V 2020), 2020.07.11-2020.07.17, Berlin., 2020.
[5] M. H. Guilhamu. (2019, June) Airbus Fleet Readiness for GBAS/SBAS. [Online]. Available:
https://www.icao.int/APAC/Meetings/Pages/2019-GBAS-SBAS-.aspx [6] R. Hoseinnezhad and A. Bab-Hadiashar, “Fusion of Redundant Infor-
mation in Brake-By-Wire Systems Using a Fuzzy Voter,”JOURNAL OF ADVANCES IN INFORMATION FUSION, vol. 1, no. 1, 07 2006.
[7] M. Joerger and B. Pervan, “Kalman filter-based integrity monitoring against sensor faults,”Journal of Guidance, Control, and Dynamics, vol. 36, 03 2013.
[8] A. Karimi, F. Zarafshan, S. A. R. Al-Haddad, and A. Ramli, “A Novel N -Input Voting Algorithm for X -by-Wire Fault-Tolerant Systems,”
The Scientific World Journal, vol. 2014, p. 672832, 10 2014.
[9] S. Latif-Shabgahi, “An Integrated Voting Algorithm for Fault Tolerant Systems,” inIn Proc. of 2011 International Conference on Software and Computer Applications, 2011.
[10] N. Y. Lii, S. Sturm, and T. A. Coombs, “A Study on Sensor Fusion for Fault Tolerant Brake-by-Wire Driver Input Design with Dissimilar Sensors,” inIn Proc. of SAE 2006 World Congress & Exhibition, 2006.
[11] S. Pullen and P. Enge, “Using outage history to exclude high-risk satellites from gbas corrections,”Navigation, vol. 60, 03 2013.
[12] J. R. Sklaroff, “Redundancy Management Technique for Space Shuttle Computers,”IBM Journal of Research and Development, vol. 20, no. 1, pp. 20–28, Jan 1976.
[13] Q. Tessier, C. Macabiau, C. Milner, L. Azoulai, and F. Fernandez,
“Modelling the Range and Position Error after EGNOS Orbit and Clock Corrections,” in Proc. of the 30th International Technical Meeting of the Satellite Division of The Institute of Navigation (ION GNSS+ 2017), 11 2017.
[14] VISION, “Vision project webpage,” 2016. [Online]. Available:
https://w3.onera.fr/h2020 vision/
[15] Y. Watanabe, “Vision-integrated navigation and integrity monitoring for aircraft final approach,” in21st IFAC World Congress in Berlin, Germany. July 12-17, 2020.
[16] Y. Watanabe, A. Manecy, A. Amiez, S. Aoki, and S. Nagai, “Fault- tolerant final approach navigation for a fixed-wing uav by using long- range stereo camera system,” in 2020 International Conference on Unmanned Aircraft Systems (ICUAS) Athens, Greece. September 1-4,, 2020.
[17] J.-Y. Wu, D.-R. Duh, T.-Y. Wang, and L.-Y. Chang, “Fast and Simple On-Line Sensor Fault Detection Scheme for Wireless Sensor Net- works,” inEmbedded and Ubiquitous Computing, T.-W. Kuo, E. Sha, M. Guo, L. T. Yang, and Z. Shao, Eds. Berlin, Heidelberg: Springer Berlin Heidelberg, 2007, pp. 444–455.
[18] Y. C. Yeh, “Design considerations in boeing 777 fly-by-wire comput- ers,” inProceedings Third IEEE International High-Assurance Systems Engineering Symposium (Cat. No.98EX231), Nov 1998, pp. 64–72.