Co-evolution Analysis of Production and Test Code by Learning Association Rules of Changes
László Vidács
MTA-SZTE Research Group on Artificial Intelligence University of Szeged
Hungary lac@inf.u-szeged.hu
Martin Pinzger
Software Engineering Research Group University of Klagenfurt
Austria martin.pinzger@aau.at
Abstract—Many modern software systems come with auto- mated tests. While these tests help to maintain code quality by providing early feedback after modifications, they also need to be maintained. In this paper, we replicate a recent pattern mining experiment to find patterns on how production and test code co-evolve over time. Understanding co-evolution patterns may directly affect the quality of tests and thus the quality of the whole system. The analysis takes into account fine grained changes in both types of code. Since the full list of fine grained changes cannot be perceived, association rules are learned from the history to extract co-change patterns. We analyzed the occurrence of 6 patterns throughout almost 2500 versions of a Java system and found that patterns are present, but supported by weaker links than in previously reported. Hence we experimented with weighting methods and investigated the composition of commits.
Index Terms—software evolution, change analysis, machine learning, co-evolution patterns, testing
I. INTRODUCTION
Software development produces a tremendous amount of data about the development process and the software itself that are recorded in software repositories, such as GitHub and Bitbucket. They track, for instance, changes to files, in particular which developer changed which file when and how, and bug reports submitted by users. To extract the valuable part of the data from the evolution point of view, repository mining techniques are usually applied. In this research project, we em- ployed repository mining techniques combined with machine learning to assess the co-evolution of production and test code.
Balanced co-evolution of source code and other development artifacts is an important factor in maintaining software quality of evolvable systems [1], [2]. In recent years, as large amount of test code also needs significant effort to maintain, test suite evolution received increased interest [3]. Today test code is treated as a first class citizen in software projects, which urges the in depth understanding of the relation of production and test code. This fosters traceability research [4], [5], [6] and makes the co-evolution analysis of production and test code an emerging topic [7], [8].
The aim of this paper is to analyze the history of production and test code changes to reveal whether co-evolution patterns in project history are followed in order to keep software quality at the desired level. The research approach followed in this
work is based on a recent study by Marsavina et al. [8].
We applied repository mining, test coverage analysis and association rule learning techniques to obtain patterns of co- evolution. The main point of this study is the replication of the previous experiment, with additional analysis to give deeper insight into how co-evolution happens. We provide the following contributions in this paper:
• Replication of Marsavinaet al.[8] on one system.
• Extended analysis of project properties, experiments with change weighting methods and analysis of composition of commits.
II. CO-EVOLUTIONANALYSIS A. Overview
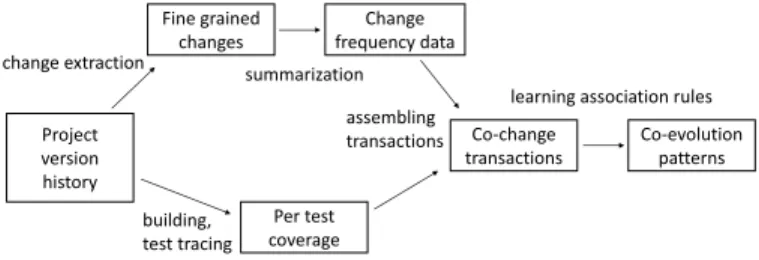
This work is based on the study by Marsavinaet al.[8] on mining co-evolution patterns. In that study the authors iden- tified production and test code co-evolution patterns through aggregating fine-grained changes and applying association rule learning on changes measured through the project history. The direction of the analysis is from production classes to test classes. We replicated the analysis method, in which the main question is:When developers change production code, do they change test classes as well (and how)?
Project version history
Fine grained changes
Per test coverage
Co-change transactions
Co-evolution patterns Change
frequency data change extraction
building, test tracing
summarization assembling transactions
learning association rules
Fig. 1. Analysis process overview
The overview of the analysis process is shown in Figure 1.
First, fine-grained change information is extracted form the version control system for each commit. Second, dynamic analysis is used to obtain test coverage data for each commit.
Based on these two sources, we use association rule learning to find regular patterns of developer behaviour, for example whether introducing a new class in a commit implies that a new test class in also introduced. The link between production
TABLE I
OVERVIEW OF THE ANALYZED PROJECT
Project # First version Last version # Versions # Versions
Versions # # Prod. # Test Date # # Prod. # Test Date Non-building Non-building analyzed Classes Methods Methods Classes Methods Methods due to Test fail. due to Cov. fail.
commons-lang 2470 115 2020 1622 2009-10-13 206 3025 3880 2016-05-29 80 16
TABLE II
OVERVIEW OF THE ANALYZED PROJECT FROMMARSAVINAet al.
Project # First version Last version # Versions # Versions
Versions # # Prod. # Test Date # # Prod. # Test Date Non-building Non-building analyzed Classes Methods Methods Classes Methods Methods due to Test fail. due to Cov. fail.
commons-lang (Mars.) 3856 31 373 318 2002-12 177 2442 2851 2014-02 54 -
and test classes is provided by the dynamic analysis, since during the rule mining we consider only those test classes which in fact exercise (cover) the changed production class.
Besides our base study [8], there were similar approaches applied for co-evolution analysis. Our study goes back to earlier works by Zaidmanet al.[7], [9]. Pintoet al.provided a large-scale study of test suite evolution emphasizing the need for understanding how tests evolve to aid other purposes like automatic repair techniques [3], [10]. Marinescu et al.
provided a framework that combines static and dynamic anal- ysis of tests and their coverage throughout the version history for C/C++ programs [11]. We apply a similar approach for analyzing Java source code. Co-evolution analysis needs a proper link between tests and the related production classes.
Rompaey et al. compared several test to code traceability methods, including the use of naming conventions and var- ious structural and conceptual methods [6]. Ghafari et al.
presented a method level traceability solution [12]. A remark- able solution is provided by Qusef et al., which combines program slicing and information retrieval methods [4], [13].
Teleaet al.[14] used code visualization for evolution analysis of production code. Ens et al. provided the ChronoTwigger tool to support visual analytics of test and code evolution [15].
In our study we rely on a state of the art solution to address the following research questions:
RQ1: Do production and test code evolve in sync?
RQ2: What kind of fine-grained co-evolution patterns be- tween production and test code can be identified?
B. Project history
In this report we provide a detailed analysis of the commons-langproject. Table I shows the main characteris- tics of the analysis, while in Table II values from the original study can be seen. The tables report project sizes in the first and in the last analyzed versions for each study. The number of non-building versions is slightly higher in our case, but compared to all versions analyzed it is negligible. We also report the number of failed builds because of failing coverage measurements, which is a small number as well. In total 2470 versions were analyzed with more than 4 years overlap with the original study in the project history. We did not consider
0 500 1000 1500 2000 2500
01000200030004000
Number of Production and Test methods over measured project history
Measured versions
Number of methods/tests
methods tests
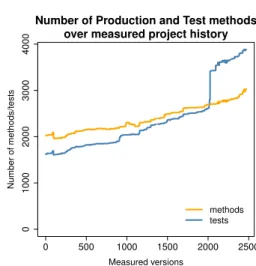
Fig. 2. History of the number of production and test classes
0 500 1000 1500 2000 2500
0.700.750.800.850.900.951.00
Method level coverage over measured project history
Measured versions
Coverage
Method coverage
Fig. 3. History of the method level coverage
early versions since we used a more precise source code level instrumentation, for which maven integration was necessary.
The analysis of the project history may be biased if there are too many exceptional events or large changes in the project workflow. In Figure 2 the history of the number of production
and test classes is shown. The addition of new production classes is balanced; and test classes are also added in parallel.
The two curves follow each other in most of the time. There is one huge increase in the number of test classes, but this is a unique occasion. Another important aspect we measured is the global coverage of all tests. In Figure 3 the method level coverage ratio is depicted. Note that the coverage ratio was already relatively high at the beginning of our measurements, the scale of theyaxis starts at 0.7 coverage. There is a slight coverage increase over the time, which is the sign of increasing effort invested in testing, since the number of production classes also increased in that period of time. There is a small period with no successful coverage measurements, and with a huge decrease in method level coverage, but the developers of tests managed to balance it out in a short period of time.
The coverage measurements were done using the Clover tool. The test traces were processed using the SoDA toolchain [16], which handles the per test coverage matrix and is also able to handle test results and compute test suite metrics. Test coverage is used as the test-to-code traceability [6], [17] solution in our study.
C. Fine grained changes
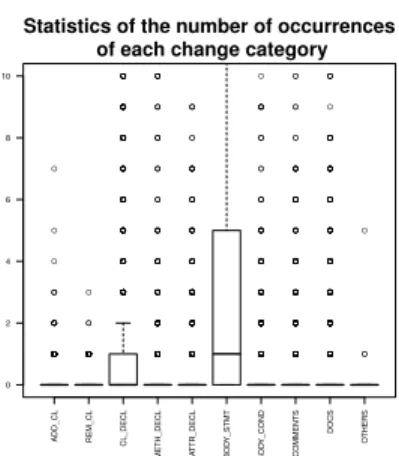
We obtained fine grained changes using the ChangeDis- tiller [18] through a wrapper tool. According to the ChangeDistiller model, detailed changes belong to 10 change categories. When processing changes we distinguish produc- tion and test classes; both of them can contain any number of detailed changes. Change categories are listed in Table III divided into production and test class changes.
TABLE III
TOTAL NUMBER OF CHANGES IN PRODUCTION AND TEST CODE PER CHANGEDISTILLER CATEGORY
ChangeDistiller category commons-lang Prod Test
ADDED_CLASS 198 257
REMOVED_CLASS 133 153
CLASS_DECLARATION 1153 1631 METHOD_DECLARATION 644 236 ATTRIBUTE_DECLARATION 504 321 BODY_STATEMENTS 6845 9425
BODY_CONDITIONS 934 68
COMMENTS 368 349
DOCUMENTATION 1247 225
OTHERS 7 0
Total 12033 12665
Test ratio 0.512795
The distribution of changes both between categories and between the two types of classes are similar to the data found by Marsavina et al. Not surprisingly, changes in body statements happen most frequently. Important to note is that slightly more than half of the fine grained changes happened in test classes in this project. Although the measured interval in the project history is different, the finding of the base study holds in our analysis as well.
In Figure 4 the ratio of changed production and test classes is shown for the whole analyzed history. In the number of
classes the high intensity of test changes can also be observed, which means that developers in this project take care of tests.
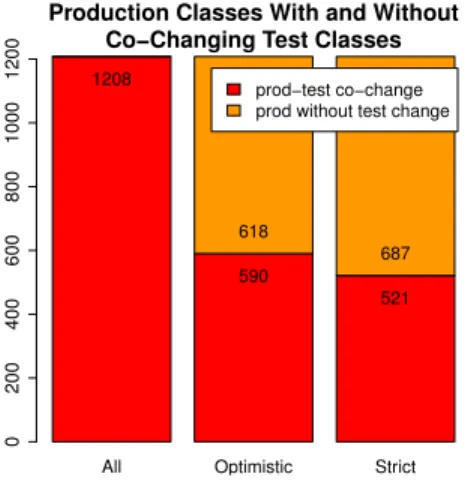
As already mentioned, the direction of the analysis is from production classes to test classes (test-driven projects need changes in this process). For each production class we checked if there are any test classes that were changed in the same commit. As Figure 5 shows in the second and third bars, more than half of the production classes are changed without co-changed test classes. These cases unfortunately hinder the analysis of co-evolution patterns. Although we found many small changes in the project history (as seen in Table III), there are many cases when the developers do not (immediately) initiate changes both in production and test code.
All.cls Prod.cls Test.cls
Number of changed classes (instances)
05001000150020002500 2545
1208
1337
Fig. 4. Distribution of changed Java classes
All Optimistic Strict
Production Classes With and Without Co−Changing Test Classes
020040060080010001200 1208
590
521 618
687 prod−test co−change prod without test change
Fig. 5. Number of co-changes from the production classes perspective
III. MININGCO-EVOLUTIONPATTERNS
The aim of the mining process is to obtain association rules between production and test classes. Association rule learning is a well-known data mining method for discovering regularities in large-scale transaction databases. This learning method has been successfully applied for software engineering problems as well [19], [9]. In our case, fine grained changes are considered as transaction items, while commit level project
TABLE IV
ASSOCIATION RULES MINED FROM EVOLUTION DATA
Rule Production side Test side Commons-Lang
Id Rule LHS Rule RHS W1 W1’ W2 Marsavinaet al.
1 ADDED_CLASS_P=YES =⇒ ADDED_CLASS_T YES
0.51 / 0.51 SOMETHING
/ YES
0.51 / 0.51 YES 412 / 0.643
2 REMOVED_CLASS_P=YES =⇒ REMOVED_CLASS_T YES
0.56 / 0.56 SOMETHING
/ YES
0.56 / 0.56 YES 569 / 0.998 3a1 CLASS_DECLARATION_P=LOW =⇒ CLASS_DECLARATION_T NONE
0.50 / 0.50 SOMETHING
/ SOMETHING
/ NONE
244 / 0.953 3a2 CLASS_DECLARATION_P=MED_LOW =⇒ CLASS_DECLARATION_T NONE
0.54 / 0.54 SOMETHING
/ SOMETHING
/ LOW
132/ 0.8 3a3 CLASS_DECLARATION_P=MED_HIGH =⇒ CLASS_DECLARATION_T NONE
0.55 / 0.55 SOMETHING
/ SOMETHING
/ SOMETHING / 3a4 CLASS_DECLARATION_P=HIGH =⇒ CLASS_DECLARATION_T HIGH
0.64 / 0.64 HIGH
0.64 / 0.64 HIGH
0.55 / 0.55 HIGH 85 / 0.658 4a1 METHOD_DECLARATION_P=LOW =⇒ BODY_STATEMENTS_T NONE
0.55 / 0.55 SOMETHING
/ NONE
0.65 / 0.65 SOMETHING / 4a2 METHOD_DECLARATION_P=MED_LOW =⇒ BODY_STATEMENTS_T NONE
0.53 / 0.53 SOMETHING
/ SOMETHING
/ SOMETHING / 4a3 METHOD_DECLARATION_P=MED_HIGH =⇒ BODY_STATEMENTS_T NONE
0.67 / 0.67 NONE
0.67 / 0.67 NONE
0.75 / 0.75 SOMETHING / 4a4 METHOD_DECLARATION_P=HIGH =⇒ BODY_STATEMENTS_T NONE
0.68 / 0.68 NONE
0.68 / 0.68 NONE
0.56 / 0.56 MED_HIGH 37 / 0.616 5a1 ATTRIBUTE_DECLARATION_P=LOW =⇒ BODY_STATEMENTS_T NONE
0.63 / 0.63 NONE
0.63 / 0.63 NONE
0.90 / 0.90 SOMETHING / 5a2 ATTRIBUTE_DECLARATION_P=MED_LOW =⇒ BODY_STATEMENTS_T NONE
0.95 / 0.95 NONE
0.95 / 0.95 SOMETHING
/ SOMETHING / 5a3 ATTRIBUTE_DECLARATION_P=MED_HIGH =⇒ BODY_STATEMENTS_T NONE
1.00 / 1.00 NONE
1.00 / 1.00 NONE
0.70 / 0.70 SOMETHING / 5a4 ATTRIBUTE_DECLARATION_P=HIGH =⇒ BODY_STATEMENTS_T NONE
0.98 / 0.98 NONE
0.98 / 0.98 NONE
0.63 / 0.63 SOMETHING / 6a1 BODY_CONDITIONS_P=LOW =⇒ CLASS_DECLARATION_T NONE
0.71 / 0.71 NONE
0.71 / 0.71 NONE
0.80 / 0.80 NONE 126/ 0.670 6a2 BODY_CONDITIONS_P=MED_LOW =⇒ CLASS_DECLARATION_T NONE
0.82 / 0.82 NONE
0.82 / 0.82 NONE
0.70 / 0.70 SOMETHING / 6a3 BODY_CONDITIONS_P=MED_HIGH =⇒ CLASS_DECLARATION_T NONE
0.86 / 0.86 NONE
0.86 / 0.86 NONE
0.76 / 0.76 SOMETHING / 6a4 BODY_CONDITIONS_P=HIGH =⇒ CLASS_DECLARATION_T NONE
0.84 / 0.84 NONE
0.84 / 0.84 NONE
0.73 / 0.73 SOMETHING /
history provides the transaction database. An example associ- ation rule is shown in Figure 6. This rule means that when a new production class is added to the code, then a new test class is also added in slightly more than half of the cases in project history. Since our question is whether changes in production code induce changes in test code, we work with rules where the first part is about production code changes and the implication is about test code changes.
ADDED_CLASS_PROD = YES =⇒ ADDED_CLASS_TEST = YES (support=0.51)
Fig. 6. Association rule for added classes
The next step in the co-evolution mining process is to use the fine-grained change data to produce input for the asso- ciation rule mining algorithm. For this purpose, changes are summarized by change category for each changed production class for each commit. Co-evolution rules are mined when there were test class changes as well within the same commit.
To consider a changed test class it has to cover the given production class of the same commit, which is checked using the dynamic coverage matrix obtained using the Clover tool.
Thus we produce changed production class to changed test class links, where change categories are computed for both types of classes. When there are more than one changed test classes that cover the production class, the test class changes are summarized by change type.
Association rule mining is used to mine patterns in such linked classes. This algorithm does not work on numeric results, so we need to discretize the number of changes for each change category. We compute the quartiles for the whole project history for each change type (both production and test classes are considered). For each class we use theNONE,
ADDED_CLASS_P = NO;
REMOVED_CLASS_P = NO;
CLASS_DECLARATION_P = HIGH;
METHOD_DECLARATION_P = NONE;
ATTRIBUTE_DECL_P = NONE;
BODY_STATEMENTS_P = HIGH;
BODY_CONDITIONS_P = MID_LOW;
ADDED_CLASS_T = NO;
REMOVED_CLASS_T = NO;
CLASS_DECLARATION_T = NONE;
METHOD_DECLARATION_T = NONE;
ATTRIBUTE_DECL_T = NONE;
BODY_STATEMENTS_T = NONE;
BODY_CONDITIONS_T = NONE;
Fig. 7. Co-change transaction example for association rule mining
LOW,MED_LOW,MED_HIGHandHIGHcategories for0,Q1, Q2, Q3 and Q4 values respectively. In binary cases we use only NO and YES categories. After this step we produce the change vectors for each changed production class for each commit as shown in Figure 7. The vector consists of 7+7 elements, one element for each of the 7 main change categories for production (_P) and test (_P) classes. These vectors correspond to transactions in association rule mining terminology. Rules are mined using the apriori algorithm of thearulespackage of theRrepository. To find patterns we set the support threshold to 0.5.
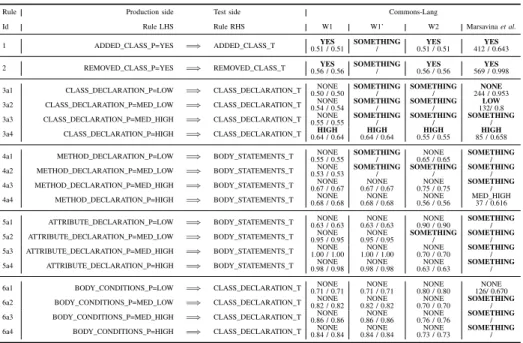
The results of co-evolution analysis are summarized in Table IV. We reused the 6 types of rules from [8]. The left hand side of each association rule reflects changes in production code, while the right hand side shows whether linked test code changes exist in the project history. For each rule, the whole set of transactions is filtered for the given assumption of the production code. For example Rule 3a1 checks whetherLOWchanges in production class declarations implies changes of test class declarations at 0.5 support level.
The nature of the test change is given on the right hand side of the table. When none of the change categories reaches the desired support level, but still there is some link between production and test changes,SOMETHINGis used (otherwise NONEwould be the result).