EXAMINATION OF THE ROLE OF MYCOPLASMA BOVIS IN BOVINE PNEUMONIA AND A MATHEMATICAL MODEL
FOR ITS EVALUATION
M. TENK1, L. STIPKOVITS2* and L. HUFNAGEL3
1Central Veterinary Institute, H-1149 Budapest, Tábornok u. 2, Hungary; 2Veterinary Medical Research Institute, Hungarian Academy of Sciences, Budapest, Hungary;
3Department of Mathematics and Informatics, Szent István University, Budapest, Hungary (Received July 29, 2003; accepted March 24, 2004)
The authors screened 34 large cattle herds for the presence of Mycoplasma bovis infection by examining slaughtered cattle for macroscopic lung lesions, by culturing M. bovis from lung lesions and at the same time by testing sera for the presence of antibodies against M. bovis. Among the 595 cattle examined, 33.9%
had pneumonic lesions, mycoplasmas were isolated from 59.9% of pneumonic lung samples, and 10.9% of sera from those animals contained antibodies to M.
bovis. In 25.2% of the cases M. bovis was isolated from lungs with no macro- scopic lesions. The proportion of seropositive herds was 64.7%. The average se- ropositivity rate of individuals was 11.3% but in certain herds it exceeded 50%. A probability model was developed for examining the relationship among the occur- rence of pneumonia, the isolation of M. bovis from the lungs and the presence of M. bovis specific antibodies in sera.
Key words: Mycoplasma bovis infection, ELISA, culture, pneumonia
Mycoplasma bovis is widely spread and causes major economic losses in cattle herds in Europe and North America (Boothby et al., 1983; Rebhun, 1995;
Burnens et al., 1999). This organism can cause mastitis in cows, respiratory dis- ease and polyarthritis in calves and reproductive problems in both cows and bulls (Pfützner and Sachse, 1996). It was isolated from other alterations such as sub- cutaneous abscesses, otitis and meningitis (Kinde et al., 1993; Stipkovits et al., 1993; Walz et al., 1997). M. bovis infection can be diagnosed by a variety of methods including isolation of the agent, immunohistochemical staining, use of a specific PCR probe in lung samples and detection of specific antibodies in the serum (Boothby et al., 1981; Brys et al., 1992; Sachse et al., 1993; Uhaa et al., 1990a, b,c; Le Grand et al., 2002). Awareness of the serological status of the
*Corresponding author: Dr. László Stipkovits, Veterinary Medical Research Institute, Hungarian Academy of Sciences, H-1581 Budapest, P.O. Box 18, Hungary; E-mail:
stipkovits@novell.vmri.hu; Fax: +36 (1) 467 4067
herd is important for preventing economic losses by control measures (Brys et al., 1992; Pfützner and Sachse, 1996).
The aim of this study was to examine the occurrence of pneumonia, the isolation of M. bovis from the lungs and the presence of its specific antibodies in sera of cattle originating from different farms of Hungary and to study the rela- tionship among them.
Materials and methods
Sample collection and handling
Blood and lung samples were collected from 595 cattle originating from 34 large dairy herds with approximately 300 animals per herd. Sample collection was done at random. Most of the animals were adult cows. The carcasses were subjected to normal meat inspection and any pathological changes of the respi- ratory tract were recorded. From the clotted blood samples sera were separated from the blood cells by centrifugation at 500 g for 5 min and stored at –20°C until used. Tissue samples were collected from the altered parts of the lungs. The lung samples were transported to the laboratory at 4°C and cultured within 4 h.
ELISA testing
Sera were examined with CHECKIT Mycoplasma Bovis Sero ELISA kit (Bommeli AG, Liebefeld-Bern, Switzerland). The test was carried out according to the instruction manual.
Serum samples as well as positive and negative control sera were diluted 1:100 with CHECKIT diluting solution. Two hundred µl of the diluted sera were distributed into the wells of sensitised plates and incubated at room temperature for 90 min. After the incubation period the plates were washed 3 times with CHECKIT washing solution. Two hundred µl of the included peroxidase- labelled anti-ruminant IgG conjugate was added to the wells in a dilution of 1:600 and incubated as described above. After washing off the excessive conju- gate the reaction was visualised with 200 µl of CHECKIT chromogen solution.
The reaction was stopped after 15 min with 50 µl of CHECKIT stop solution. The absorbance values were read at 405 nm with a Titertek Multiscan MS plate reader.
The OD% value was calculated from the measured OD values of the sam- ples and the negative and positive sera as follows:
[(ODsample – ODnegative serum) / (ODpositive serum – ODnegative serum)] × 100 = OD%
According to the description of the original kit the animals having OD%
values between 60 and 80% are suspicious of M. bovis infection and a value above 80% is a clear sign of infection. Since our aim was to detect any trace of M. bovis antibodies, OD% values above 60% were regarded as positive.
Mycoplasma culturing
Lung samples were cultured in liquid Medium ‘B’ (Ernø and Stipkovits, 1973a,b) according to the method described by ter Laak et al. (1992c). The in- oculated tubes were incubated at 37°C and plated on days 3 and 7. The plates were incubated at 37°C in 5% CO2 atmosphere and were examined under a ste- reomicroscope every 2 days. Mycoplasmas were identified by their colony mor- phology, biochemical characteristics and immunofluorescence as described by Bradbury (1998).
Statistical evaluation of data
The animals examined were divided into five groups based on the ranges of OD% values (< 20, 20–40, 40–60, 60–80 and 80% <) of their sera. Based on the data of presence or absence of pneumonia (P) and the M. bovis culture (C) the animals were divided into four groups (P+C+, P+C–, P–C+ and P–C–). A total of 20 groups were formed on this basis. Inside the groups formed on the ba- sis of pneumonia and M. bovis culture the average, empirical and relative devia- tions of OD% values were calculated. The values of empirical deviation by all pairs of groups were compared by F-test and the averages were compared by Student’s t-test in all possible combinations.
Within the four groups mentioned above the relative frequencies of ani- mals in each OD% range were calculated. The frequency distributions in all cases were checked by chi-squared tests.
The rates of pneumonic animals were also examined in all OD% ranges.
Application of the probability model
Probability modelling was used to examine the association among pneu- monia and the results of M. bovis culture and serology. The approach of model- ling resembles the ones described by Fahim et al. (2003), Fodor and Kovács (2003), Ladányi et al. (2003) and Máthé-Gáspár and Kovács (2003). During the interpretation of data methods of Tamás (2003) were followed. We used a method based on optimisation with the solver algorithm of Microsoft Excel for fitting the model (i.e. solving the described system of equations).
Results
Observed data
Out of the 595 animals, 202 (33.9%) had pneumonic lesions, 220 (37.0%) were positive by M. bovis culture, and serum samples of 67 cattle (11.3%) were positive for M. bovis antibodies (Table 1). The overall proportion of seropositive
animals was 11.3%, which varied between 0 and 57.2% in various herds. The percentage of seropositive herds was 64.7% (22 out of 34).
Table 1
Distribution of the animals according to examined parameters (ELISA, pneumonia and culture; observed and predicted values) ELISA/Culture/Pneumonia Observed Predicted by model
+/+/+ 18 17.81
+/–/+ 4 4.04
+/+/– 21 20.96
+/–/– 24 24.27
–/+/+ 103 103.05
–/–/+ 77 77.4
–/+/– 78 78.28
–/–/– 270 270.55
Number of positive animals
ELISA 67 67.11
Culture 220 220.13
Pneumonia 202 202.16
Statistical evaluation
The relative frequencies of animals divided into 20 groups based on the ranges of OD% values and the results of observed pathological lung changes and M. bovis culture are shown in Table 2. It can be seen that the relative fre- quencies of animals (54.73; 49.75 and 47.58) are the highest in the 0–20, 20–
40 and 40–60 OD% ranges in the group where there is no pneumonia and the mycoplasma culture is negative. These OD% values are not signs of M. bovis infection. At the same time, in the 60–80 OD% range and above the 80 OD%
range – which point to M. bovis infection – the relative frequencies of animals were higher in those groups where the result of mycoplasma culture was posi- tive (P–C+ and P+C+), as compared to the groups where the isolation was negative.
The average of the OD% values was the lowest where there was no pneu- monia and M. bovis culture was also negative, whereas in the other groups the average value was higher (Table 3). None of the group pairs (e.g. P+C+ and P+C–, etc.) had equal empirical deviations of OD% values (p = 95%) by the F- test, and the examination of the averages of OD% values of all groups led to similar results by Student’s t-test.
Table 2
Relative frequencies (%) of individuals in certain case groups within the OD% ranges
OD% P+C+ P+C– P–C+ P–C– Total
0–20 21.39 9.45 14.43 54.73 100
20–40 17.73 16.75 15.76 49.75 100
40–60 19.35 19.35 13.71 47.58 100
60–80 20.00 5.00 30.00 45.00 100
80– 37.04 7.41 33.33 22.22 100
P = pneumonia; C = mycoplasma culture; + = presence; – = absence Table 3
Base statistical values of OD% in groups of animals
P+C+ P+C– P–C+ P–C–
Average 33 33 40 29
Empirical deviation 26 20 29 21
Relative deviation 1.27 1.62 1.38 1.40
P = pneumonia; C = mycoplasma culture; + = presence; – = absence
The empirical deviations in group pairs P+C– and P+C+, P–C– and P+C+, P–C+ and P+C–, as well as P–C– and P–C+ were significantly different (F val- ues < 5%), in P–C+ and P+C+ they were non-significantly different (F value:
33%), while in group pairs P–C– and P+C– they were non-significantly equal (F value: 69%).
As regards the group averages, only the P–C– and P–C+ pairs showed a significant difference by Student’s t-test. The P+C– and P+C+ pair showed non- significant equality (t value: 90%), whereas the other pairs exhibited non- significant difference (t values between 5 and 50%) at this level of probability.
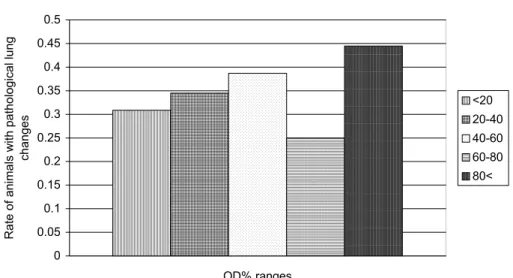
The rate of pneumonic animals in the different OD% ranges can be seen in Fig. 1. In the ‘negative’ OD% ranges (< 60%) this rate is between 0.3 and 0.4, while in the ‘positive’ range between 60 and 80 OD% this rate is only 0.25 but in the range above 80% it is 0.44. The explanation of this apparent discrepancy will be given later (hypothesis and modelling). For a deeper analysis of this phe- nomenon we examined the relative frequencies of individuals in OD% ranges by groups based on pathological lung changes and M. bovis culture (Fig. 2). None of the frequency distributions of the different group pairs were found to be equal by chi-squared test (p = 95%).
0 0.05 0.1 0.15 0.2 0.25 0.3 0.35 0.4 0.45 0.5
OD% ranges Rate of animals with pathological lung changes
<20 20-40 40-60 60-80 80<
Fig. 1. The proportion of animals with pneumonia within the different OD% ranges
0.00 5.00 10.00 15.00 20.00 25.00 30.00 35.00 40.00 45.00
P+ C+ P+ C- P- C+ P- C-
Relative frequencies of individuals in ranges by groups (%)
0-20 20-40 40-60 60-80 80-
Fig. 2. Relative frequencies (%) of individuals in the different OD% ranges by groups based on pathological lung changes and mycoplasma culture. P = pneumonia, C = mycoplasma culture,
+ = presence, – = absence
Hypothesis
As can be seen in Table 1, we found animals that were positive for all of the three parameters (pneumonia, culturing of M. bovis and ELISA test), but there were other cases in high numbers where there was no pneumonia and the animals were negative by ELISA but positive by culture. In other cases the
ELISA test was positive and in spite of this mycoplasma culture led to negative results. Sometimes both parameters were positive. These data obviously need further explanation.
For one of the possible interpretations of the relationship among pneumo- nia, M. bovis culture and the results of M. bovis serology using modelling, we set the following hypotheses for testing:
(1) According to our hypothesis, in the background of the observed distri- bution of the examined parameters (pneumonia, culture and ELISA) the follow- ing causes were involved:
Group α: M. bovis generating antibodies, which can be detected by the M.
bovis specific ELISA test used and can be detected by culturing.
Group β: M. bovis, which cannot be detected by a specific ELISA test.
Group γ: Other pathogenic bacteria (e.g. Pasteurella multocida or Hae- mophilus somnus) or viruses (e.g. bovine adenoviruses, parainfluenza-3) causing pneumonia, which cannot be detected by M. bovis specific ELISA or by myco- plasma culturing methods.
Antibodies against microorganisms in Group α can be detected by the spe- cific M. bovis ELISA test, whereas Group β and Group γ are not detectable in this way.
Group α and Group β can be detected by M. bovis culture if they are pres- ent in a detectable amount – above the threshold of sampling and examination – whereas Group γ cannot.
Group α, Group β and Group γ can be involved in pneumonia if they are present above the threshold of pathogenicity.
(2) The frequencies of distribution of the above-mentioned microbe groups in the examined population are marked with the letters ‘a’, ‘b’, ‘c’, ‘d’,
‘e’ and ‘f’ in Table 4. The signs 0, I, II and III are quantitative categories mean- ing: 0 < I < II < III.
The quantity I of Group α is marked with ‘a’, which means ELISA- positive cases. The quantity II of Group α is marked with ‘b’, which means ELISA- and culture-positive cases. The quantity III of Group α is marked with
‘c’, which contains ELISA-, culture- and pneumonia-positive cases. If Group α is not there or if it is below the threshold of detection then this rate is ‘1 – (a + b + c)’ because there is no other possibility. Since Group β cannot be detected by ELISA test, so here the 0 and I quantitative categories cannot be present. The category II of Group β is marked with ‘d’, while category III with ‘e’. Conse- quently, the summarised frequencies of Group β 0 and I are ‘1 – (d + e)’. Since Group γ cannot be detected by any of the above-mentioned mycoplasma-specific methods, the only sign of their presence is the pneumonia. Category III of Group γ is marked with ‘f’, below this with ‘1–f’.
Microorganisms of Groups α, β and γ in category III are capable of caus- ing pneumonia per se.
Microorganisms of Groups α and β in category II are present in a quantity in which they can be detected by M. bovis culture but they do not trigger pneu- monia alone.
In category I Group α can be detected by specific ELISA test but not by M. bovis culture. It does not cause pneumonia alone.
In category 0 none of these groups can be detected by the above- mentioned methods, so they were not present according to our approach.
(3) Letters ‘a’, ‘b’, ‘c’, ‘d’, ‘e’ and ‘f’ within the groups mean the rate of animals (between 0 and 1) in each category. The sum of them in each row is 1, so they form a complete event in each group.
(4) As can be seen in Fig. 1, in the ranges above 60 OD% (which are con- sidered positive) the rate of pneumonic animals in the relatively lower and higher OD% ranges shows significant differences (60–80%: 0.25; above 80%: 0.44). To explain this anomaly, we introduced the following supplementary conditions:
Group α below the quantity of I has a weak nonspecific effect, which can weaken the effect of other pathogens causing pneumonia. Since if the presence of M. bovis in low quantity (Group α I) alone did not cause pneumonia, then in this range the rate of pneumonic animals would be similar to that in the 40–60 and lower OD% ranges. On the contrary, the rate of pneumonic animals is much lower (instead of 0.3–0.4 it is only 0.25). A similar phenomenon is well known from the literature (Tschernig et al., 2002). If this effect does not exist, then an equal phenomenon can be observed if the detection of M. bovis by ELISA fails or is hindered in animals infected by other pathogens. We did not make a dis- tinction between these two phenomena during the testing of our hypothesis. This effect is marked with ‘i’ (scalar value between 0 and 1).
Group α above the quantity of II has a stronger pathogenic effect, which can make the animals more susceptible to other microbes (Bennett and Jasper, 1977). This effect is marked with ‘g’ (also a scalar value between 0 and 1). The possible opposite case can cause an equal phenomenon: i.e. in animals infected and diseased by other pathogens the spread and multiplication of M. bovis in- crease or its detection by ELISA test improves for other reasons.
Description of the model
We created a probability model for the mathematical description of the hypothesis, which is represented by the following equations:
p(E+C+P+) = a(df+e)(1–i) + b(e+(1–e) (f(1–i) + (1–f)g)) + c [Eq. 1.]
p(E+C+P–) = ad(1–f) + b(1–e)(1–f)(1–g) + a(df+e)i + b(e+(1–e)f)i [Eq. 2.]
p(E+C–P+) = a(1–(d+e))f(1–i) [Eq. 3.]
p(E+C–P–) = a(1–(d+e))(((1–f) + fi) [Eq. 4.]
p(E–C+P+) = (1–(a+b+c))(df+e) [Eq. 5.]
p(E–C+P–) = (1–(a+b+c))(d(1–f)) [Eq. 6.]
p(E–C–P+) = (1–(a+b+c))(1–(d+e))f [Eq. 7.]
p(E–C–P–) = (1–(a+b+c))(1–(d+e))(1–f) [Eq. 8.]
The number of animals within the observed category is n×p, where n is the total number of the examined animals. The meaning of signs representing the rates of animals within each category and the fitted values are presented in Table 4.
Table 4
Supposed frequency of distribution of microbe groups α, β and γ in the examined population (parameters of the model)
Quantitative categories of microbe levels Microbe groups
0 I II III
Group γ 1 – f
(77.79%)
f (22.21%)
Group β 1 – (d + e)
(65.73%) d
(19.2%) e
(15.25%) Group α 1 – (a + b + c)
(88.9%)
a (7.24%)
b (3.83%)
c (0%) Parameters of interaction: i = 0.3573; g = 0.4128; i = weak positive (or alternative) effect of Group α in I; g = negative (or alternative) effect of Group α in II
The numerical values of the table are the fitting parameters as results of fitting the model. Essentially, the linear system of eight-degree equations with eight unknowns was solved, which resulted in these values.
The formation of these equations was done by summarising the elemental events, which can cause the observed phenomenon. The values in the equations represent values of frequency, so multiplication represents ‘and’ logical opera- tion which means that both conditions should be fulfilled between the parts of the expression, while addition means ‘or’ logical operation where either one or the other condition can be fulfilled.
Based on the data of Table 1 it can be seen that the model can be fitted to the observed data, so the system of hypotheses is suitable for the explanation of the observed numerical relationships.
Discussion
Several pathogens can cause respiratory disease in cattle. Mycoplasma bovis infection can cause severe lung changes, too (Boothby et al., 1983; Bashiruddin et al., 2001), which can severely affect herd productivity.
Our data call attention to the fact that pneumonia resulting from M. bovis infection occurs frequently in adult cattle as well. These results are in accordance with data obtained in the Netherlands, Switzerland, Northern Ireland and France (ter Laak et al., 1992a, b; Burnens et al., 1999; Brice et al., 2000; Le Grand et al., 2002), taking into consideration that pneumonia seems to be more frequent in domestic herds (33.9%). At the same time, M. bovis can more frequently be iso- lated from pneumonic lungs in Hungarian herds (59.9%) than in herds in the Netherlands (20%) or Ireland (13–23%; Byrne et al., 2001). These data confirm the role of M. bovis infection in triggering pneumonia. In 39.1% of the cases the lung alterations could not be associated with mycoplasma infection, showing that other pathogens and further factors also contribute to the development of pneumo- nia in adult cattle at high rates.
Mycoplasmas could frequently be isolated from lung samples (25.2%) without macroscopic lung lesions. It can be supposed that in these cases the in- fection and thus mycoplasma colonisation were at an early stage at the time of isolation. In 9.2% of the cases antibodies to M. bovis were detectable in animals without pneumonia. This indicates that M. bovis can be involved in pathological processes other than pneumonia, e.g. mastitis, metritis or other rare diseases (Uhaa et al., 1990b, c).
According to some authors (Boothby et al., 1981; Boothby et al., 1983;
Burnens et al., 1999) ELISA testing of blood samples is a useful method for di- agnosing M. bovis infection. We have come to the same conclusion, too.
Although the average seropositivity rate of individuals was relatively low, in certain herds it was rather high. The rate of seropositive herds was also high.
Nicholas et al. (2001) obtained similar results during a monitoring study in Eng- land, where 20–25% of cattle herds affected with pneumonia contained animals seropositive to M. bovis, while only in a few herds were there animals with high antibody titres against respiratory viruses.
Mycoplasma bovis increases the chances of development of pneumonia in ani- mals with an OD% value higher than 80%, helping other agents exert their pathogenic effect.
Our model can be used for the quantitative interpretation of the associa- tions among pneumonia and the ability to detect M. bovis by isolation and its an- tibodies by ELISA. The application of this model has proved that our hypothesis is suitable for explaining the effect of M. bovis in inducing pneumonia and its in- fluence on the effect of other pathogens.
Our data suggest that the culture of M. bovis and the detection of its anti- bodies by ELISA are equally important methods complementary to each other in the diagnosis of M. bovis infection.
References
Bashiruddin, J. B., De Santis, P., Varga, E. and Stipkovits, L. (2001): Confirmation of the presence of Mycoplasma bovis in Hungarian cattle with pneumonia resembling pleuropneumonia.
Vet. Rec. 148, 743–746.
Bennett, R. H. and Jasper, D. E. (1977): Immunosuppression of humoral and cell-mediated re- sponses in calves associated with inoculation of Mycoplasma bovis. Am. J. Vet. Res. 38, 1731–1738.
Boothby, J. T., Jasper, D. E., Rollins, M. H. and Thomas, C. B. (1981): Detection of Mycoplasma bovis specific IgG in bovine serum by enzyme-linked immunosorbent assay. Am. J. Vet.
Res. 42, 1242–1247.
Boothby, J. T., Jasper, D. E., Zinkl, J. G., Thomas, C. B. and Dellinger, J. D. (1983): Prevalence of mycoplasmas and immune responses to Mycoplasma bovis in feedlot calves. Am. J. Vet.
Res. 44, 831–838.
Bradbury, J. M. (1998): Identification of mycoplasmas by immunofluorescence. In: Miles, R. and Nicholas, R. (eds) Methods in Molecular Biology (Vol. 104) Mycoplasma Protocols. Hu- mana Press, Totowa, New Jersey, USA. pp. 119–125.
Brice, N., Finlay, D., Bryson, D. G., Henderson, J., McConnell, W. and Ball, H. J. (2000): Isolation of Mycoplasma bovis from cattle in Northern Ireland 1993–1998. Vet. Rec. 146, 643–644.
Brys, A., Pfützner, H., Bocklisch, H. and Weigel, H. (1992): Mycoplasma bovis-free breeding of cattle. Berl. Münch. Tierärztl. Wschr. 105, 230–232.
Burnens, A. P., Bonnemain, P., Bruderer, U., Schalch, L., Audige, L., Le Grand, D., Poumarat, F.
and Nicolet, J. (1999): The seroprevalence of Mycoplasma bovis in lactating cows in Swit- zerland, particularly in the republic and canton of Jura. Schweiz. Arch. Tierheilkd. 141, 455–460.
Byrne, W. J., McCormack, R., Brice, N., Markey, B. and Ball, H. J. (2001): Isolation of Mycoplasma bovis from bovine clinical samples in the Republic of Ireland. Vet. Rec. 148, 331–333.
Ernø, H. and Stipkovits, L. (1973a): Bovine mycoplasmas: cultural and biochemical studies. I.
Acta Vet. Scand. 14, 436–449.
Ernø, H. and Stipkovits, L. (1973b): Bovine mycoplasmas: cultural and biochemical studies. II.
Acta Vet. Scand. 14, 450–463.
Fahim, M. A., Hassainen, M. K. and Mostafa, M. H. (2003): Relationships between climatic con- ditions and Potato Late Blight epidemic in Egypt during winter seasons 1999–2001. Appl.
Ecol. Env. Res. (AEER) 1, 159–172.
Fodor, N. and Kovács, G. J. (2003): Sensitivity of 4M maize model to the inaccuracy of weather and soil input data. Appl. Ecol. Env. Res. (AEER) 1, 75–85.
Kinde, H., Daft, B. M., Walker, R. L., Chariton, B. R. and Petty, R. (1993): Mycoplasma bovis as- sociated with decubital abscesses in Holstein calves. J. Vet. Diagn. Invest. 5, 194–197.
ter Laak, E. A., Noordegraaf, J. H. and Boomsluiter, E. (1992a): The nasal mycoplasmal flora of healthy calves and cows. J. Vet. Med. B 39, 610–616.
ter Laak, E. A., Noordegraaf, J. H. and Dieltjes, R. P. J. W. (1992b): Prevalence of mycoplasmas in the respiratory tracts of pneumonic calves. J. Vet. Med. B 39, 553–562.
ter Laak, E. A., Wentink, G. H. and Zimmer, G. M. (1992c): Increased prevalence of Mycoplasma bovis in the Netherlands. Vet. Quart. 14, 100–104.
Ladányi, M., Horváth, L., Gaál, M. and Hufnagel, L. (2003): An agro-ecological simulation model system. Appl. Ecol. Env. Res. (AEER) 1, 47–74.
Le Grand, D., Calavas, D., Brank, M., Citti, C., Rosengarten, R., Bézille, P. and Poumarat, F.
(2002): Serological prevalence of Mycoplasma bovis infection in suckling beef cattle in France. Vet. Rec. 150, 268–273.
Máthé-Gáspár, G. and Kovács, G. J. (2003): Use of simulation technique to distinguish between the effect of soil and weather on crop development and growth. Appl. Ecol. Env. Res.
(AEER) 1, 87–92.
Nicholas, R. A. J., Wood, E., Baker, S. and Ayling, R. D. (2001): Mycoplasmas isolated from ru- minants in Britain 1995–2000. In: Poveda, J. B., Fernandez, A., Frey, J. and Johansson, K.
E. (eds) Mycoplasmas of Ruminants: Pathogenicity, Diagnostics, Epidemiology and Mo- lecular Genetics. Vol. 5. European Commission, Brussels. pp. 116–120.
Pfützner, H. and Sachse, K. (1996): Mycoplasma bovis as an agent of mastitis, pneumonia, arthritis and genital disorders in cattle. Rev. Sci. Tech. 15, 1477–1494.
Rebhun, W. C. (1995): Respiratory diseases. In: Diseases of Dairy Cattle. Lipincott Williams and Wilkins, Baltimore. pp. 79–80.
Sachse, K., Pfützner, H., Hotzel, H., Demuth, B., Heller, M. and Berthold, E. (1993): Comparison of various diagnostic methods for the detection of Mycoplasma bovis. Rev. Sci. Tech. 12, 571–580.
Stipkovits, L., Rády, M. and Glávits, R. (1993): Mycoplasmal arthritis and meningitis in calves.
Acta Vet. Hung. 41, 70–89.
Tamás, J. (2003): Problems and solutions of field scale agro-ecological data acquisition and data in- terpretations in agroinformatical domain. Appl. Ecol. Env. Res. (AEER) 1, 143–157.
Tschernig, T., Lührmann, A. and Pabst, R. (2002): Recruitment of lymphocytes and dendritic cells from the blood to the bronchoalveolar space and the draining lymph nodes after a single intrabronchial application of the lipopeptide MALP-2T. Pathobiology 70, 256–261.
Uhaa, I. J., Riemann, H. P., Thurmond, M. C. and Franti, C. E. (1990a): The use of the enzyme linked immunosorbent assay (ELISA) in serological diagnosis of Mycoplasma bovis in dairy cattle. Vet. Res. Commun. 14, 279–285.
Uhaa, I. J., Riemann, H. P., Thurmond, M. C. and Franti, C. E. (1990b): A cross-sectional study of bluetongue virus and Mycoplasma bovis infections in dairy cattle: I. The association be- tween a positive antibody response and production efficiency. Vet. Res. Commun. 14, 461–470.
Uhaa, I. J., Riemann, H. P., Thurmond, M. C. and Franti, C. E. (1990c): A cross-sectional study of bluetongue virus and Mycoplasma bovis infections in dairy cattle: II. The association be- tween a positive antibody response and reproduction performance. Vet. Res. Commun. 14, 471–480.
Walz, P. H., Mullaney, T. P., Render, J. A., Walker, R. D., Mosser, T. and Baker, J. C. (1997):
Otitis media in preweaned Holstein dairy calves in Michigan due to Mycoplasma bovis. J.
Vet. Diagn. Invest. 9, 250–254.