Genome analysis
TPMCalculator: one-step software to quantify mRNA abundance of genomic features
Roberto Vera Alvarez
1,*, Lorinc Sandor Pongor
1,2, Leonardo Mari no-Ramı´rez ~
1and David Landsman
11
Computational Biology Branch, National Center for Biotechnology Information, National Library of Medicine, National Institutes of Health, Bethesda, MD 20892, USA and
22nd Department of Pediatrics, Semmelweis University, Budapest 1094, Hungary
*To whom correspondence should be addressed.
Associate Editor: Bonnie Berger
Received on March 13, 2018; revised on October 2, 2018; editorial decision on October 22, 2018; accepted on October 30, 2018
Abstract
Summary:
The quantification of RNA sequencing (RNA-seq) abundance using a normalization method that calculates transcripts per million (TPM) is a key step to compare multiple samples from different experiments. TPMCalculator is a one-step software to process RNA-seq alignments in BAM format and reports TPM values, raw read counts and feature lengths for genes, transcripts, exons and introns. The program describes the genomic features through a model generated from the gene transfer format file used during alignments reporting of the TPM values and the raw read counts for each feature. In this paper, we show the correlation for 1256 samples from the TCGA- BRCA project between TPM and FPKM reported by TPMCalculator and RSeQC. We also show the correlation for raw read counts reported by TPMCalculator, HTSeq and featureCounts.
Availability and implementation:
TPMCalculator is freely available at https://github.com/ncbi/
TPMCalculator. It is implemented in Cþþ14 and supported on Mac OS X, Linux and MS Windows.
Contact:
veraalva@ncbi.nlm.nih.gov
Supplementary information:Supplementary dataare available atBioinformaticsonline.
1 Introduction
Next-Generation Sequencing technologies are changing the way we analyze biological systems. RNA sequencing (RNA-seq) has become a standard procedure. Most RNA-seq experiments measure and compare transcript abundance between samples, which is a critical step for analyzing gene expression profiles under varying experimen- tal conditions.
In 2008, Mortazavi et al.introduced a normalization method designed to measure mRNA abundance and named the measure
‘reads per kilobase of exon model per million mapped reads’
(RPKM) (Mortazavi et al., 2008). This was later modified by Trapnellet al.by an alternative method named ‘fragments per kilo- base of transcript per million fragments sequenced’ (FPKM) (Trapnellet al., 2010). Although both RPKM and FPKM offer prac- tical ways to quantify mRNA abundance while comparing genomic features in the same sample, they may present biased values when
comparing multiple samples (Wagner et al., 2012). Due to this inconsistence, and the fact that RNA-Seq data analysis is more use- ful when comparing multiple samples from different experimental conditions, Wagner et al. introduced an alternative quantity to RPKM and FPKM named ‘transcripts per million’ (TPM) that cor- rects the inconsistences while comparing the RNA-seq abundance among independent samples.
Despite the theoretical and empirical demonstration that the units of mRNA abundance in terms of RPKM or FPKM differ be- tween samples (Wagneret al., 2012), the most popular computa- tional tools used by the research community still quantify the RNA-Seq abundance in terms of RPKM or FPKM. Although, there are emergent computational tools integrating TPM calculations in their pipelines, such as Salmon (Patroet al., 2017), the application is limited only to transcripts and cannot be used to estimate abundance of any other genomic features. Researchers, who would like to use
Published by Oxford University Press 2018. This work is written by US Government employees and is in the public domain in the US. 1960 Bioinformatics, 35(11), 2019, 1960–1962
doi: 10.1093/bioinformatics/bty896 Advance Access Publication Date: 31 October 2018 Applications Note
Downloaded from https://academic.oup.com/bioinformatics/article-abstract/35/11/1960/5150437 by Hungary EISZ Consortium user on 15 September 2019
TPM for other quantifications, need to implement their own scripts to calculate TPM values from raw read counts. This process requires the use of third-party software to calculate the raw read counts by introducing an additional step in the workflow pipeline. This is prone to errors due to inconsistences on read assignment models and the changing definition of genomic features in annotated databases such as GenBank and RefSeq (Coordinators, 2018).
Considering the value of the RNA-Seq abundance quantification and the lack of computational tools to process BAM files and calcu- late accurate TPM values directly from the alignments, we have developed a software package named TPMCalculator.
2 Materials and methods
TPMCalculator quantifies mRNA abundance directly from the alignments by parsing BAM files. The input parameters are the same gene transfer format (GTF) file used to generate the alignments, and one or multiple input BAM file(s) containing either single-end or paired-end sequencing reads. The TPMCalculator output is com- prised of five files per sample reporting the TPM values and raw read counts for genes, transcripts, exons and introns.
The model to describe the genomic features used for a gene is created from the GTF provided by the user. TPMCalculator per- forms two transformations which are executed on the genomic coor- dinates generating regions for the genes that include the exons and
‘pure’ intron regions as shown inSupplementary Figure S1. The first transformation creates overlapped exons for all alternative spliced forms of the gene. A single gene model is generated with unique exons and introns which includes the sequence of all exonic regions.
The second transformation creates a list of pure intron regions that replace those generated by the first transformation. We should em- phasize that only the intron regions included are from regions that are not from overlapping exons of other genes. Reporting TPM val- ues for these unique introns permits further identification of alterna- tive splicing events such as intron retention. Additionally, a set of non-overlapped gene features (exons and introns) are generated and used for TPM calculation.
3 Results
TPMCalculator is a one-step software package to quantify mRNA abundance for several genomic features including genes, transcripts, exons and introns. The program processes RNA-Seq alignments in BAM file format producing text files with TPM values, raw read counts and feature lengths for each genomic feature.
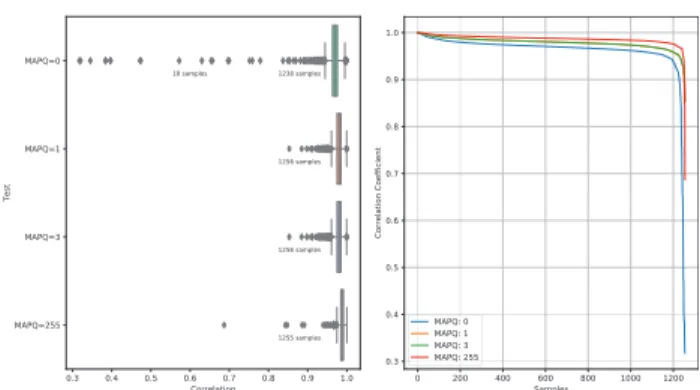
To validate our software, we calculate the Pearson correlation coefficient between TPM and FPKM for normalized expression val- ues using RNA-Seq data of 1256 samples from the TCGA-BRCA project (Koboldtet al., 2012). The FPKM values were calculated using the RSeQC package (Wanget al., 2012) as described in the Supplementary Material.
Figure 1shows the correlation coefficients obtained in this com- parison where 98.6% (1238 samples) correlated above 0.8 for the MAPQ¼0. Though, for the rest of MAPQ values, all samples were correlated with a correlation coefficient above 0.8 with the excep- tion of the MAPQ¼255 where one sample correlated with 0.69.
Additionally, the correlation coefficients were calculated for the raw reads counts reported by TPMCalculator, HTSeq (Anderset al., 2015) and featureCounts (Liaoet al., 2014). The correlation coeffi- cient between raw read counts between TPMCalculator and HTSeq
was above 0.9 for 99.2% (1246) samples. Only 10 samples showed no correlation with a coefficient below 0.2. TPMCalculator and featureCounts correlation coefficients were above 0.99 for 99.9% of the samples. Only one sample showed no correlation with correl- ation coefficient¼0.1. Samples with low correlation are shown in Supplementary Table S3.
TPMCalculator reports, in one single analysis, raw read counts and TPM values for genes, transcripts, exons and introns. Currently available tools are unable to generate a complete set of data for all genomic features. Additionally, TPMCalculator reduces the com- pute time and the resource requirements of RNA-Seq pipelines by eliminating several steps. TPMCalculator processes BAM files of size 7.0 GB in20 min requiring only 4 GB of RAM. This is an open source project available on the NCBI GitHub repository at https://
github.com/ncbi/TPMCalculator.
Acknowledgement
We would like to thank Iris Zhu for comments on the manuscript.
Funding
This work was supported by the Intramural Research Program of the National Institutes of Health, National Library of Medicine and National Center for Biotechnology Information (NIH, NLM, NCBI). L.S.P. was sup- ported by an appointment to the National Center for Biotechnology Information Scientific Visitors Program at Oak Ridge Institute for Science and Education (ORISE) through an interagency agreement between the U.S.
Department of Energy and the National Library of Medicine and by the UNKP-17-3 New National Excellence Program of Ministry of Human Capacities (Hungary).
Conflict of Interest:none declared.
References
Anders,S. et al. (2015) HTSeq–a Python framework to work with high-throughput sequencing data.Bioinformatics,31, 166–169.
Coordinators,N.R. (2018) Database resources of the National Center for Biotechnology Information.Nucleic Acids Res.,46, D8–D13.
Koboldt,D.C.et al. (2012) Comprehensive molecular portraits of human breast tumours.Nature,490, 61–70.
Liao,Y.et al. (2014) featureCounts: an efficient general purpose program for assigning sequence reads to genomic features.Bioinformatics,30, 923–930.
Mortazavi,A.et al. (2008) Mapping and quantifying mammalian transcrip- tomes by RNA-Seq.Nat. Methods,5, 621–628.
Fig. 1. Correlation coefficient calculated for 1256 samples between TPMCalculator (ExonTPM) and RSeQC FPKM
TPMCalculator 1961
Downloaded from https://academic.oup.com/bioinformatics/article-abstract/35/11/1960/5150437 by Hungary EISZ Consortium user on 15 September 2019
Patro,R.et al. (2017) Salmon provides fast and bias-aware quantification of transcript expression.Nat. Methods,14, 417–419.
Trapnell,C.et al. (2010) Transcript assembly and quantification by RNA-Seq reveals unannotated transcripts and isoform switching during cell differenti- ation.Nat. Biotechnol.,28, 511–515.
Wagner,G.P.et al. (2012) Measurement of mRNA abundance using RNA-seq data: RPKM measure is inconsistent among samples.Theory Biosci.,131, 281–285.
Wang,L. et al. (2012) RSeQC: quality control of RNA-seq experiments.
Bioinformatics,28, 2184–2185.
1962 R.V.Alvarez et al.
Downloaded from https://academic.oup.com/bioinformatics/article-abstract/35/11/1960/5150437 by Hungary EISZ Consortium user on 15 September 2019