R E S E A R C H A R T I C L E Open Access
Estimation of the severity of breathlessness in the emergency department: a dyspnea score
Tibor Gondos1,2* , Viktor Szabó3, Ágnes Sárkány4, Adrienn Sárkány5and Gábor Halász3
Abstract
Background:Dyspnea is a frequent complaint in emergency departments (ED). It has a significant amount of subjective and affective components, therefore the dyspnea scores, based on the patients’rating, can be ambiguous.
Our purpose was to develop and validate a simple scoring system to evaluate the severity of dyspnea in emergency care, based on objectively measured parameters.
Methods:We performed a double center, prospective, observational study including 350 patients who were admitted in EDs with dyspnea. We evaluated the patients’subjective feeling about dyspnea and applied our Dyspnea Severity Score (DSS), rating the dyspnea in 7 Dimensions from 0 to 3 points. The DSS was validated using the deterioration of pH, base- excess and lactate levels in the blood gas samples (Objective Classification Scale (OCS) 9 points and 13 points groups).
Results:All of the Dimensions correlated closely with the OCS values and with the subjective feeling of the dyspnea.
Using multiple linear regression analysis we were able to decrease the numbers of Dimensions from seven to four without causing a significant change in the determination coefficient in any OCS groups. This reduced DSS values (exercise tolerance, cooperation, cyanosis, SpO2 value) showed high sensitivity and specificity to predict the values of OCS groups (the ranges: AUC 0.77–0.99, sensitivity 65–100%, specificity 64–99%). There was a close correlation between the subjective dyspnea scores and the OCS point values (p< 0.001), though the scatter was very large.
Conclusions:A new DSS was validated which score is suitable to compare the severity of dyspnea among different patients and different illnesses. The simplified version of the score (its value≥7 points without correction factors) can be useful at the triage or in pre-hospital care.
Keywords:Dyspnea, Emergency, Triage, Score, Blood gas, Lactate, COPD, Heart failure
Background
We can define dyspnea as “a subjective experience of breathing discomfort that consists of a quality distinct sen- sation that varies in intensity” and involves “interactions among multiple physiological, social, and environmental factors, and may induce secondary physiological and be- havioral responses”[1, 2]. This symptom is associated with many disorders from psychological problems that are not dangerous to life-threatening conditions. Because it con- tains a large subjective component its degree does not ne- cessarily correlate well with the severity of the underlying
disease, e.g. patients with chronic disease get used to their symptoms and rate their illness much less than the real se- verity. At the triage in the ED or even in pre-hospital care it is important to estimate the actual severity components of dyspnea in a simple, objective way which reduces reli- ance on the patient’s subjective feelings.
Several illnesses can cause dyspnea. Dyspnea is only a non-specific sign of these diseases, though in severe form it is a significant warning symptom. The current scoring systems developed to estimate the severity of dyspnea are based mainly on subjective parameters and concentrate only on cardio-pulmonary disorders. The widely used Borg-scale [3] or its modified 10 point version [4] evaluate the patients’breathlessness from the level of non-existent to the maximum. The effectiveness of this scale has been
* Correspondence:gondos.tibor54@gmail.com
1Faculty of Health Sciences, Semmelweis University, Budapest, Hungary
2Emergency Department, Jávorszky Ödön Hospital, Vác, Hungary Full list of author information is available at the end of the article
© The Author(s). 2017Open AccessThis article is distributed under the terms of the Creative Commons Attribution 4.0 International License (http://creativecommons.org/licenses/by/4.0/), which permits unrestricted use, distribution, and reproduction in any medium, provided you give appropriate credit to the original author(s) and the source, provide a link to the Creative Commons license, and indicate if changes were made. The Creative Commons Public Domain Dedication waiver (http://creativecommons.org/publicdomain/zero/1.0/) applies to the data made available in this article, unless otherwise stated.
proved in patients with chronic obstructive pulmonary disease (COPD) or asthma. Mahler and Wells [5] com- pared three dyspnea rating methods based on the patients’
evaluation and found good correlations with spirometric data in different lung disorders. van der Molen et al. [6]
developed a Clinical COPD Questionnaire of 10 items whose effectiveness was proven when compared to the Global Initiative for Chronic Obstructive Lung Disease staging and to the BODE index (body mass index, airflow obstruction, dyspnea, exercise capacity) [7].
Distinguishing between cardiac and pulmonary causes of dyspnea can cause a diagnostic dilemma. Recently, in addition to the patients’ subjective feelings of discom- fort, several methods were tested to improve the diag- nostic and prognostic efficacy of dyspnea scoring, eg.
core-peripheral temperature gradient [8], sequential dyspnea provocation by positioning and walking [9], structured 3-minute walk test [10], S3 captured acous- tic cardiography [11], non-invasive measurement of cardiac output and thoracic fluid content [12], includ- ing B-type natriuretic peptide levels [13, 14], and even the use of a wide range of biomarkers [15] and physio- logical variables [16]. The problem with all of these ap- proaches is that they need a specific intervention or tool. Moreover, the process is time-consuming and therefore not suitable for immediate triage decisions.
As dyspnea is an important sign of alarm at the triage and because it involves a significant number of subject- ive and affective components, the patients’ assessment might be misleading. Objective evaluation of the sever- ity of dyspnea is crucial in EDs, but unfortunately, we do not have any single,“magic”parameter which would describe correctly the severity of dyspnea. For objectifi- cation, a plausible solution is to choose pH, base excess (BE) and lactate levels in combination, because all of these are easily available in an emergency setting and characterize very well the severity of the patients’differ- ent illnesses [17–25].
With this background, we developed a simple scoring system based on objectively measured parameters that would represent the severity of dyspnea in different ill- nesses (suitable for scientific comparisons) and help in the immediate decision-making at the triage in the ED or even in pre-hospital care.
Methods
Study design and setting
This study was an observational examination using a prospectively collected database analysis conducted in two regional EDs in Hungary (Jávorszky Ödön Hospital, Vác, n= 158; “Szent György” University Teaching Hos- pital, Székesfehérvár,n= 192). Informed consent for par- ticipation in the study was obtained from every participant. The study was approved by the local Ethical
Committees (Institutional Ethical Committee, “Szent György” University Teaching Hospital and Institutional Ethical Committee, Jávorszky Ödön Hospital).
From April 15, 2013 to January 15, 2015 all patients over the age of 18 were recruited who had had any kind of breathing complaints which required a blood gas ana- lysis (venous or arterial sample) with lactate measure- ment, based on the decision of the examining clinicians.
Altogether, 350 patients having complete data at admis- sion were entered into the study. One patient was in- cluded only once using the first measurement set in the ED. Those patients who were unable to evaluate their severity of breathlessness were excluded from the study.
Measurements
After registering the basic demographic data (age, gender, primary reason for emergency admittance) the patients were asked to evaluate their breathlessness using a 10 point numeric scale with 1 point corresponding to the de- scription “I have no breathing problems” and 10 points corresponding to the description“I have severe breathing difficulties, I am almost dead”. After that, the examining physician completed the Dyspnea Severity Score (DSS), rating the dyspnea in 7 dimensions from 0 to 3 points (Table 1). (All of the applied categories are used in daily clinical practice and can represent the severity of dys- pnea). The scaling points were arbitrarily determined, with patients being able to earn a maximum score of 21 points.
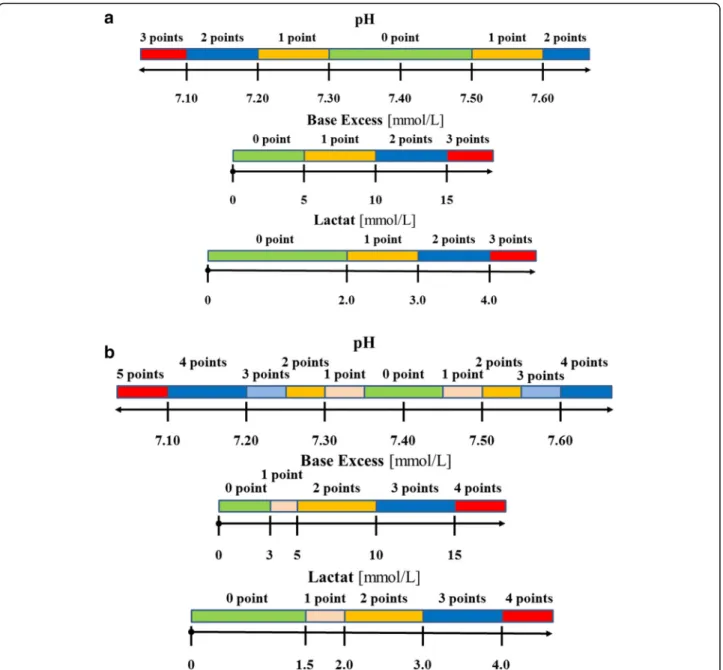
An arterial or a venous blood gas sample was taken from every patient complaining of dyspnea (arterial sam- pling being preferred when we wanted to know the exact levels of oxygen and carbon dioxide) and pH, BE, and lac- tate levels were recorded to evaluate the dyspnea in an ob- jective way. All of the parameters were given a point value. Lacking a previous similar analysis, two types of Objective Classification Scale (OCS) were used to estimate the severity of dyspnea. The scaling points were arbitrarily determined, based on clinical practice.
In the 9 point scale (Fig. 1a) the normal ranges were quite wide, followed by a parallel stepwise increase in se- verity and OCS points. The maximum score was 9 points.
In the 13 point scale (Fig. 1b) we used narrower normal ranges and put intermediate ranges before the critical.
The maximum score was 13 points.
Data analysis
Data were analyzed using the R Statistics Program, ver- sion 3.1.3 [26]. Descriptive statistics included median and interquartile ranges (IQR) for continuous variables and counts and percentages for categorical variables.
Using multivariable regression analysis, OCS values were estimated using the 7 dimensions of the DSS. First, all 7 dimensions were included in the model. Then the numbers of variables were reduced using the forward
stepwise method. In the beginning no variables were in- cluded in the model. At each step, the variable that im- proved the most was entered into the analysis until all corresponding regression parameters were not signifi- cantly different from zero atp< 0.01.
To calculate optimal sensitivity and specificity of the estimated OCS scores, receiver operating characteristics (ROC) curve analysis was performed using the pROC pack- age [27] at different cut-off points. The cut-off point was used to select patients with severe dyspnea based on their original OCS scores both in the 9 and the 13 point system.
For example, when the cut-off point was set to 4, all pa- tients with a score of least 4 were assumed to have severe dyspnea. The analysis was performed using the estimated OCS scores with the reduced number of parameters.
To estimate the relationship between the patients’sub- jective feelings and objective diagnostic results, subject- ive scores were compared to estimated dyspnea scores.
Results
All of the 350 patients included in the study were Cauca- sian, of whom 199 (56.9%) were female and 151 (43.1%) were male. There was no significant difference between their ages (female: median 73 years, IQR 62, 81 years vs.
male: 72 years, IQR 62, 78 years). The primary reasons for admittance were heterogeneous: 184 patients (53%) mainly had pulmonary problems, 152 patients (43%) had cardiac problems, and 34 patients (10%) had other prob- lems which were independent of the cardiopulmonary sys- tem. 15 patients had both pulmonary and cardiac problems. The most frequent illnesses were the following:
congestive heart failure 137 (39.1%), COPD acute exacer- bation 107 (30.6%), pneumonia 62 (17.7%), pulmonary embolism 15 (4.3%), metabolic disease 14 (4%), pulmonary tumor 11 (3.1%), and bronchial asthma, sepsis and acute bronchitis 10-10 cases (2.9%).
The distributions of patients according to the se- verity of the different dimension scores were quite homogenous for Dimensions 2 (speech), 6 (breath- ing), 7 (heart rate/rhythm), but asymmetric for Di- mension 1 (exercise tolerance) (214 patients - 61.1%
- had dyspnea in rest), Dimension 3 (cooperation) (280 patients - 80% - had no problem with commu- nication), and Dimension 4 (cyanosis) (186 patients - 53.1% - had no cyanosis).
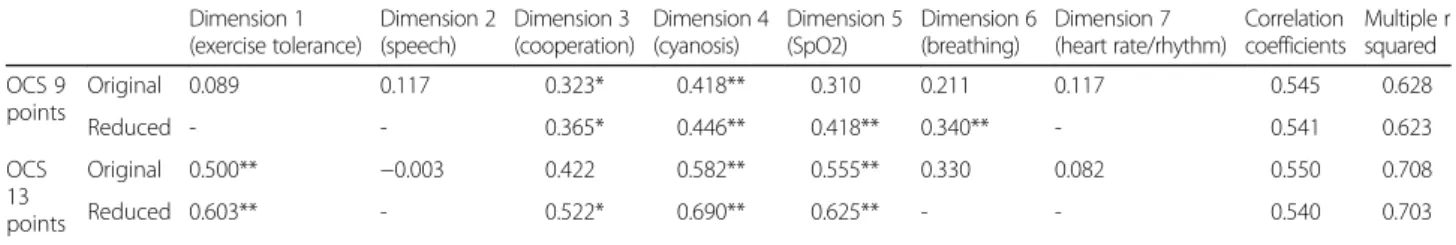
Significant correlations were observed for pairs of dimensions (p< 0.001). The correlation coefficients changed from 0.228 (Dimension 1 (exercise toler- ance) and 4 (cyanosis)) to 0.721 (Dimension 2 (speech) and 6 (breathing)). All of the dimensions also correlated very well with the OCS values and with the subjective experience of the dyspnea, as rated by the patients (Table 2).
To predict the values of the OCSs, multiple linear regression (forward stepping method) was performed using the combination of parameters Dimension 1–7.
Increasing the number of dimensions from four to seven did not lead to a significant change in the de- termination coefficient in any of the OCS groups and showed a very close correlation with the original score values (r= 0.988 andr= 0.985, respectively). The coefficients, the correlations between the original and estimated OCSs, as well as the determination coeffi- cients (multiple r squared values) of the linear model are presented in Table 3. The determination coeffi- cient which represents the summarized statistical pre- dictive role was better in the OCS 13 point group.
Including the patients’ subjective dyspnea rating scores in the analysis did not significantly increase the predictive role of the model.
In order to analyze the sensitivity and specificity of the re- duced dimension scales to predict the severity of the OCS Table 1Dyspnea Severity Scale
Dimension Category 0 point 1 point 2 points 3 points
1 Exercise
tolerance
No dyspnea during regular activity
Dyspnea during walking Dyspnea after a few steps Dyspnea in rest
2 Speech Undisturbed
in rest
Unable to finish a whole sentence Tells only short sentences or words
Unable to speak, only nodding
3 Cooperation Executes
instructions
Execute instructions after repeated requests
Difficult to tolerate oxygen mask
Agitated, unconsciousness 4 Cyanosis None Lips/acro-cyanosis during exercise Lips/acro-cyanosis in rest Severe cyanosis with
cold sweat
5 SpO2 In rest >95%
in ambient air
In rest 90–95% in ambient air, >95% after <5 l/min oxygen inhalation
In rest <90% in ambient air,
>95% after high flow of oxygen inhalation
In rest <90% in ambient air, <95% after high flow of oxygen inhalation 6 Breathing Normal in rest Respiratory rate >24/min in rest Using respiratory muscles Orthopnea
7 Heart rate/
rhythm
HR < 100/min in rest
100/min < HR <120/min in rest 120/min < HR <140/min in rest or HR >100/min with arrhythmias
HR >140/min in rest or HR >120/min with arrhythmias
values, ROC analysis was performed at different cut-off points. ROC curves for both OCS groups are presented in Fig. 2 with the corresponding tables (Table 4). Increasing the cut-off points resulted in increased AUCs and higher sensitivity and specificity levels.
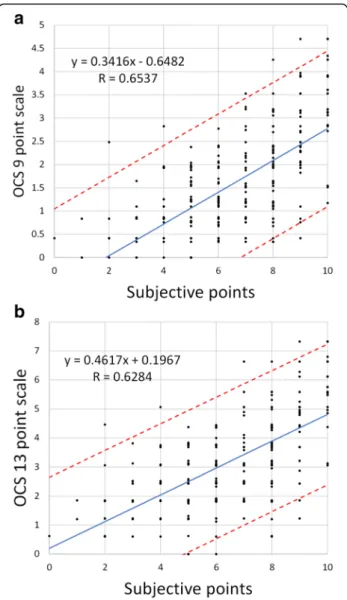
There was a close correlation (Fig. 3) between the sub- jective dyspnea rating scores and the reduced OCS 9 point and 13 point values (equivalent to the DSS point values) (p< 0.001), though the scatter was very large over the whole range of subjective points.
Table 2Correlation coefficients between the different Dimensions and the Objective Classification Scales and the subjective rating of the patients
Dimension 1 (exercise tolerance)
Dimension 2 (speech)
Dimension 3 (coopertation)
Dimension 4 (cyanosis)
Dimension 5 (SpO2)
Dimension 6 (breathing)
Dimension 7 (heart rate/rhythm)
OCS 9 points 0.326 0.440 0.385 0.471 0.417 0.450 0.299
OCS 13 points 0.337 0.398 0.348 0.438 0.409 0.428 0.252
Subjective rating 0.442 0.588 0.419 0.485 0.452 0.615 0.401
Fig. 1Components of the Objective Classification Scale (a9 points,b13 points)
Discussion
In this study a simple scoring system was developed that can be utilized regardless of dyspnea etiology or stage of illness, independently of the patient’s subjective evalu- ation, and this scoring system can also be useful at the emergency triage or even in pre-hospital care. Objective evaluation of the severity of dyspnea is crucial in EDs.
Dyspnea is one of the most frequent complaints of the patients admitted and - providing such a distressing sig- nal as it does - may represent the summation of a num- ber of pathophysiological and psychological factors [5].
It is an important sign of alarm at the triage, but because a significant number of subjective and affective Table 3Coefficients, correlation and multiple r squared values of the original and the reduced linear models for OCS 9 point and OCS 13 point groups
Dimension 1 (exercise tolerance)
Dimension 2 (speech)
Dimension 3 (cooperation)
Dimension 4 (cyanosis)
Dimension 5 (SpO2)
Dimension 6 (breathing)
Dimension 7 (heart rate/rhythm)
Correlation coefficients
Multiple r squared OCS 9
points
Original 0.089 0.117 0.323* 0.418** 0.310 0.211 0.117 0.545 0.628
Reduced - - 0.365* 0.446** 0.418** 0.340** - 0.541 0.623
OCS 13 points
Original 0.500** −0.003 0.422 0.582** 0.555** 0.330 0.082 0.550 0.708
Reduced 0.603** - 0.522* 0.690** 0.625** - - 0.540 0.703
*p< 0.01, and **p< 0.001
Fig. 2ROC curves for prediction of different levels of OCS values.
aOCS 9 point group,bOCS 13 point group
Table 4Complementary tables for the ROC analysis.“A”OCS 9 point group,“B”OCS 13 point group
OSC point AUC Threshold Sensitivity Specificity A
≥1 0.7701 1.4926 65% 81%
≥2 0.8013 1.6565 76% 75%
≥3 0.7793 1.6565 80% 67%
≥4 0.8012 1.6991 89% 64%
≥5 0.8195 2.75 70% 87%
≥6 0.8485 1.9656 89% 71%
≥7 0.9455 2.7534 100% 83%
≥8 0.9942 4.6219 100% 99%
B
≥1 0.7544 2.436 76% 71%
≥2 0.7901 3.0616 68% 81%
≥3 0.7822 3.1262 69% 80%
≥4 0.7815 3.1262 76% 72%
≥5 0.7588 3.1262 80% 67%
≥6 0.7986 3.584 86% 68%
≥7 0.7809 3.584 86% 66%
≥8 0.7706 4.3774 71% 78%
≥9 0.7883 4.3692 76% 78%
≥10 0.8694 3.7952 93% 71%
≥11 0.9613 5.0271 100% 84%
≥12 0.9942 7.0638 100% 99%
components are involved, the patients’assessment might be misleading.
Unfortunately, we do not have any single, “magic”par- ameter which would describe correctly the severity of dys- pnea. We can improve our diagnostic accuracy using the clinical signs of respiratory distress (tachycardia, tachyp- nea, abnormal respiratory patterns, cyanosis, nasal flaring, use of accessory respiratory muscles, paradoxical motion of the chest, exercise intolerance, etc.), or their combina- tions, with different laboratory and other diagnostic test- ing results (ECG, chest x-ray, CT-scan, echocardiography, etc.) [8–16]. However, these procedures need a significant amount of time and a high level of expert evaluation and financial sourcing. This was the reason we tried in this study to develop a simple scoring system based on object- ively measured parameters that would represent the
severity of dyspnea in different illnesses and help in the immediate decision-making.
In the first step we developed a severity scale (DSS) in- cluding 7 dimensions with the rating possibility from 0 to 3 points. All of the categories were simple to measure and capable of characterizing the severity of dyspnea more objectively than the patients’ feelings of discom- fort. These dimensions are also suitable for describing dyspnea independently of the primary cause (pulmonary, cardiac and other forms).
To validate this dyspnea score we compared its value to a more objective rating system (OCS) including cer- tain blood gas parameters and lactate levels. This param- eter combination has never been used previously, but as individual parameters they have an important role to play in the evaluation of the patient’s status. The pH and BE values from the blood gas sample and the lactate levels are strongly related in both arterial and venous blood so we can use samples from either origin [28–30].
These three parameters represent a summary of the pathophysiological processes and are independent of our examined categories. The shift of the pH value in any direction means that the compensatory mechanisms of the body in respect of acidosis and alkalosis are exhausted and a significant problem lies behind the dys- pnea [31, 32]. Greater changes indicate the presence of more severe underlying diseases. The BE value is a good indication of metabolic compensation [17, 18, 31–34].
Both negative and positive values are warning signs of the severity of illness. Negative values are typical in all kinds of circulatory problems as well as severe metabolic diseases (eg. kidney failure, diabetic ketoacidosis), while positive values occur primarily in the case of COPD pa- tients. Lactate level represents mainly the anaerobic me- tabolism in the tissues when the patient has no significant liver disease. Increased lactate level correlates very well with the severity of the tissue oxygen metabol- ism [19–25, 35], independently of the original cause (hypoxia, low blood flow states, oxygen utilization prob- lems in the mitochondria, etc.). Given the lack of previ- ous research, two forms of OCS were used, combining the pH, BE and lactate levels into a score - a 9 point scale and a more detailed 13 point scale.
In our mixed patient population all of the dimension score values showed a significant correlation with either the OCS 9 point or with the OCS 13 point values. This means that the dimensions examined actually represented the severity of dyspnea. Strong correlations were found between the patients’ rating points and the dimension score values, which may also support the adequacy of these dimensions for predicting the severity of dyspnea.
Using linear multiple regression analysis to evaluate the summarized role of the dimensions in predicting the OCS point values very strong correlations were found between
Fig. 3Subjective scores with 95% CI plotted against estimated values of OCSs for the reduced linear model.aOCS 9 point group,bOCS 13 point group
the original and the estimated scores. The best result was in the OCS 13 point model where the multiple r squared value was 0.708. Surprisingly, including the patients’ dys- pnea score values in the analysis only caused minimal changes in the prediction. This means that the dimensions relate more closely to the objective dyspnea markers than the patients’subjective ratings. Linear regression analysis of patients’rating score values and the decreased dimen- sion scores (Fig. 3) also demonstrate that patients’subject- ive feelings are not in accordance with the objective assessment of dyspnea.
Using forward stepwise model of multiple regression analysis we were able to reduce the number of dimensions from seven to four parameters without increasing the pre- diction error significantly. The best result was found in the OCS 13 point model where, by including Dimension 1, 3, 4 and 5, the prognostic probability did not decrease significantly compared to the original model where all of the dimensions were included. The high correlation coeffi- cients in the linear regression analysis (Table 3) also rein- forced the conclusion that only four parameters were necessary to predict the OCS values.
To compare the applicability of the Four Dimension Model for categorizing the severity of dyspnea, ROC ana- lysis was performed for different cut-off points. The optimal cut-off point was ≥4 points for the OCS 9 point model (sensitivity: 89%, specificity: 64%, AUC: 0.8021) and ≥7 points for the OCS 13 point model (sensitivity: 86%, specifi- city: 68%, AUC: 0.7809). However, values of AUC ranging between 0.77 and 0.99 for OCS 9 points and 0.75 and 0.99 for OCS 13 points suggest that the chosen parameters can be used to detect dyspnea in this mixed emergency care population at a wide range of cut-off points.
Limits of the study
This study has some limitations. First, the number patients included was enough to analyze their data as a whole but it was insufficient to make a detailed evaluation in respect of age, gender, and basic ill- nesses. Second, the validation based on blood gas pa- rameters and lactate level taken from arterial or venous blood was not evidence based. According to the result of recent articles [28–30, 36] venous and arterial pH and bicarbonate agree reasonably well at all values and the lactate level showed a poorer agree- ment only at abnormal values. This was the scientific background using arterial or venous samples. In a few cases during the study, a parallel sampling resulted in a close correlation between pH, BE and lactate levels but this analysis has not been published yet. Third, we did not collect outcome data from the subsequent progress of the patients, so the developed dyspnea score is validated only in an emergency triage situ- ation. And finally, we did not compare our data with
other scoring systems to evaluate which one is more effective in predicting dyspnea severity.
Conclusion
In summary, we have developed a new, simple dys- pnea scoring system derived from four dimensions (exercise tolerance, cooperation, cyanosis, SpO2 value;
multiplied by appropriate coefficients), which corre- lates well with objective classification parameters. The simplified version of the score (its value ≥7 points without correction factors) can be useful at the triage or in pre-hospital care.
Abbreviations
AUC:Area under the curve; BE: Base excess; CI: Confidence interval; COPD: Chronic obstructive pulmonary disease; DSS: Dyspnea Severity Score; ED: Emergency department; HR: Heart rate; IQR: Interquartile ranges; OCS: Objective Classification Scale; ROC: Receiver operating characteristics; SpO2: Pulzoxymetric oxygen saturation
Acknowledgements Not applicable.
Funding None.
Availability of data and materials
The datasets used and/or analyzed during the current study are available from the corresponding author on reasonable request.
Authors’contributions
TG participated in the design of the study, in data collection and drafted the manuscript. VSz and GH performed the statistical analysis and helped to draft the manuscript. ÁS and AS participated in the design of the study and in data collection. All authors read and approved the final manuscript.
Competing interests
The authors declare that they have no competing interests.
Consent for publication Not applicable
Ethics approval and consent to participate
Ethics approvals were obtained from the local Ethical Committees (Institutional Ethical Committee Position 02 April 2013, Székesfehérvár and, Institutional Ethical Committee Position 01 April 2013, Vác). Informed consent for participation in the study was obtained from every participant.
Publisher’s Note
Springer Nature remains neutral with regard to jurisdictional claims in published maps and institutional affiliations.
Author details
1Faculty of Health Sciences, Semmelweis University, Budapest, Hungary.
2Emergency Department, Jávorszky Ödön Hospital, Vác, Hungary.
3Department of Hydrodynamic Systems, Budapest University of Technology and Economics, Budapest, Hungary.4Emergency Department,“Szent György” University Teaching Hospital, Székesfehérvár, Hungary.5Emergency Department,“Kaposi Mór”University Teaching Hospital, Kaposvár, Hungary.
Received: 6 January 2017 Accepted: 18 April 2017
References
1. American Thoracic Society. Dyspnea. Mechanisms, assessment, and management:
a consensus statement. Am J Respir Crit Care Med. 1999;159:321–40.
2. Parshall MB, Schwartzstein RM, Adams L, et al. An official ATS statement:
update on the mechanisms, assessment, and management of dyspnea. Am J Respir Crit Care Med. 2012;185:435–52.
3. Borg G. Psychophysical bases of perceived exertion. Med Sci Sports Exerc.
1982;14:377–81.
4. Kendrick KR, Baxi SC, Smith RM. Usefulness of the modified 0-10 Borg scale in assessing the degree of dyspnea in patients with COPD and asthma. J Emerg Nurs. 2000;26:216–22.
5. Mahler DA, Wells CK. Evaluation of clinical methods for rating dyspnea.
Chest. 1988;93:580–6.
6. van der Molen T, Willemse BWM, Schokker S, et al. Development, validity and responsiveness of the clinical COPD questionnaire. Health Qual Life Outcomes. 2003;1:13.
7. Liu S-F, Tseng C-W, Tu M-L, Wang CC, et al. The clinical COPD questionnaire correlated with BODE index - a cross-sectional study. Scient World J. 2012;
2012:361535.
8. Clarke SF, Parris RJ, Reynard K. Core-peripheral temperature gradient as a diagnostic test in dyspnea. Emerg Med J. 2005;22:633–5.
9. Pang PS, Cleland JGF, Teerlink JR, for the Acute Heart Failure Syndromes International Working Group, et al. A proposal to standardize dyspnea measurement in clinical trials of acute heart failure syndromes: the need for a uniform approach. Eur Heart J. 2008;29:816–24.
10. Pan AM, Stiell IG, Clement CM, Acheson J, Aaron SD. Feasibility of a structured 3-minute walk test as a clinical decision tool for patients presenting to the emergency department with acute dyspnea. Emerg Med J. 2009;26:278–82.
11. Collins SP, Peacock WF, Lindsell CJ, et al. S3 detection as a diagnostic and prognostic aid in emergency department patients with acute dyspnea. Ann Emerg Med. 2009;53:748–57.
12. García X, Simon P, Guyette FX, et al. Noninvasive assessment of acute dyspnea in the ED. Chest. 2013;144:610–5.
13. Moe GW, Howlett J, Januzzi JL, for the Canadian Multicenter Improved Management of Patient With Congestive Heart Failure (IMPROVE-CHF) Study Investigators, et al. N-terminal B-type natriuretic peptide testing improves the management of patients with suspected acute heart failure. Preliminary results of the Canadian prospective randomized multicenter IMPROVE-CHF study. Circulation. 2007;115:3103–10.
14. Jang TB, Aubin C, Naunheim R, Lewis LM, Kaji AH. The predictive value of physical examination findings in patients with suspected acute heart failure syndrome. Intern Emerg Med. 2012;7:271–4.
15. Eurlings LW, van Wijk SS, van Kimmenade R, et al. Multimarker strategy for short-term risk assessment in patients with dyspnea in the Emergency Department. The MARKED (Multi mARKer Emergency Dyspnea)-Risk Score. J Am Coll Cardiol. 2012;60:1668–77.
16. Baggish AL, Lloyd-Jones DM, Blatt J, et al. A clinical and biochemical score for mortality prediction in patients with acute dyspnoea: derivation, validation and incorporation into a bedside programme. Heart. 2008;94:1032–7.
17. Ibrahim I, Chor WP, Chue KM, et al. Is arterial base deficit still a useful prognostic marker in trauma? A systematic review. Am J Emerg Med. 2016;34:626–35.
18. Lam SW, Lingsma HF, van Beek EDF, Leenem PLH. Validation of a base deficit-based trauma prediction model and comparison with TRISS and ASCOT. Eur J Trauma Emerg Surg. 2016. doi:10.1007/s00068-015-0592-y.
19. Pedersen M, Brandt VS, Holler JG, Lassen AT. Lactate level, aetiology and mortality of adult patients in an emergency department: a cohort study.
Emerg Med J. 2015;32:678–84.
20. El-Kersh K, Chadda U, Sinha RS, et al. Predictive role of admission lactate level in critically ill patients with acute gastrointestinal bleeding. J Emerg Med. 2015;49:318–25.
21. Gwak MH, Jo S, Jeong T, et al. Initial serum lactate level is associated with inpatient mortality in patients with community-acquired pneumonia. Am J Emerg Med. 2015;33:685–90.
22. Chen Y-X, Li C-S. Lactate on emergency department arrival as a predictor of mortality and site-of-care in pneumonia patients: a cohort study. Thorax. 2015;70:
404–10.
23. Vanni S, Jimenez D, Nazerian P, et al. Short-term clinical outcome of normotensive patients with acute PE and high plasma lactate. Thorax. 2015;70:333–8.
24. Barfod C, Lundstrom H, Lauritzen MMP, et al. Peripheral venous lactate at admission is associated with in-hospital mortality, a prospective cohort study. Acta Anaesthesiol Scand. 2015;59:514–23.
25. Datta D, Walker C, Gray AJ, et al. Arterial lactate levels in an emergency department are associated with mortality: a prospective observational cohort study. Emerg Med J. 2015;32:673–7.
26. R Core Team. R: A language and environment for statistical computing.
Vienna: R Foundation for Statistical Computing; 2016. https://www.R-project.
org/.
27. Robin X, Turck N, Hainard A, et al. pROC: an open-source package for R and S+ to analyze and compare ROC curves. BMC Bioinformatics. 2011;12:77.
28. Zakrison T, McFarlan A, Wu YY, et al. Venous and arterial base deficits: Do these agree in occult shock and in the elderly? A Bland-Altman analysis. J Trauma Acute Care Surg. 2013;74:936–9.
29. Kelly A-M, Klim S. Agreement between arterial and venous pH and pCO2 in patients undergoing non-invasive ventilation in the emergency department.
Emerg Med Australasia. 2013;25:203–6.
30. Goyal N, Taylor AR, Rivers EP. Relationship between central and peripheral venous oxygen saturation and lactate levels: a prospective study. J Emerg Med. 2016;50:809–17.
31. Adrogué HJ, Madias NE. Management of life-threatening acid-base disorders. N Eng J Med. 1998;338:26–34.
32. Kaplan LJ, Frangos S. Clinical review: Acid–base abnormalities in the intensive care unit. Crit Care. 2005;9:198–203.
33. Frantz TL, Gaski GE, Terry C, et al. The effect of pH versus base deficit on organ failure in trauma patients. J Surg Res. 2016;200:260–5.
34. Mutschler M, Nienaber U, Wafaisade A, et al. The impact of severe traumatic brain injury on a novel base deficit- based classification of hypovolemic shock. Scand J Trauma Resusc Emerg Med. 2014;22:28.
35. Allen M. Lactate and acid base as a hemodynamic monitor and markers of cellular perfusion. Pediatr Crit Care Med. 2011;12(Suppl):S43–9.
36. Bloom BM, Grundlingh J, Bestwick JP, Harris T. The role of venous blood gas in the Emergency Department: a systematic review and meta-analysis. Eur J Emerg Med. 2014;21:81–8.
• We accept pre-submission inquiries
• Our selector tool helps you to find the most relevant journal
• We provide round the clock customer support
• Convenient online submission
• Thorough peer review
• Inclusion in PubMed and all major indexing services
• Maximum visibility for your research Submit your manuscript at
www.biomedcentral.com/submit
Submit your next manuscript to BioMed Central and we will help you at every step: