Meta-analysis of gene expression profiles associated with histological classification and survival in 829 ovarian cancer samples
Tibor Fekete1, Erzse´bet Ra´so´2, Imre Pete3, Ba´lint Tegze4, Istva´n Liko5, Gyo¨ngyi Munka´csy4, Norbert Sipos1, Ja´nos Rigo´, Jr.1and Bala´zs Gyo¨rffy6,7
1Semmelweis University, 1st Department of Gynecology, Budapest
2Semmelweis University, 2nd Department of Pathology, Budapest
3National Institute of Oncology, Ra´th Gyo¨rgy u. 7-9, H-1122 Budapest, Hungary
4Semmelweis University, 1st Department of Pediatrics, Budapest
5Gedeon Richter Plc., Gyo¨mr}oi u. 19-21., H-1475 Budapest, Hungary
6Research Laboratory of Pediatrics and Nephrology, Hungarian Academy of Sciences - Semmelweis University, 1st Department of Pediatrics, Budapest
7Laboratory of Functional Genomics, Charite´, Berlin, Germany
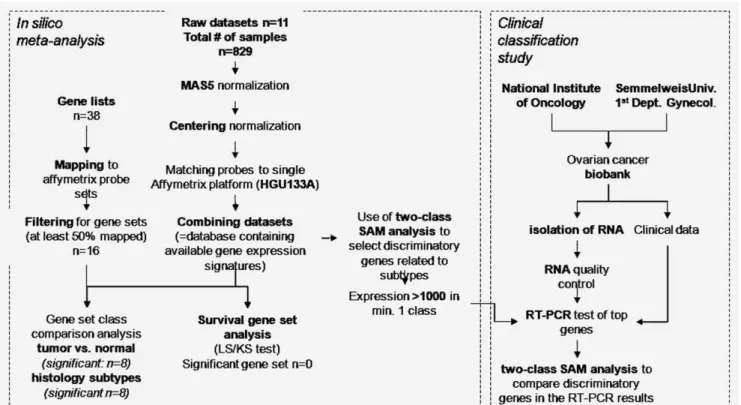
Transcriptomic analysis of global gene expression in ovarian carcinoma can identify dysregulated genes capable to serve as molecular markers for histology subtypes and survival. The aim of our study was to validate previous candidate signatures in an independent setting and to identify single genes capable to serve as biomarkers for ovarian cancer progression. As several datasets are available in the GEO today, we were able to perform a true meta-analysis. First, 829 samples (11 datasets) were downloaded, and the predictive power of 16 previously published gene sets was assessed. Of these, eight were capable to discriminate histology subtypes, and none was capable to predict survival. To overcome the differences in previous studies, we used the 829 samples to identify new predictors. Then, we collected 64 ovarian cancer samples (median relapse-free survival 24.5 months) and performed TaqMan Real Time Polimerase Chain Reaction (RT-PCR) analysis for the best 40 genes associated with histology subtypes and survival. Over 90% of subtype-associated genes were confirmed. Overall survival was effectively predicted by hormone receptors (PGR and ESR2) and by TSPAN8. Relapse-free survival was predicted by MAPT and SNCG. In summary, we successfully validated several gene sets in a meta-analysis in large datasets of ovarian samples.
Additionally, several individual genes identified were validated in a clinical cohort.
With 43,000 cases in Europe and 22,000 cases in the United States of America each year, ovarian carcinoma is the eighth most frequent malignant tumor in the female popula- tion. Although some improvements were achieved in the 5-year survival due to improved efficiency of surgery and treatment with empirically optimized combinations of cyto- toxic drugs, the overall cure rate today remains as low as 30%. The most likely explanation for this is the high hetero- geneity of ovarian carcinomas.
Subtypes of ovarian cancer are recognized based on grade and on histologic subtypes. While high-grade malignancies grow rapidly, are relatively chemosensitive and evolve with- out a definitive precursor lesion, low-grade tumors grow more slowly, are more resistant to chemotherapy and share molecular characteristics with other low-malignant potential neoplasms.1 Expression profiling studies have shown that high-grade tumors cluster separately from low-grade carcino- mas and borderline tumors.2,3About 90% of epithelial ovar- ian cancers are clonal.4 This is also reflected in their classifi- cation into four different main histotypes of high-grade serous (resembling normal cells of the fallopian tube), endo- metrioid (cells of the endometrium), mucinous (endocervix) and clear cell (vagina) cancers. The correlation between the different subtypes and their precursor cells were already con- firmed by altered gene expression patterns.5 These subtypes show further differences regarding their epidemiology, genetic changes, gene expression, tumor markers and chemotherapy response. Meanwhile, similarities were also described between high-grade serous and endometrioid cancers and between endometrioid and clear-cell cancers.6,7High-grade serous and endometrioid cancers respond better to platinum- and tax- ane-based chemotherapeutic regimens than the other Key words:ovarian cancer, gene expression, meta-analysis,
bioinformatics, RT-PCR, histology, survival
Additional Supporting Information may be found in the online version of this article.
Grant sponsor:OTKAPD;Grant number:83154;Grant sponsor:
ETT;Grant number:029/2009 DOI:10.1002/ijc.26364
History:Received 9 Mar 2011; Accepted 27 Jun 2011; Online 19 Aug 2011
Correspondence to:Tibor Fekete, Semmelweis University, 1st Department of Gynecology, Budapest, u¨lloi u. 26, H-1088, Tel:
þ36-30-2219951, Fax:þ36-1-3036-077, E-mail: tibfek@gmail.com
Cancer Genetics
International Journal of Cancer
subtypes. Mucinous and endometrioid carcinomas are less aggressive and have a better overall survival than high-grade serous tumors. Mucinous and endometrioid ovarian carcino- mas have low malignant potential.1,4,8 Mucinous, but not clear cell histology, is associated with significantly worse prognosis in advanced ovarian cancer treated with combina- tion platinum/paclitaxel.9 Clinicians also recognize that the behavior of endometrioid adenocarcinoma is quite different from that of clear cell or high-grade serous carcinoma. The aggressive high-grade serous tumors account for approxi- mately 60 to 80% of ovarian cancer cases. It is of outmost in- terest to identify markers of histology subtypes, disease pro- gression and aggressiveness.
It was previously hypothesized that analysis of global gene expression in ovarian carcinoma can identify dysregulated genes capable of serving as molecular markers, provide insight into the molecular characteristics of the disease and provide the basis for development of new diagnostic tools as well as new targeted therapy protocols. Gene expression anal- ysis has identified ovarian carcinogenesis-,10–30histology sub- type-,12,19,31,32
therapy response-,33–39prognosis- and progres- sion-21,24,40–44
related gene signatures. In a recent study, a databank of single genes published as components of gene expression profiles specific for ovarian carcinoma was con- structed with usable data sets that used different array tech- nology platforms. In these studies, 463 genes were associated with histological subtypes, but none of them was identified in more than a single study.45 The discrepancy and low repro- ducibility of these studies also led to the limited predictive
values of these signatures which have not yet been sufficient to affect patient management.
One of the main weakness of previous studies was the low sample number used for analysis. As currently several datasets are available in the Gene Expression Omnibus, we decided to perform a true meta-analysis of these data. Our further aim was to overcome the differences in previous studies and to es- tablish a new predictor which is capable to discriminate between the four most frequent histology subtypes as well as predict prognosis in ovarian cancer. To achieve these goals, we accumulated a sizeable collective of public microarray datasets, analyzed the data and then used samples from our ovarian can- cer biobank for subsequent RT-PCR based validation.
Methods
Included raw microarray studies
We systematically searched Pubmed (http://www.pubmed.- com) and GEO (http://www.ncbi.nlm.nih.gov/geo/) using the keywords ‘‘ovarian,’’ ‘‘normal,’’ ‘‘cancer’’ and ‘‘GPL96’’ and
‘‘GPL570’’ (platform accession names for Affymetrix HGU133A and HGU133Aþ2 microarrays). Only studies publishing raw microarray expression data were considered and included in our present analyses.
Statistical analyses
First, the platform GPL570 was mapped to the platform GPL96 using the best match tables available at the Netaffx analysis center (http://www.affymetrix.com). The downloaded data was MAS 5.0 normalized in the R statistical
Figure 1.Overview of the study.
Cancer Genetics
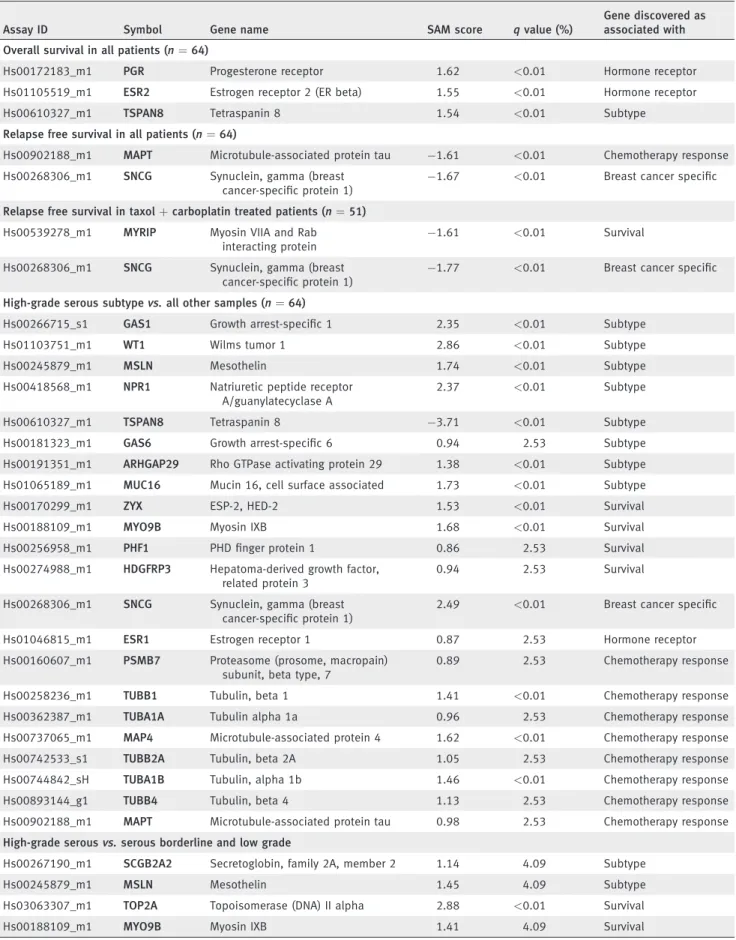
Table 1. Genes capable to predict survival or histology subtype on the RT-PCR results
Assay ID Symbol Gene name SAM score qvalue (%)
Gene discovered as associated with Overall survival in all patients (n¼64)
Hs00172183_m1 PGR Progesterone receptor 1.62 <0.01 Hormone receptor
Hs01105519_m1 ESR2 Estrogen receptor 2 (ER beta) 1.55 <0.01 Hormone receptor
Hs00610327_m1 TSPAN8 Tetraspanin 8 1.54 <0.01 Subtype
Relapse free survival in all patients (n¼64)
Hs00902188_m1 MAPT Microtubule-associated protein tau 1.61 <0.01 Chemotherapy response Hs00268306_m1 SNCG Synuclein, gamma (breast
cancer-specific protein 1)
1.67 <0.01 Breast cancer specific
Relapse free survival in taxolþcarboplatin treated patients (n¼51) Hs00539278_m1 MYRIP Myosin VIIA and Rab
interacting protein
1.61 <0.01 Survival
Hs00268306_m1 SNCG Synuclein, gamma (breast cancer-specific protein 1)
1.77 <0.01 Breast cancer specific
High-grade serous subtypevs.all other samples (n¼64)
Hs00266715_s1 GAS1 Growth arrest-specific 1 2.35 <0.01 Subtype
Hs01103751_m1 WT1 Wilms tumor 1 2.86 <0.01 Subtype
Hs00245879_m1 MSLN Mesothelin 1.74 <0.01 Subtype
Hs00418568_m1 NPR1 Natriuretic peptide receptor A/guanylatecyclase A
2.37 <0.01 Subtype
Hs00610327_m1 TSPAN8 Tetraspanin 8 3.71 <0.01 Subtype
Hs00181323_m1 GAS6 Growth arrest-specific 6 0.94 2.53 Subtype
Hs00191351_m1 ARHGAP29 Rho GTPase activating protein 29 1.38 <0.01 Subtype Hs01065189_m1 MUC16 Mucin 16, cell surface associated 1.73 <0.01 Subtype
Hs00170299_m1 ZYX ESP-2, HED-2 1.53 <0.01 Survival
Hs00188109_m1 MYO9B Myosin IXB 1.68 <0.01 Survival
Hs00256958_m1 PHF1 PHD finger protein 1 0.86 2.53 Survival
Hs00274988_m1 HDGFRP3 Hepatoma-derived growth factor, related protein 3
0.94 2.53 Survival
Hs00268306_m1 SNCG Synuclein, gamma (breast cancer-specific protein 1)
2.49 <0.01 Breast cancer specific
Hs01046815_m1 ESR1 Estrogen receptor 1 0.87 2.53 Hormone receptor
Hs00160607_m1 PSMB7 Proteasome (prosome, macropain) subunit, beta type, 7
0.89 2.53 Chemotherapy response
Hs00258236_m1 TUBB1 Tubulin, beta 1 1.41 <0.01 Chemotherapy response
Hs00362387_m1 TUBA1A Tubulin alpha 1a 0.96 2.53 Chemotherapy response
Hs00737065_m1 MAP4 Microtubule-associated protein 4 1.62 <0.01 Chemotherapy response
Hs00742533_s1 TUBB2A Tubulin, beta 2A 1.05 2.53 Chemotherapy response
Hs00744842_sH TUBA1B Tubulin, alpha 1b 1.46 <0.01 Chemotherapy response
Hs00893144_g1 TUBB4 Tubulin, beta 4 1.13 2.53 Chemotherapy response
Hs00902188_m1 MAPT Microtubule-associated protein tau 0.98 2.53 Chemotherapy response High-grade serousvs.serous borderline and low grade
Hs00267190_m1 SCGB2A2 Secretoglobin, family 2A, member 2 1.14 4.09 Subtype
Hs00245879_m1 MSLN Mesothelin 1.45 4.09 Subtype
Hs03063307_m1 TOP2A Topoisomerase (DNA) II alpha 2.88 <0.01 Survival
Hs00188109_m1 MYO9B Myosin IXB 1.41 4.09 Survival
Cancer Genetics
environment (http://www.R-project.org) using the Bioconduc- tor package Affy (http://www.bioconductor.org). MAS 5.0 applies normalization on an individual chip; it has excellent specificity and good sensitivity. As MAS 5.0 it is the factory- default normalization method, in the future even single microarrays can be added to our table. To eliminate the effects of different factory-default settings for average expres- sion on the GPL96 and GPL570 platforms, a second scaling normalization was performed on the matched gene set to set the average expression for each array to 1,000. Then, gene expression data was imported into BRB-ArrayTools 3.7.0 (developed by Dr. Richard Simon and Amy Peng Lam, http://linus.nci.nih.gov/BRB-ArrayTools.html). Thresholding the intensity at the minimum value was performed if the spot intensity was below the minimum value of 10. If less than 20% of expression data had at least a 1.5-fold change in either direction from gene’s median value or the percent of data missing or filtered out exceeded 50%, then the gene was discarded. All together 21,377 genes passed these filtering cri- teria. Then, gene set expression comparison using LS/KS test were performed to compare different histology subtypes as well as normal and cancerous tissue. In these, the significance threshold was set to 0.01. In the survival gene set analysis, only samples with available survival data were used (n ¼ 199). The complete overview of the applied analytical path- way is presented in Figure 1.
Clinical sample collection
We collected ovarian cancer samples at the 1st Department of Gynecology of the Semmelweis University Budapest
(NOI1) and the National Institute of Cancer (OOI) between 2005 and 2008. Ethical approval for the clinical sample col- lection was granted by an Institutional Ethical Commission.
Samples were snap frozen and stored at80C until ribonu- cleic acid (RNA) isolation.
RNA isolation and quality control
RNA was isolated using the Qiagen RNeasy kit (Qiagen, Hil- den, Germany). Frozen biopsy samples were lysed and ho- mogenized in the mixture of 300 ll GITC-containing lysis buffer and 3 llb-mercaptoethanol by Polytron homogeniza- tor for 30–40 sec. The lysed samples were digested in Pro- teinase K solution at 55C for 10 min. After silica membrane cleaning and DNase I treatment (to absolutely remove genomic DNA), the total RNA was eluted in 50 ll RNase- free water.
Quantity and quality of the isolated RNA was tested by using a Nanodrop1000 system (BCM, Houston, TX) and by gel electrophoresis using an Agilent Bioanalyzer system (Agi- lent Technologies, Santa Clara, CA). RNA (A260) protein (A280) concentrations and sample purity (260/280 ratio) were also measured. Only high quality, intact total RNA was accepted for samples that showed regular 18S and 28S ribo- somal RNA bend pattern on the Bioanalyzer analysis. RNA was kept in a deep freezer at 80C until RT-PCR measurement.
TaqMan RT-PCR measurements
TaqMan real-time PCR was used to measure the expression of 40 selected genes using a Micro Fluidic Card System
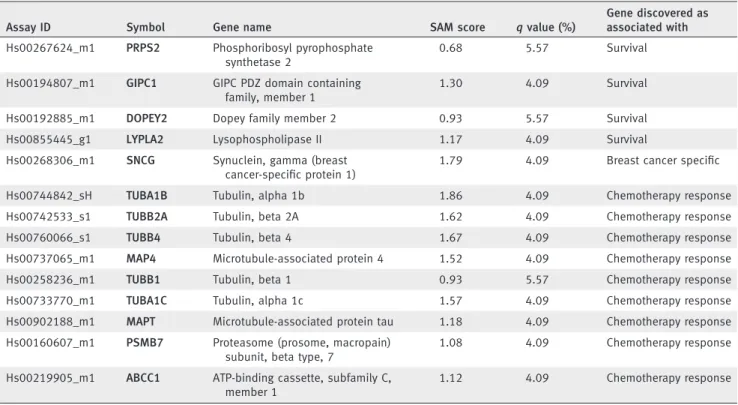
Table 1.Genes capable to predict survival or histology subtype on the RT-PCR results (Continued)
Assay ID Symbol Gene name SAM score qvalue (%)
Gene discovered as associated with Hs00267624_m1 PRPS2 Phosphoribosyl pyrophosphate
synthetase 2
0.68 5.57 Survival
Hs00194807_m1 GIPC1 GIPC PDZ domain containing family, member 1
1.30 4.09 Survival
Hs00192885_m1 DOPEY2 Dopey family member 2 0.93 5.57 Survival
Hs00855445_g1 LYPLA2 Lysophospholipase II 1.17 4.09 Survival
Hs00268306_m1 SNCG Synuclein, gamma (breast cancer-specific protein 1)
1.79 4.09 Breast cancer specific
Hs00744842_sH TUBA1B Tubulin, alpha 1b 1.86 4.09 Chemotherapy response
Hs00742533_s1 TUBB2A Tubulin, beta 2A 1.62 4.09 Chemotherapy response
Hs00760066_s1 TUBB4 Tubulin, beta 4 1.67 4.09 Chemotherapy response
Hs00737065_m1 MAP4 Microtubule-associated protein 4 1.52 4.09 Chemotherapy response
Hs00258236_m1 TUBB1 Tubulin, beta 1 0.93 5.57 Chemotherapy response
Hs00733770_m1 TUBA1C Tubulin, alpha 1c 1.57 4.09 Chemotherapy response
Hs00902188_m1 MAPT Microtubule-associated protein tau 1.18 4.09 Chemotherapy response Hs00160607_m1 PSMB7 Proteasome (prosome, macropain)
subunit, beta type, 7
1.08 4.09 Chemotherapy response
Hs00219905_m1 ABCC1 ATP-binding cassette, subfamily C, member 1
1.12 4.09 Chemotherapy response
Cancer Genetics
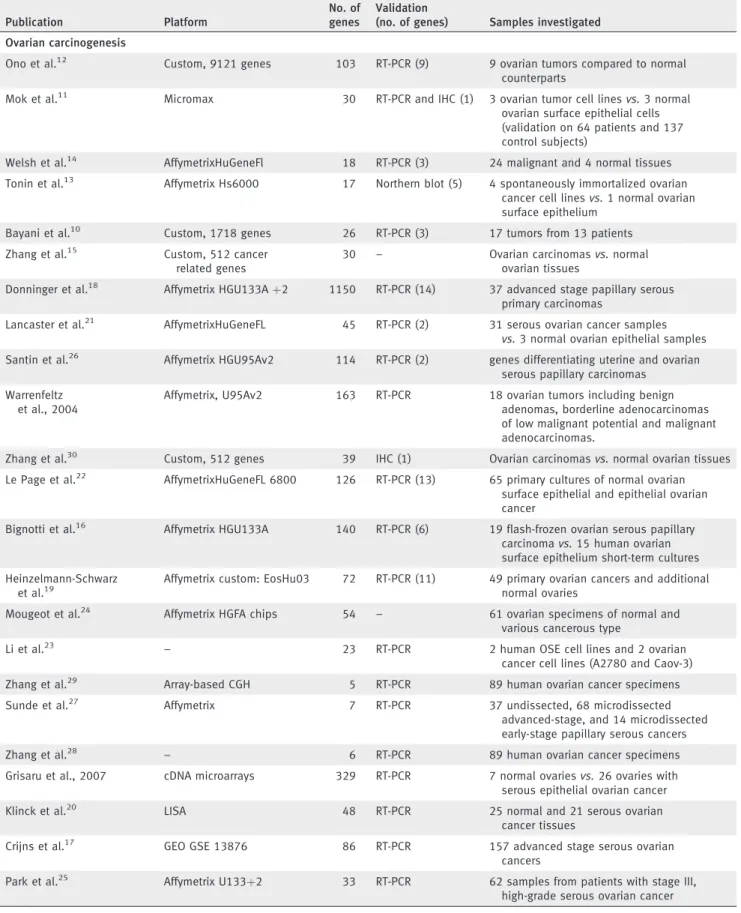
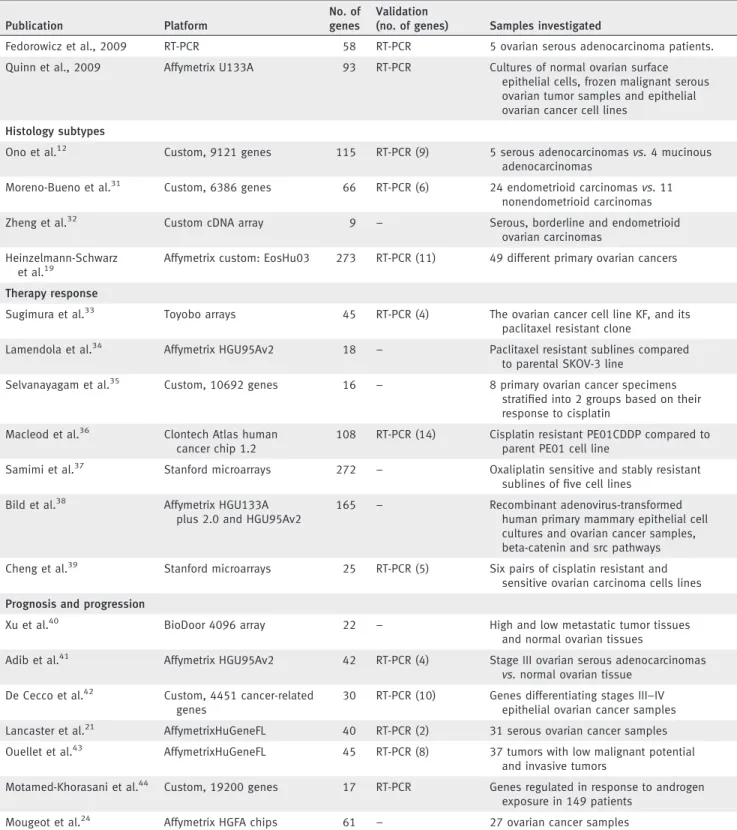
Table 2. Summary of the previously published gene sets (2000 to 2010)
Publication Platform
No. of genes
Validation
(no. of genes) Samples investigated Ovarian carcinogenesis
Ono et al.12 Custom, 9121 genes 103 RT-PCR (9) 9 ovarian tumors compared to normal counterparts
Mok et al.11 Micromax 30 RT-PCR and IHC (1) 3 ovarian tumor cell linesvs.3 normal ovarian surface epithelial cells (validation on 64 patients and 137 control subjects)
Welsh et al.14 AffymetrixHuGeneFl 18 RT-PCR (3) 24 malignant and 4 normal tissues Tonin et al.13 Affymetrix Hs6000 17 Northern blot (5) 4 spontaneously immortalized ovarian
cancer cell linesvs.1 normal ovarian surface epithelium
Bayani et al.10 Custom, 1718 genes 26 RT-PCR (3) 17 tumors from 13 patients Zhang et al.15 Custom, 512 cancer
related genes
30 – Ovarian carcinomasvs.normal
ovarian tissues
Donninger et al.18 Affymetrix HGU133Aþ2 1150 RT-PCR (14) 37 advanced stage papillary serous primary carcinomas
Lancaster et al.21 AffymetrixHuGeneFL 45 RT-PCR (2) 31 serous ovarian cancer samples vs.3 normal ovarian epithelial samples Santin et al.26 Affymetrix HGU95Av2 114 RT-PCR (2) genes differentiating uterine and ovarian
serous papillary carcinomas Warrenfeltz
et al., 2004
Affymetrix, U95Av2 163 RT-PCR 18 ovarian tumors including benign adenomas, borderline adenocarcinomas of low malignant potential and malignant adenocarcinomas.
Zhang et al.30 Custom, 512 genes 39 IHC (1) Ovarian carcinomasvs.normal ovarian tissues Le Page et al.22 AffymetrixHuGeneFL 6800 126 RT-PCR (13) 65 primary cultures of normal ovarian
surface epithelial and epithelial ovarian cancer
Bignotti et al.16 Affymetrix HGU133A 140 RT-PCR (6) 19 flash-frozen ovarian serous papillary carcinomavs.15 human ovarian surface epithelium short-term cultures Heinzelmann-Schwarz
et al.19
Affymetrix custom: EosHu03 72 RT-PCR (11) 49 primary ovarian cancers and additional normal ovaries
Mougeot et al.24 Affymetrix HGFA chips 54 – 61 ovarian specimens of normal and various cancerous type
Li et al.23 – 23 RT-PCR 2 human OSE cell lines and 2 ovarian
cancer cell lines (A2780 and Caov-3)
Zhang et al.29 Array-based CGH 5 RT-PCR 89 human ovarian cancer specimens
Sunde et al.27 Affymetrix 7 RT-PCR 37 undissected, 68 microdissected
advanced-stage, and 14 microdissected early-stage papillary serous cancers
Zhang et al.28 – 6 RT-PCR 89 human ovarian cancer specimens
Grisaru et al., 2007 cDNA microarrays 329 RT-PCR 7 normal ovariesvs.26 ovaries with serous epithelial ovarian cancer
Klinck et al.20 LISA 48 RT-PCR 25 normal and 21 serous ovarian
cancer tissues
Crijns et al.17 GEO GSE 13876 86 RT-PCR 157 advanced stage serous ovarian
cancers
Park et al.25 Affymetrix U133þ2 33 RT-PCR 62 samples from patients with stage III, high-grade serous ovarian cancer
Cancer Genetics
(Applied Biosystems, Foster City, CA). Of the top genes cor- related to survival and related to histology subtypes, those with available taqman probes were selected. Additionally, the genes had to have an average MAS 5.0 expression over 1,000 in at least one class to be included. A set of genes correlated to chemotherapy resistance (tubulins and ABC transporters)
and breast cancer (mammaglobin-A and synuclein gamma), and two housekeeping genes were also added for additional analyses. The list of included genes is presented in Table 1.
The measurements were performed using an ABI PRISMVR 7900HT Sequence Detection System as described in the prod- uct user guide.
Table 2.Summary of the previously published gene sets (2000 to 2010) (Continued)
Publication Platform
No. of genes
Validation
(no. of genes) Samples investigated
Fedorowicz et al., 2009 RT-PCR 58 RT-PCR 5 ovarian serous adenocarcinoma patients.
Quinn et al., 2009 Affymetrix U133A 93 RT-PCR Cultures of normal ovarian surface epithelial cells, frozen malignant serous ovarian tumor samples and epithelial ovarian cancer cell lines
Histology subtypes
Ono et al.12 Custom, 9121 genes 115 RT-PCR (9) 5 serous adenocarcinomasvs.4 mucinous adenocarcinomas
Moreno-Bueno et al.31 Custom, 6386 genes 66 RT-PCR (6) 24 endometrioid carcinomasvs.11 nonendometrioid carcinomas
Zheng et al.32 Custom cDNA array 9 – Serous, borderline and endometrioid
ovarian carcinomas Heinzelmann-Schwarz
et al.19
Affymetrix custom: EosHu03 273 RT-PCR (11) 49 different primary ovarian cancers
Therapy response
Sugimura et al.33 Toyobo arrays 45 RT-PCR (4) The ovarian cancer cell line KF, and its paclitaxel resistant clone
Lamendola et al.34 Affymetrix HGU95Av2 18 – Paclitaxel resistant sublines compared to parental SKOV-3 line
Selvanayagam et al.35 Custom, 10692 genes 16 – 8 primary ovarian cancer specimens stratified into 2 groups based on their response to cisplatin
Macleod et al.36 Clontech Atlas human cancer chip 1.2
108 RT-PCR (14) Cisplatin resistant PE01CDDP compared to parent PE01 cell line
Samimi et al.37 Stanford microarrays 272 – Oxaliplatin sensitive and stably resistant sublines of five cell lines
Bild et al.38 Affymetrix HGU133A plus 2.0 and HGU95Av2
165 – Recombinant adenovirus-transformed
human primary mammary epithelial cell cultures and ovarian cancer samples, beta-catenin and src pathways Cheng et al.39 Stanford microarrays 25 RT-PCR (5) Six pairs of cisplatin resistant and
sensitive ovarian carcinoma cells lines Prognosis and progression
Xu et al.40 BioDoor 4096 array 22 – High and low metastatic tumor tissues
and normal ovarian tissues
Adib et al.41 Affymetrix HGU95Av2 42 RT-PCR (4) Stage III ovarian serous adenocarcinomas vs.normal ovarian tissue
De Cecco et al.42 Custom, 4451 cancer-related genes
30 RT-PCR (10) Genes differentiating stages III–IV epithelial ovarian cancer samples Lancaster et al.21 AffymetrixHuGeneFL 40 RT-PCR (2) 31 serous ovarian cancer samples Ouellet et al.43 AffymetrixHuGeneFL 45 RT-PCR (8) 37 tumors with low malignant potential
and invasive tumors
Motamed-Khorasani et al.44 Custom, 19200 genes 17 RT-PCR Genes regulated in response to androgen exposure in 149 patients
Mougeot et al.24 Affymetrix HGFA chips 61 – 27 ovarian cancer samples
Cancer Genetics
Data analysis of the RT-PCR measurements
For data analysis, the SDS 2.2 software was used. The extracted delta Ct values (which represent the expression normalized to the average expression of the ribosomal 18S and the RPLP0 expression) were grouped according to the clinical characteristics (survival and histology subtypes) into groups. Then, comparison of two classes and survival analysis was performed using Signifi- cance Analysis of Microarrays.46In these, two groups (e.g., high- grade serous carcinomasvs.all other samples; or borderline and low grade serous carcinomas vs. all other serous carcinomas) were compared in one setting. The statistical significance was set to achieve a false discovery rate below 10%. Kaplan-Meier sur- vival plots were generated for genes correlated to survival using WinSTAT 2007 for Microsoft Excel (Robert K. Fitch Software, Germany). Finally, multivariate analysis was performed using WinSTAT to assess whether the genes alone are more powerful than known clinical parameters (stage, grade, histology).
Results
Meta-analysis of microarray data
We downloaded 829 microarrays of ovarian samples, 806 ovarian cancer samples (from datasets GSE9891, GSE14001, GSE2109, GSE6008, GSE14764, GSE3149 and GSE15578) and
23 normal samples (from datasets GSE15578, GSE14001, GSE3526, GSE1133, GSE2361, GSE7307 and GSE6008). The complete normalized database containing the MAS5 expres- sion values and clinical characteristics for all microarrays is available at http://www.kmplot.com/ovar/@ovary_normalized.
txt.
We used the gene lists of 38 previously published ovarian- cancer associated publications in the gene set analysis, these are summarized in Table 2. After mapping of the published gene sets to Affymetrix microarrays, only those having at least 50% of their genes present on Affymetrix platform were retained (n¼ 16). Gene sets were analyzed as being capable to predict the difference between normal and tumorous and between different histology subtypes in independent analyses.
At p< 0.005, eight gene sets were capable of discriminating between tumor and normal tissue and different histology subtypes (see Table 3).
Survival information was published only for two studies (GSE3149 and GSE14764) comprising 199 samples altogether.
None of the previously published gene sets was capable to significantly predict survival in these patients.
The downloaded combined microarray dataset was used as a new training set to identify new genes correlated to
Table 3. Significant gene sets capable to discriminate tumor and normal samples (A), and different histology subtypes (B)
First author; year No. of genes LS permutationpvalue KS permutationpvalue
(A) Discriminate tumor and normal samples
Bignotti et al.16 116 <0.0001 <0.0001
Donninger et al.18 659 <0.0001 <0.0001
Fedorowicz et al., 2009 28 <0.0001 <0.0001
Heinzelmann-Schwarz et al.47 20 <0.0001 0.0006
Warrenfeltz et al., 2004 127 <0.0001 <0.0001
Welsh et al.14 17 <0.0001 <0.0001
Grisaru et al., 2007 68 <0.0001 0.0042
Quinn et al., 2009 71 <0.0001 0.0014
Santin et al.26 4 0.005 0.195
Zhang et al.28 7 0.007 0.071
Klinck et al.20 37 0.009 0.011
Park et al.25 26 0.048 0.234
(B) Discriminate histology subtypes
Bignotti et al.16 116 <0.0001 <0.0001
Donninger et al.18 659 <0.0001 <0.0001
Heinzelmann et al.47 20 <0.0001 0.0007
Welsh et al.14 17 <0.0001 0.0009
Quinn et al., 2009 71 <0.0001 0.0023
Warrenfeltz et al., 2004 127 0.0001 <0.0001
Santin et al.26 4 0.0009 0.0099
Mougeot et al.24 53 0.0021 0.0007
Fedorowicz et al., 2009 28 0.037 0.383
The analyses were made using GEO datasets GSE1133, GSE2361, GSE2109, GSE3149, GSE3526, GSE6008, GSE7307, GSE9891, GSE14001, GSE14764 and GSE15578. Bold values indicatep<0.005.
Cancer Genetics
histology subtypes and survival. The top significant discrimi- native genes are listed in Supporting Information Table 1 and Supporting Information Table 2.
Clinical sample collection
Altogether 64 ovarian cancer samples were collected from patients aged 60611 years. The median relapse-free survival was 24.5 months with 31 relapses and the median overall survival was 29 months with 23 deaths. Forty-four of the patients had high-grade serous, three low-grade serous tumors and six patients had serous borderline tumors. Four of the patients had a secondary breast cancer. The detailed clinical characteristics for each of these patients are listed in Supporting Information Table 3.
TaqMan RT-PCR measurements
As our goal was to use microarray data to establish consen- sus discriminative genes, we included the top meta-analysis- identified genes in the TaqMan analysis. Besides significant
genes, we also selected a set of literature-based genes associ- ated with hormone therapy and chemotherapy response.
The expression of the selected genes was measured in three settings: genes associated with survival, with histology subtypes and with breast cancer pathogenesis were assessed in independent analyses. Due to the low number of samples in other than the high-grade serous histology subtype, only the high-grade serous samples were compared to a pool of all other samples. The discriminative powers of the genes are listed in Table 1. Of the clinical variables, only stage was associated with survival (p¼0.02).
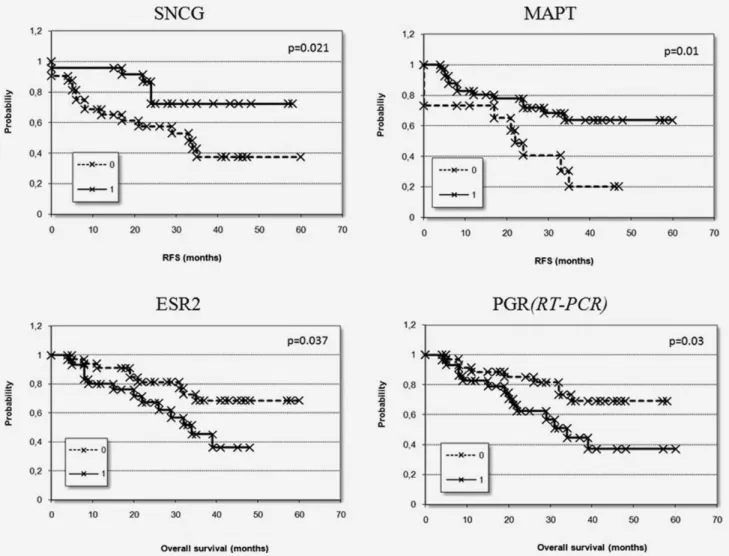
Genes associated with survival were used to construct Kaplan-Meier survival plots. In these, samples were divided based on comparison to the average expression of the genes across the entire dataset; samples having lower than average expression (0) and samples having higher expression (1) were defined as two separate groups. The analyses were performed for both relapse-free survival and overall survival. The Kaplan-Meier plots based on the top two genes are shown in
Figure 2.Discriminating power of the best genes measured by RT-PCR in 64 patients. Kaplan-Meier survival plots show relapse free survival (RFS) grouped by SNCG and MAPT and overall survival grouped by ESR2 and PGR according to the average expression of the selected genes (0: expression below average, 1: expression above average).
Cancer Genetics
Figure 2. Finally, the genes ESR2 and PGR were also investi- gated in the microarray datasets and both were significantly associated with survival (p ¼ 0.007 for ESR2 and p ¼ 0.03 for PGR).
Discussion
Current molecular profiling data of ovarian cancer are al- ready providing new insights into the genesis of ovarian can- cer. To overcome limitations of previous studies, we gathered several datasets from Gene Expression Omnibus to perform a true meta-analysis of ovarian-cancer signatures. We assessed previously published datasets related to ovarian carcinogene- sis, histology subtypes and survival. We also established new predictors for the discrimination of histology subtypes and for prediction of prognosis. The results were validated using RT-PCR in 64 ovarian cancer patients.
Although our study was designed to identify ovarian can- cer-associated gene sets that are clinically relevant, the analy- sis of available transcriptomic studies dealing with ovarian cancer demonstrated merely a low efficiency. In fact, only eight of the 16 published gene sets analyzed in our study were capable to deliver significant discriminative power, and none of the gene sets was capable to predict survival. The most likely explanation for this lack of reproducibility is the use of different technology platforms for generating the gene expression profiles. However, several other factors can con- tribute the clinical ovarian carcinoma samples included in the various studies did not exhibit identical clinico-pathologi- cal parameters, different methodologies were used for evalu- ating the primary data and many studies were based on ex- perimental results obtained in in vitro studies. The fundamental differences in these factors can explain the inef- fective confirmation by different studies. Interestingly, studies capable to discriminate normal and cancerous ovaries were also capable to discriminate histology subtypes.
Genomic studies have demonstrated that mucinous adeno- carcinomas are similar to borderline tumors and to benign cystadenomas.47,48Additionally, mutations inK-RAS are spe- cific for borderline tumors, low-grade tumors and mucinous
adenocarcinomas.49 These results lead to the speculations of malignant transformation following a sequence of adenoma to borderline tumor to invasive adenocarcinoma47,48 more frequently than to high-grade serous carcinomas. We have investigated a set of top genes using RT-PCR in our patients and were capable to validate almost all genes hypothesized as being related to histology subtypes by either microarray-anal- ysis or literature search. These results support the hypothesis of distinct molecular characteristics of the different histology subtypes described in earlier studies.
In our patients, only three genes (ESR2, PGR and TSPAN8) were correlated to overall survival and two genes (MAPT and SNCG) to relapse-free survival. A future study with signifi- cantly more patients (preferably over 1,000 samples) could deliver a much more robust estimation of predictive power.
Previously, expression of the estrogen receptor (ER) was found more frequently in low-malignant potential and low- grade ovarian cancers, suggesting that hormonal treatment might be effective for controlling these ovarian cancers.50 Although our meta-analysis of microarray datasets did not identify ER as a top candidate gene, we have found differen- tial expression of ER in high-grade serous carcinomas as well as a correlation to survival in our ovarian cancer patients.
At the moment, neither the prognostic and predictive pa- rameters as described are far from precise, nor are the cur- rent chemotherapy regimens highly effective, which empha- sizes the need to identify new biomarkers. Our results deliver validation as a true meta-analysis for several previously pub- lished gene sets and individual genes. Additionally, we were able to confirm the power to discriminate histology subtypes in a clinical cohort for a set of RT-PCR measured genes.
New analyses in the future, like RNA-seq, will enable to directly link gene expression, genotype and phenotype, thereby making a more complex meta-analysis possible at different stages of biological processes.
Acknowledgements
The authors thank Peter Lakatos MD for his help in the preparation of the article.
References
1. Shih IeM, Kurman RJ. Ovarian tumorigenesis: a proposed model based on morphological and molecular
genetic analysis.Am J Pathol2004;164:1511–8.
2. Bonome T, Lee JY, Park DC, Radonovich M, Pise-Masison C, Brady J, Gardner GJ, Hao K, Wong WH, Barrett JC, Lu KH, Sood AK, et al.
Expression profiling of serous low malignant potential, low-grade, and high-grade tumors of the ovary.Cancer Res2005;65:10602–12.
3. Zorn KK, Bonome T, Gangi L, Chandramouli GV, Awtrey CS, Gardner GJ, Barrett JC, Boyd J, Birrer MJ. Gene expression profiles of serous, endometrioid, and clear cell subtypes of ovarian and endometrial cancer.Clin Cancer Res2005;11:
6422–30.
4. Shih Ie M, Kurman RJ. Molecular pathogenesis of ovarian borderline tumors: new insights and old challenges.Clin Cancer Res2005;11:7273–9.
5. Marquez RT, Baggerly KA, Patterson AP, Liu J, Broaddus R, Frumovitz M, Atkinson EN, Smith DI, Hartmann L, Fishman D, Berchuck A, Whitaker R, et al. Patterns of gene expression in different histotypes of epithelial ovarian cancer correlate with those in normal fallopian tube, endometrium, and colon.Clin Cancer Res2005;
11:6116–26.
6. Tothill RW, Tinker AV, George J, Brown R, Fox SB, Lade S, Johnson DS, Trivett MK,
Etemadmoghadam D, Locandro B, Traficante N, Fereday S, et al. Novel molecular subtypes of serous and endometrioid ovarian cancer linked to
clinical outcome.Clin Cancer Res2008;14:
5198–208.
7. Schwartz DR, Kardia SL, Shedden KA, Kuick R, Michailidis G, Taylor JM, Misek DE, Wu R, Zhai Y, Darrah DM, Reed H, Ellenson LH, et al. Gene expression in ovarian cancer reflects both morphology and biological behavior, distinguishing clear cell from other poor- prognosis ovarian carcinomas.Cancer Res2002;
62:4722–9.
8. Landen CN, Jr., Birrer MJ, Sood AK. Early events in the pathogenesis of epithelial ovarian cancer.J Clin Oncol2008;26:995–1005.
9. Bamias A, Psaltopoulou T, Sotiropoulou M, Haidopoulos D, Lianos E, Bournakis E, Papadimitriou C, Rodolakis A, Vlahos G,
Cancer Genetics
Dimopoulos MA. Mucinous but not clear cell histology is associated with inferior survival in patients with advanced stage ovarian carcinoma treated with platinum-paclitaxel chemotherapy.
Cancer2010;116:1462–8.
10. Bayani J, Brenton JD, Macgregor PF, Beheshti B, Albert M, Nallainathan D, Karaskova J, Rosen B, Murphy J, Laframboise S, Zanke B, Squire JA.
Parallel analysis of sporadic primary ovarian carcinomas by spectral karyotyping, comparative genomic hybridization, and expression microarrays.Cancer Res2002;62:3466–76.
11. Mok SC, Chao J, Skates S, Wong K, Yiu GK, Muto MG, Berkowitz RS, Cramer DW. Prostasin, a potential serum marker for ovarian cancer:
identification through microarray technology.J Natl Cancer Inst2001;93:1458–64.
12. Ono K, Tanaka T, Tsunoda T, Kitahara O, Kihara C, Okamoto A, Ochiai K, Takagi T, Nakamura Y. Identification by cDNA microarray of genes involved in ovarian carcinogenesis.
Cancer Res2000;60:5007–11.
13. Tonin PN, Hudson TJ, Rodier F, Bossolasco M, Lee PD, Novak J, Manderson EN, Provencher D, Mes-Masson AM. Microarray analysis of gene expression mirrors the biology of an ovarian cancer model.Oncogene2001;20:6617–26.
14. Welsh JB, Zarrinkar PP, Sapinoso LM, Kern SG, Behling CA, Monk BJ, Lockhart DJ, Burger RA, Hampton GM. Analysis of gene expression profiles in normal and neoplastic ovarian tissue samples identifies candidate molecular markers of epithelial ovarian cancer.Proc Natl Acad Sci USA 2001;98:1176–81.
15. Zhang XY, Li XP, Lai J, Feng J. [Screening for ovarian cancer-associated genes with cDNA microarrays].Ai Zheng2003;22:943–7.
16. Bignotti E, Tassi RA, Calza S, Ravaggi A, Romani C, Rossi E, Falchetti M, Odicino FE, Pecorelli S, Santin AD. Differential gene expression profiles between tumor biopsies and short-term primary cultures of ovarian serous carcinomas:
identification of novel molecular biomarkers for early diagnosis and therapy.Gynecol Oncol2006;
103:405–16.
17. Crijns AP, Fehrmann RS, de Jong S, Gerbens F, Meersma GJ, Klip HG, Hollema H, Hofstra RM, te Meerman GJ, de Vries EG, van der Zee AG. Survival-related profile, pathways, and transcription factors in ovarian cancer.PLoS Med2009;6:e24.
18. Donninger H, Bonome T, Radonovich M, Pise- Masison CA, Brady J, Shih JH, Barrett JC, Birrer MJ. Whole genome expression profiling of advance stage papillary serous ovarian cancer reveals activated pathways.Oncogene2004;23:
8065–77.
19. Heinzelmann-Schwarz VA, Gardiner-Garden M, Henshall SM, Scurry J, Scolyer RA, Davies MJ, Heinzelmann M, Kalish LH, Bali A, Kench JG, Edwards LS, Vanden Bergh PM, et al.
Overexpression of the cell adhesion molecules DDR1, Claudin 3, and Ep-CAM in metaplastic ovarian epithelium and ovarian cancer.Clin Cancer Res2004;10:4427–36.
20. Klinck R, Bramard A, Inkel L, Dufresne-Martin G, Gervais-Bird J, Madden R, Paquet ER, Koh C, Venables JP, Prinos P, Jilaveanu-Pelmus M, Wellinger R, et al. Multiple alternative splicing markers for ovarian cancer.Cancer Res2008;68:
657–63.
21. Lancaster JM, Dressman HK, Whitaker RS, Havrilesky L, Gray J, Marks JR, Nevins JR, Berchuck A. Gene expression patterns that characterize advanced stage serous ovarian cancers.J Soc Gynecol Investig2004;
11:51–9.
22. Le Page C, Ouellet V, Madore J, Ren F, Hudson TJ, Tonin PN, Provencher DM, Mes-Masson AM. Gene expression profiling of primary cultures of ovarian epithelial cells identifies novel molecular classifiers of ovarian cancer.Br J Cancer2006;94:436–45.
23. Li J, Olson LM, Zhang Z, Li L, Bidder M, Nguyen L, Pfeifer J, Rader JS. Differential display identifies overexpression of the USP36 gene, encoding a deubiquitinating enzyme, in ovarian cancer.Int J Med Sci2008;5:133–42.
24. Mougeot JL, Bahrani-Mostafavi Z, Vachris JC, McKinney KQ, Gurlov S, Zhang J, Naumann RW, Higgins RV, Hall JB. Gene expression profiling of ovarian tissues for determination of molecular pathways reflective of tumorigenesis.J Mol Biol2006;358:310–29.
25. Park DC, Yeo SG, Wilson MR, Yerbury JJ, Kwong J, Welch WR, Choi YK, Birrer MJ, Mok SC, Wong KK. Clusterin interacts with paclitaxel and confer paclitaxel resistance in ovarian cancer.
Neoplasia2008;10:964–72.
26. Santin AD, Zhan F, Bellone S, Palmieri M, Cane S, Gokden M, Roman JJ, O’Brien TJ, Tian E, Cannon MJ, Shaughnessy J, Jr, Pecorelli S.
Discrimination between uterine serous papillary carcinomas and ovarian serous papillary tumours by gene expression profiling.Br J Cancer2004;90:
1814–24.
27. Sunde JS, Donninger H, Wu K, Johnson ME, Pestell RG, Rose GS, Mok SC, Brady J, Bonome T, Birrer MJ. Expression profiling identifies altered expression of genes that contribute to the inhibition of transforming growth factor-beta signaling in ovarian cancer.Cancer Res2006;66:
8404–12.
28. Zhang L, Huang J, Yang N, Greshock J, Liang S, Hasegawa K, Giannakakis A, Poulos N, O’Brien- Jenkins A, Katsaros D, Butzow R, Weber BL, et al. Integrative genomic analysis of phosphatidylinositol 3’-kinase family identifies PIK3R3 as a potential therapeutic target in epithelial ovarian cancer.Clin Cancer Res2007;
13:5314–21.
29. Zhang L, Huang J, Yang N, Liang S, Barchetti A, Giannakakis A, Cadungog MG, O’Brien-Jenkins A, Massobrio M, Roby KF, Katsaros D, Gimotty P, et al. Integrative genomic analysis of protein kinase C (PKC) family identifies PKCiota as a biomarker and potential oncogene in ovarian carcinoma.Cancer Res2006;66:4627–35.
30. Zhang X, Feng J, Cheng Y, Yao Y, Ye X, Fu T, Cheng H. Characterization of differentially
expressed genes in ovarian cancer by cDNA microarrays.Int J Gynecol Cancer2005;15:50–7.
31. Moreno-Bueno G, Sanchez-Estevez C, Cassia R, Rodriguez-Perales S, Diaz-Uriarte R, Dominguez O, Hardisson D, Andujar M, Prat J, Matias-Guiu X, Cigudosa JC, Palacios J. Differential gene expression profile in endometrioid and nonendometrioid endometrial carcinoma: STK15 is frequently overexpressed and amplified in nonendometrioid carcinomas.Cancer Res2003;
63:5697–702.
32. Zheng M, Simon R, Kononen J, Sauter G, Mihatsch MJ, Moch H. [Analysis of gene expression profiles among 3 epithelial ovarian tumor subtypes using cDNA and tissue microarrays].Ai Zheng2004;23:771–6.
33. Sugimura M, Sagae S, Ishioka S, Nishioka Y, Tsukada K, Kudo R. Mechanisms of paclitaxel- induced apoptosis in an ovarian cancer cell line and its paclitaxel-resistant clone.Oncology2004;
66:53–61.
34. Lamendola DE, Duan Z, Yusuf RZ, Seiden MV.
Molecular description of evolving paclitaxel resistance in the SKOV-3 human ovarian carcinoma cell line.Cancer Res2003;63:2200–5.
35. Selvanayagam ZE, Cheung TH, Wei N, Vittal R, Lo KW, Yeo W, Kita T, Ravatn R, Chung TK, Wong YF, Chin KV. Prediction of
chemotherapeutic response in ovarian cancer with DNA microarray expression profiling.
Cancer Genet Cytogenet2004;154:63–6.
36. Macleod K, Mullen P, Sewell J, Rabiasz G, Lawrie S, Miller E, Smyth JF, Langdon SP. Altered ErbB receptor signaling and gene expression in cisplatin-resistant ovarian cancer.Cancer Res 2005;65:6789–800.
37. Samimi G, Manorek G, Castel R, Breaux JK, Cheng TC, Berry CC, Los G, Howell SB. cDNA microarray-based identification of genes and pathways associated with oxaliplatin resistance.
Cancer Chemother Pharmacol2005;55:1–11.
38. Bild AH, Yao G, Chang JT, Wang Q, Potti A, Chasse D, Joshi MB, Harpole D, Lancaster JM, Berchuck A, Olson JA, Jr, Marks JR, et al.
Oncogenic pathway signatures in human cancers as a guide to targeted therapies.Nature2006;439:
353–7.
39. Cheng TC, Manorek G, Samimi G, Lin X, Berry CC, Howell SB. Identification of genes whose expression is associated with cisplatin resistance in human ovarian carcinoma cells.Cancer Chemother Pharmacol2006;58:384–95.
40. Xu S, Mou H, Lu G, Zhu C, Yang Z, Gao Y, Lou H, Liu X, Cheng Y, Yang W. Gene expression profile differences in high and low metastatic human ovarian cancer cell lines by gene chip.
Chin Med J (Engl)2002;115:36–41.
41. Adib TR, Henderson S, Perrett C, Hewitt D, Bourmpoulia D, Ledermann J, Boshoff C.
Predicting biomarkers for ovarian cancer using gene-expression microarrays.Br J Cancer2004;90:
686–92.
42. De Cecco L, Marchionni L, Gariboldi M, Reid JF, Lagonigro MS, Caramuta S, Ferrario C, Bussani E, Mezzanzanica D, Turatti F, Delia D, Daidone
Cancer Genetics
MG, et al. Gene expression profiling of advanced ovarian cancer: characterization of a molecular signature involving fibroblast growth factor 2.
Oncogene2004;23:8171–83.
43. Ouellet V, Provencher DM, Maugard CM, Le Page C, Ren F, Lussier C, Novak J, Ge B, Hudson TJ, Tonin PN, Mes-Masson AM. Discrimination between serous low malignant potential and invasive epithelial ovarian tumors using molecular profiling.Oncogene2005;24:4672–87.
44. Motamed-Khorasani A, Jurisica I, Letarte M, Shaw PA, Parkes RK, Zhang X, Evangelou A, Rosen B, Murphy KJ, Brown TJ. Differentially androgen-modulated genes in ovarian epithelial cells from BRCA mutation carriers and control patients predict ovarian cancer survival and disease progression.Oncogene2007;26:198–214.
45. Gyorffy B, Dietel M, Fekete T, Lage H. A snapshot of microarray-generated gene expression signatures associated with ovarian carcinoma.Int J Gynecol Cancer2008;18:1215–33.
46. Tusher VG, Tibshirani R, Chu G. Significance analysis of microarrays applied to the ionizing
radiation response.Proc Natl Acad Sci USA2001;
98:5116–21.
47. Heinzelmann-Schwarz VA, Gardiner-Garden M, Henshall SM, Scurry JP, Scolyer RA, Smith AN, Bali A, Vanden Bergh P, Baron-Hay S, Scott C, Fink D, Hacker NF, et al. A distinct molecular profile associated with mucinous epithelial ovarian cancer.Br J Cancer2006;94:904–13.
48. Wamunyokoli FW, Bonome T, Lee JY, Feltmate CM, Welch WR, Radonovich M, Pise-Masison C, Brady J, Hao K, Berkowitz RS, Mok S, Birrer MJ.
Expression profiling of mucinous tumors of the ovary identifies genes of clinicopathologic importance.Clin Cancer Res2006;12:690–700.
49. Suzuki M, Saito S, Saga Y, Ohwada M, Sato I.
Mutation of K-RAS protooncogene and loss of heterozygosity on 6q27 in serous and mucinous ovarian carcinomas.Cancer Genet Cytogenet 2000;118:132–5.
50. Abu-Jawdeh GM, Jacobs TW, Niloff J, Cannistra SA. Estrogen receptor expression is a common feature of ovarian borderline tumors.Gynecol Oncol1996;60:301–7.
51. Warrenfeltz S, Pavlik S, Datta S, Kraemer ET, Benigno B, McDonald JF. Gene expression profiling of epithelial ovarian tumours correlated with malignant potential.Mol Cancer2004;3:27.
52. Grisaru D, Hauspy J, Prasad M, Albert M, Murphy KJ, Covens A, Macgregor PF, Rosen B.
Microarray expression identification of differentially expressed genes in serous epithelial ovarian cancer compared with bulk normal ovarian tissue and ovarian surface scrapings.
Oncol Rep2007;18:1347–1356.
53. Fedorowicz G, Guerrero S, Wu TD, Modrusan Z.
Microarray analysis of RNA extracted from formalin-fixed, paraffin-embedded and matched fresh-frozen ovarian adenocarcinomas.BMC Med Genomics2009;2:23.
54. Quinn MC, Wilson DJ, Young F, Dempsey AA, Arcand SL, Birch AH, Wojnarowicz PM, Provencher D, Mes-Masson AM, Englert D, Tonin PN. The chemiluminescence based Ziplex automated workstation focus array reproduces ovarian cancer Affymetrix GeneChip expression profiles.J Transl Med2009;7:55.