*For correspondence:
dstupack@ucsd.edu (DGS);
dschlaepfer@ucsd.edu (DDS)
†These authors contributed equally to this work Present address:‡INSERM UMR1037, Centre de Recherches en Cance´rologie de Toulouse, Toulouse, France
Competing interest:See page 28
Funding:See page 28 Received:03 April 2019 Accepted:01 August 2019 Published:03 September 2019 Reviewing editor: Margaret C Frame, University of Edinburgh, United Kingdom
Copyright Diaz Osterman et al. This article is distributed under the terms of theCreative Commons Attribution License, which permits unrestricted use and redistribution provided that the original author and source are credited.
FAK activity sustains intrinsic and
acquired ovarian cancer resistance to platinum chemotherapy
Carlos J Diaz Osterman1†, Duygu Ozmadenci1†, Elizabeth G Kleinschmidt1†, Kristin N Taylor1†, Allison M Barrie1†, Shulin Jiang1†, Lisa M Bean1†,
Florian J Sulzmaier1†, Christine Jean1‡, Isabelle Tancioni1, Kristen Anderson1, Sean Uryu1, Edward A Cordasco1, Jian Li2, Xiao Lei Chen2, Guo Fu2,
Marjaana Ojalill3, Pekka Rappu3, Jyrki Heino3, Adam M Mark4, Guorong Xu4, Kathleen M Fisch4, Vihren N Kolev5, David T Weaver5, Jonathan A Pachter5, Bala´zs Gyo˝rffy6,7, Michael T McHale1, Denise C Connolly8, Alfredo Molinolo9, Dwayne G Stupack1*, David D Schlaepfer1*
1Department of Obstetrics, Gynecology and Reproductive Sciences, Moores UCSD Cancer Center, La Jolla, United States;2State Key Laboratory of Cellular Stress Biology, Innovation Center for Cellular Signaling Network, School of Life Sciences, Xiamen University, Xiamen, China;3Department of Biochemistry, University of Turku, Turku, Finland;4Department of Medicine, UCSD Center for Computational Biology & Bioinformatics, La Jolla, United States;5Verastem Oncology, Needham, United States;6Institute of Enzymology, Hungarian Academy of Sciences, Budapest, Hungary;72nd Department of Pediatrics, Semmelweis University, Budapest,
Hungary;8Fox Chase Cancer Center, Philadelphia, United States;9Department of Pathology, Moores UCSD Cancer Center, La Jolla, United States
Abstract
Gene copy number alterations, tumor cell stemness, and the development of platinum chemotherapy resistance contribute to high-grade serous ovarian cancer (HGSOC) recurrence.Stem phenotypes involving Wnt-b-catenin, aldehyde dehydrogenase activities, intrinsic platinum resistance, and tumorsphere formation are here associated with spontaneous gains inKras,Myc andFAK(KMF) genes in a new aggressive murine model of ovarian cancer. Adhesion-independent FAK signaling sustained KMF and human tumorsphere proliferation as well as resistance to cisplatin cytotoxicity. Platinum-resistant tumorspheres can acquire a dependence on FAK for growth.
Accordingly, increased FAK tyrosine phosphorylation was observed within HGSOC patient tumors surviving neo-adjuvant chemotherapy. Combining a FAK inhibitor with platinum overcame chemoresistance and triggered cell apoptosis. FAK transcriptomic analyses across knockout and reconstituted cells identified 135 targets, elevated in HGSOC, that were regulated by FAK activity andb-catenin including Myc, pluripotency and DNA repair genes. These studies reveal an
oncogenic FAK signaling role supporting chemoresistance.
DOI: https://doi.org/10.7554/eLife.47327.001
Introduction
Ovarian carcinoma is the most lethal gynecologic malignancy in the United States (Siegel et al., 2018). High-grade serous ovarian carcinoma (HGSOC), the most prevalent histologic tumor subtype (Matulonis et al., 2016), is treated with a combination of cytoreductive surgery and carboplatin (DNA damage generation) and paclitaxel (microtubule-stabilizing drug) chemotherapy. Cure is highly
RESEARCH ARTICLE
dependent on elimination of microscopic disease (Narod, 2016). Approximately 80% of patients with HGSOC exhibit serial disease recurrence, develop resistance to platinum chemotherapy, and die (Bowtell et al., 2015). Although platinum chemotherapy is effective at creating DNA damage and triggering cell apoptosis, subpopulations of tumor cells can survive this stress (Pogge von Strandmann et al., 2017).
Tumor sequencing has revealed complexity and heterogeneity among HGSOC (Cancer Genome Atlas Research Network, 2011). DNA breakage and regions of chromosomal gain or loss are com- mon (Patch et al., 2015). Gains at 8q24 occur in most HGSOC tumors and encompass the MYC oncogene at 8q24.21 (Gorringe et al., 2010). Although MYC expression is frequently high in HGSOC, the clinical significance remains unclear. MYC supports pluripotent stem cell generation and contributes to chemoresistance (Fagnocchi and Zippo, 2017; Kumari et al., 2017;Li et al., 2019).
Myc protein expression is regulated by Wnt/b-catenin signaling, which is both essential for embry- onic development and activated in many tumors (Shang et al., 2017). Wnt and Myc fall within the 10 most prevalent signaling pathways in cancer (Sanchez-Vega et al., 2018). Wnt signaling is tightly regulated by the stability, subcellular localization, and transcriptional activity ofb-catenin, which sup- ports cancer stem cell (CSC) survival and chemoresistance (Condello et al., 2015; Nagaraj et al., 2015). Platinum can, paradoxically, also select for ovarian cancer ‘stemness’ through undefined mechanisms (Wiechert et al., 2016). Increased aldehyde dehydrogenase (ALDH) activity, arising from elevated expression of a family of cellular detoxifying enzymes, is one hallmark of ovarian CSCs (Raha et al., 2014;Silva et al., 2011). Culturing cells as tumorspheres in vitro increases chemother- apy resistance, ALDH expression, cell de-differentiation and stemness (Shah and Landen, 2014;
eLife digest
Ovarian cancer is one of the deadliest types of cancer in women. There are two main reasons for the aggressiveness of this cancer. First, ovarian cancer cells can spread to other parts of a woman’s body before she has been diagnosed, where the cells grow as tiny clumps or spheres of tumor cells, also called tumorspheres. Second, in the majority of patients, some ovarian cancer cells will develop resistance to the chemotherapy used. It is not clear exactly how these tumor cells become resistant to therapy. One way in which cells could do this is by gaining extra copies of genes that remove toxic substances or repair DNA, which help them withstand the therapy.Here, Osterman, Ozmadenci, Keinschmidt, Taylor, Barrie, Jiang, Bean, Sulzmaier et al. set up a new experimental method to study how some ovarian cancer cells resist chemotherapy. Comparing ovarian cancer cells from mice at early and late stages of the disease showed that the later-stage, more aggressive cells had more genetic changes. One of these changes affected the gene for a protein called FAK, which was found to have more copies than normal. The FAK protein is an enzyme that helps cancer cells move around. In cells from mice with late-stage cancer, FAK was over-active and present at high levels. When these cells grew as tumorspheres, the tumors were more resistant to chemotherapy than their early-stage counterparts. In patients who have received chemotherapy, surviving tumor cells also exhibit high levels of FAK activity.
Human ovarian cancer cells that are resistant to chemotherapy can be grown into tumors in mice, where they retain their resistance to chemotherapy. However, if chemotherapy is combined with a drug that targets the FAK enzyme, the tumors shrink. This experiment highlights a possible weak spot of these tumor cells. To understand how FAK makes ovarian cancer cells resistant to
chemotherapy, Osterman et al. deleted the gene for FAK from the cells and then looked at how this changed the levels of activation of different genes. They found that, in addition to its effects on cell movement, FAK also activated a group of genes that increase resistance to chemotherapy and repair damaged DNA.
This better understanding of how ovarian cancer cells resist chemotherapy could lead to new therapies. In particular, there is now a clinical trial for women with chemo-resistant ovarian cancer in which standard chemotherapy is combined with an inhibitor of the FAK protein.
DOI: https://doi.org/10.7554/eLife.47327.002
Malta et al., 2018). Notably, HGSOC dissemination involves tumorsphere growth and survival within ascites (Pogge von Strandmann et al., 2017).
ThePTK2 gene at 8q24.3, encoding focal adhesion kinase (FAK), is frequently amplified in breast, uterine, cervical, and ovarian tumors (Kaveh et al., 2016). FAK is a cytosolic tyrosine kinase canoni- cally activated by matrix and integrin receptors controlling cell motility (Mitra et al., 2005). Auto- phosphorylation at tyrosine 397 (pY397) is a hallmark of FAK activity (Kleinschmidt and Schlaepfer, 2017). HGSOC tumors withPTK2gains exhibit elevated FAK expression and FAK Y397 phosphoryla- tion (Cancer Genome Atlas Research Network, 2011; Zhang et al., 2016). Metastatic HGSOC tumor micro-environments are enriched with matrix proteins that are FAK activators (Pearce et al., 2018). FAK knockdown and FAK inhibitor studies support an important role for FAK in promoting invasive tumor growth (Ward et al., 2013;Tancioni et al., 2014), yet the targets downstream of FAK are varied and may be tumor or stroma context-dependent (Sulzmaier et al., 2014;
Haemmerle et al., 2016). Interestingly, phenotypes associated with FAK knockout can be distinct from FAK inhibition, since kinase-inactive FAK retains important scaffolding roles (Lim et al., 2008).
Several ATP-competitive FAK inhibitors have been developed. Acceptable Phase I safety profiles in patients with advanced solid tumors (Jones et al., 2015; Soria et al., 2016;Hirt et al., 2018) have enabled current Phase II combinatorial clinical trials with FAK inhibitors in pancreatic, mesothe- lioma, and non-small cell lung carcinoma (NCT02758587 and NCT02546531). In ovarian and prostate carcinoma preclinical models, FAK inhibition (VS-6063, defactinib) enhanced taxane-mediated tumor apoptosis (Kang et al., 2013;Lin et al., 2018). While inhibitors of FAK and Myc exhibit combinato- rial activity in promoting HGSOC cell apoptosis in vitro (Xu et al., 2017), it remains uncertain whether gains in 8q24 encompassingPTK2are associated with specific HGSOC cell phenotypes or responses to therapy, as determinants of FAK pathway dependence in tumors remain unknown.
Herein, we molecularly characterize a new murine model of ovarian cancer that displays spontane- ous gains in theKras,Myc, and FAK genes among other striking similarities to HGSOC phenotypes.
By using a combination of genetic FAK knockout and rescue, pharmacological inhibition, sequencing and bioinformatics, we identify a non-canonical FAK activity-dependent linkage tob-catenin leading to differential mRNA target expression of Myc and other targets supporting pluripotency and DNA repair. Our studies linking intrinsic FAK activity to platinum resistance support the combinatorial testing of FAK inhibitors for recurrent ovarian cancer.
Results
A new in vivo evolved murine epithelial ovarian cancer model
HGSOC is characterized by p53 inactivation and genomic copy number alterations (CNAs), though no preclinical models exist to study cell phenotypes associated with ovarian tumor CNAs. Murine ID8 cells, are spontaneously-immortalized clonal ovarian epithelial cells that form slow-growing tumors in C57Bl/6 mice (Roby et al., 2000). ID8 cells do not contain common oncogenic mutations and express wild type p53. Targeted p53 inactivation promotes ID8 tumor growth and sensitivity to platinum chemotherapy (Walton et al., 2016; Walton et al., 2017). Passage of ID8 cells through C57Bl/6 mice can enhance ID8 tumorigenic potential via undefined mechanisms (Clark et al., 2016;
Mo et al., 2015;Ward et al., 2013).
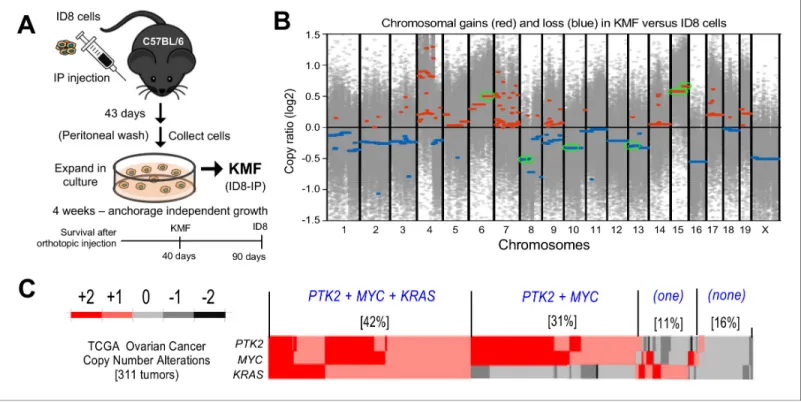
We previously isolated aggressive ID8-IP cells, lethal in mice within 40 days (Ward et al., 2013), via early recovery of ascites-associated cells and anchorage-independent expansion ex vivo (Figure 1A). Total exome sequencing (90% of exons sequenced at 100X) of ID8 and ID8-IP cells revealed 19619 shared, 29373 ID8 unique, and 11800 ID8-IP unique gene variants. However, less than 1% of exon variants identified were detected by RNA sequencing (~60 million clean reads/repli- cate). No equivalent mutations were found in COSMIC, the Catalogue of Somatic Mutations in Can- cer. In addition to non-synonymous mutations previously identified in ID8 cells (Walton et al., 2016), we detected two additional changes inHjurp. In ID8-IP cells, new mutations were identified inXxylt1 andAtxn10.Overall, the mutational burden within both ID8 and ID8-IP cells is low.
To determine if genetic copy number alterations underlie ID8-IP phenotypes, exome sequencing read values and bioinformatic analyses were used to map sites of DNA gains or loss across chromo- somes using ID8 as a reference (Figure 1—source data 1). Gains in murine chromosome cytoband regions 6qD1-G3, 15qD3-F3, and 15qA1-D3 were present in ID8-IP cells (Figure 1B, green circles).
Research article Cancer Biology
These correspond to human cytobands 12p12.1, 8q24.2, and 8q24.3. The latter two represent one of the most amplified regions in HGSOC (Cancer Genome Atlas Research Network, 2011;
Li et al., 2019). The gain in cytoband 15qA1-D3 is in addition to chromosome 15 polyploidy detected by ID8 karyotyping (Roby et al., 2000). Notably, common gene gains in ID8-IP and HGSOC includeKras,Myc, andPtk2(encoding FAK) that support proliferation, stem cells, and adhe- sion signaling, respectively (Table 1). Herein, these ID8-IP cells will be termed KMF to denote gains inKras,Myc, andFAK genes. Murine KMF cells contain several gains or losses in genes common to the top 20 set of genes altered in HGSOC (Table 1).
MYC and PTK2 associations in HGSOC
In HGSOC patients, simultaneous gains inKRAS,MYC, andPTK2 gains co-occur in 42% of tumors;
PTK2andMYCco-occur in an additional 32% of HGSOC patients (Figure 1C). Thus, more than 70%
of HGSOC tumors contain combined gains atPTK2andMYCloci.PTK2copy number gains are line- arly proportional toPTK2 mRNA (R2= 0.66) and FAK protein (R2= 0.61) levels in HGSOC tumors (Figure 1C—figure supplement 1). Elevated PTK2 mRNA levels in HGSOC are associated with decreased patient relapse-free survival (n = 1435, p=0.0009, and hazard ratio = 1.25) (Figure 1—fig- ure supplement 2A). Bioinformatic analyses identified a set of 36 genes on different chromosomes Figure 1.Spontaneous copy number gains in genes forKras,Myc, and FAK (Ptk2) in a new murine model (KMF) of ovarian cancer. (A) Schematic summary of KMF cell isolation by in vivo selection for aggressive ID8 growth in C57Bl/6 mice and expansion of cells as tumorspheres. (B) Whole- genome copy number ratio (log2) determined from ID8 and KMF exome sequencing. Gains (red) and losses (blue) are denoted across chromosomes.
Circled regions (green) highlight shared genomic copy alterations between KMF and HGSOC (Table 1). (C) Heat map showing genomic copy number alterations encompassingKRAS,MYC, andPTK2genes in HGSOC patients (TCGA, 311 tumors). Percentage of tumors with +1 or +2 copy number gains per group are indicated.
DOI: https://doi.org/10.7554/eLife.47327.003
The following source data and figure supplements are available for figure 1:
Source data 1.ID8 and KMF copy number alterations determined from exome sequencing.
DOI: https://doi.org/10.7554/eLife.47327.006
Figure supplement 1.Analysis ofPTK2mRNA and FAK protein expression as a function of genomic copy number.
DOI: https://doi.org/10.7554/eLife.47327.004
Figure supplement 2.ElevatedPTK2mRNA is associated with a poor prognosis in ovarian cancer.
DOI: https://doi.org/10.7554/eLife.47327.005
in HGSOC that exhibit a significant and at least a two-fold change in tumors with elevatedPTK2.
This 36 gene set was associated with a significant shorter time to relapse (n = 575, p=0.0024, hazard ratio = 1.37) (Figure 1—figure supplement 2B,C). Together, these results support the importance ofPTK2gains as a marker for poor prognosis.
KMF cells exhibit enhanced CSC phenotypes and cisplatin resistance
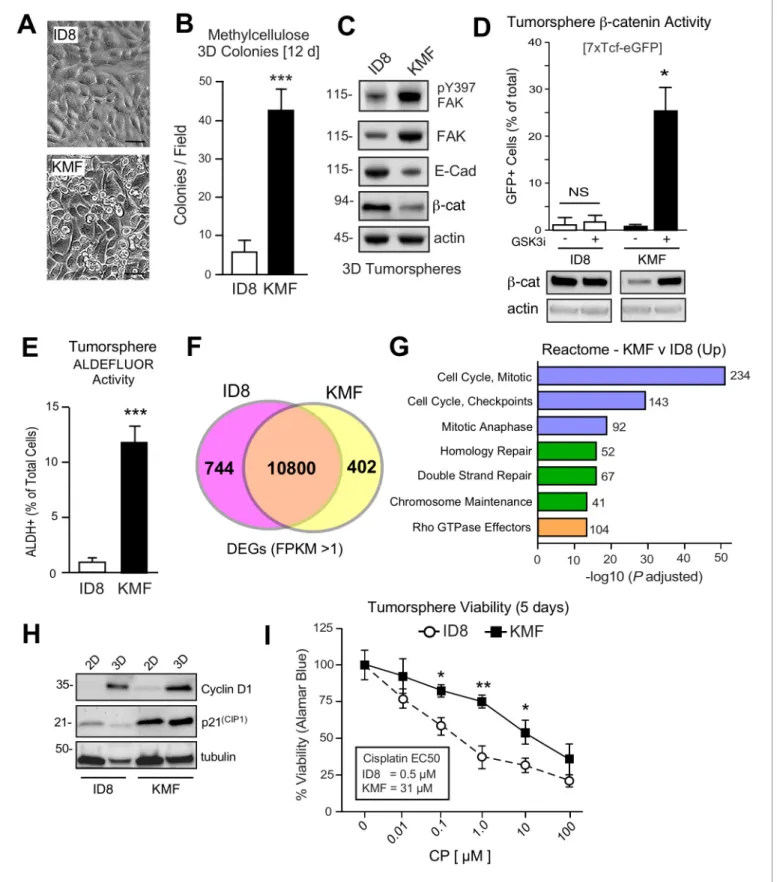
ID8 cells exhibit an epithelial-like morphology and poor growth as colonies in semi-solid methylcellu- lose media. KMF cells exhibit a mesenchymal morphology, form foci in two-dimensional (2D) cell cul- ture, and readily form 3D colonies in methylcellulose (Figure 2A,B). When grown in serum-free supplement-enhanced tumorsphere media (PromoCell) under anchorage-independent conditions for 5 days, ID8 and KMF cells remain ~95% viable and can be analyzed for signaling differences. By immunoblotting, KMF tumorspheres expressed elevated FAK, increased FAK Y397 phosphorylation, and decreased E-cadherin andb-catenin protein levels relative to ID8 cells and normalized to actin (Figure 2C). Treatment of KMF tumorspheres with a glycogen synthase kinase-3 inhibitor (GSK3i) increased b-catenin protein and nuclear transcriptional activity whereas GSK3i addition had no effects onb-catenin levels or activity in ID8 cells (Figure 2D). Additionally, greater than 10% of KMF tumorspheres possessed high ALDH activity with less than 1% of ID8 cells being ALDH-positive (Figure 2E). These results support the notion that KMF cells have gained enhanced CSC characteristics.
To determine if ID8 and KMF cells possess distinct transcriptional signatures, RNA sequencing was performed (Figure 2—source data 1). Using FPKM (Fragments Per Kilobase of transcript per Million mapped reads) threshold values greater than one, 10800 shared, 744 ID8 enriched, and 402 KMF elevated transcripts were identified (Figure 2F). Top 20 Reactome signaling pathways upregu- lated in KMF cells includeCell Cycle Control,Mitotic Checkpoint,DNA Repair, and Rho GTPasesig- naling (Figure 2G). Elevated cell cycle mRNA levels are consistent with enhanced KMF tumorsphere growth. However, elevated levels of mitotic checkpoint inhibitors such as p21CIP1 were also consti- tutively and highly expressed in KMF cells (Figure 2H). Deregulated p21CIP1 levels can occur in p53-deficient cells (Georgakilas et al., 2017), but no mutations in p53 were detected by KMF exome sequencing and steady-state levels of KMF p53 protein are low. As DNA repair pathway tar- gets are also increased in KMF cells (Figure 2G), ID8 and KMF tumorsphere viability was measured after exposure to different concentrations of cisplatin (CP) over 5 days (Figure 2I). KMF cells pos- sessed increased intrinsic resistance to CP cytotoxicity with greater than a 10-fold difference in EC50 values compared to ID8. Taken together, this new KMF model exhibits noteworthy phenotypic simi- larities to drug-resistant HGSOC.
Sustained FAK Y397 phosphorylation (pY397) in patient ovarian tumors surviving neoadjuvant chemotherapy
A small subset of HGSOC patients are treated with neoadjuvant carboplatin and paclitaxel chemo- therapy to reduce tumor burden prior to undergoing surgery (Matulonis et al., 2016). However, some tumor cells, such as CSCs, escape CP-mediated apoptosis and survive chemotherapy Table 1.Shared copy number alterations between KMF and the top 20 most significant gene gains and losses in HGSOC.
Murine Cytoband
Human Cytoband
Gain/
Loss Genes in common murine-human loci Pathway/Role
6qD1-G3 12p12.1 Gain KRAS Proliferation
15qA1-D3 8q24.21, 8q24.3 Gain MYC, PTK2 Stem Cell, Adhesion
15qD3-F3 8q24.3 Gain RECQL4 DNA Repair
8qA1.1–1.3 8p23.3 Loss TUSC3 Tumor Suppressor
8qB1.1–1.2 4q34.3 Loss IRF2 Interferon Response
10qA1-D1 19p13.3 Loss TJP3 Tight Junction
13qB3-D2.3 5q11.2, 5q13.1 Loss MAP3K1, FOXD1, PIK3R1 MAPK, Cell Cycle
P85-PI3-kinase DOI: https://doi.org/10.7554/eLife.47327.007
Research article Cancer Biology
Figure 2.Acquired CSC phenotypes and greater intrinsic cisplatin resistance of KMF cells. (A) ID8 or KMF cells at high densities in 2D culture by phase- contrast imaging. Scale is 25mm. (B) Quantitation of ID8 and KMF colony formation in methylcellulose (21 days). Values are means (±SEM, ***p<0.001, unpaired T-test) from three independent experiments. (C) ID8 and KMF 3D protein lysates immunoblotted for pY397 FAK, total FAK, E-cadherin,b- catenin, and actin. (D) Lentiviral-deliveredb-catenin transcriptional reporter activity (7X TCF-eGFP) in ID8 and KMF cells grown as tumorspheres + /- Figure 2 continued on next page
(Wiechert et al., 2016). FAK protein and FAK tyrosine phosphorylation (pY397 FAK) levels are ele- vated in primary HGSOC tumors compared to normal tissue (Zhang et al., 2016), but it is not known whether chemotherapy alters FAK phosphorylation. To evaluate this, serial sections of paired primary biopsies and tumors obtained at the time of cytoreductive surgery following neoadjuvant carboplatin and paclitaxel chemotherapy were analyzed by immunohistochemical staining and quantitative image analyses (Figure 3—figure supplement 1).
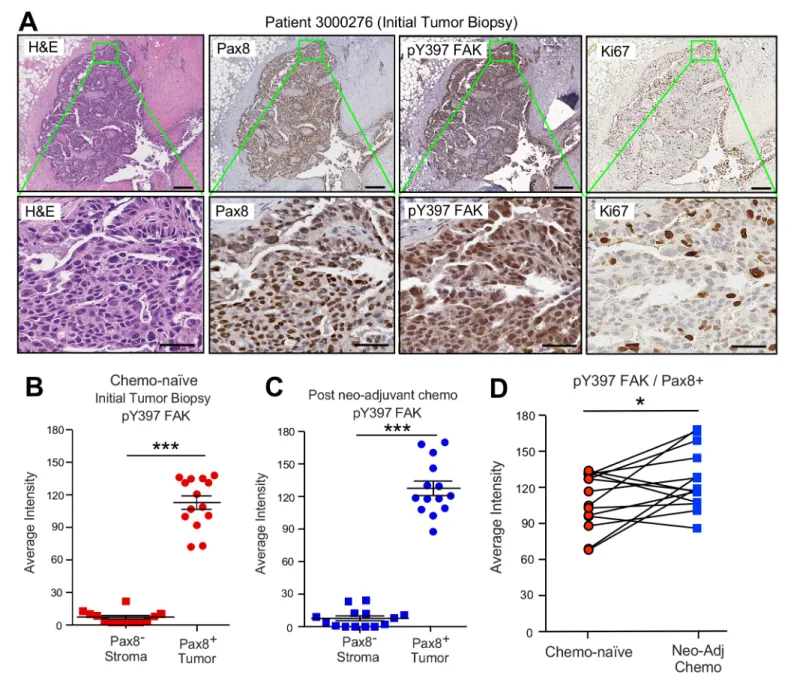
A high degree of Pax8 (tumor marker) and pY397 FAK co-localized staining was detected in pri- mary biopsy samples with FAK pY397 exhibiting both cytoplasmic and nuclear localization (Figure 3A,B). Several of these tumor cells stained positive for the Ki-67 proliferation marker. FAK pY397 staining was higher in ovarian tumor compared to surrounding stromal cells (Figure 3—figure supplement 1). Surprisingly, pY397 FAK staining remained elevated in non-necrotic tumor samples obtained after multiple cycles of neoadjuvant chemotherapy (Figure 3—figure supplement 1). By comparing samples from the same patients pre- and post-chemotherapy, we found pY397 FAK lev- els trended significantly upward in tumors surviving neoadjuvant chemotherapy (Figure 3D), further supporting an association between FAK signaling and tumor chemoresistance.
FAK activation upon ovarian tumorsphere formation
FAK pY397 is canonically considered a marker associated with cell adhesion or increased tissue stiff- ness (Sulzmaier et al., 2014). Unexpectedly, pY397 FAK staining was also observed within Pax-8- positive ascites tumorspheres that also displayed active b-catenin staining (Figure 4A). This was unanticipated, since FAK Y397 phosphorylation is rapidly lost when human platinum-resistant OVCAR3 cells are removed from adherent 2D culture and placed in suspension (Figure 4B). How- ever, extended time course analyses of OVCAR3 cells cultured in anchorage-independent PromoCell media revealed that FAK Y397 phosphorylation was restored as OVCAR3 cells clustered to form tumorspheres within 2–3 days (Figure 4B,C). Surprisingly, CP (1mM) treatment of OVCAR3 tumor- spheres (EC50 >10 mM) triggered increased FAK Y397 and b-catenin Y142 phosphorylation (Figure 4D). Asb-catenin Y142 is a direct FAK substrate promotingb-catenin activation in endothe- lial cells (Chen et al., 2012), our findings support the notion that adhesion-independent non-canoni- cal FAK activation occurs during tumorsphere formation and in response to CP stimulation.
Combinatorial effects of CP and FAK inhibition
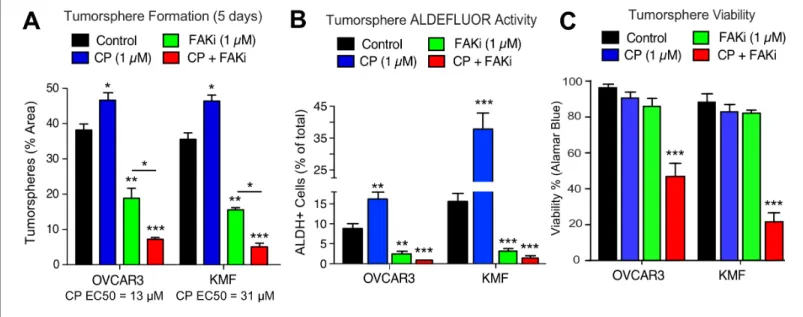
As increased FAK Y397 phosphorylation can occur upon CP treatment, we investigated the effect of low dose CP treatment (1mM) in the presence or absence of a FAK inhibitor (VS-4718, 1mM) over 5 days on tumorsphere formation, ALDH activity, and cell viability (Figure 5). Cisplatin EC50 values for growth inhibition were 13 mM and 31 mM for OVCAR3 and KMF tumorspheres, respectively. CP treatment resulted in increased tumorsphere formation and ALDEFLUOR activity in OVCAR3 and KMF cells, consistent with this low CP dose serving as an activation-type stress (Figure 5A,B). In con- trast, FAK inhibitor (FAKi) reduced tumorsphere formation and ALDEFLUOR activity compared to control-treated OVCAR3 and KMF cells (Figure 5A,B).
Figure 2 continued
GSK3binhibitor. Values are percent GFP+ cells by flow cytometry (NS, not significant, *p<0.05, unpaired T-test, two experiments). Lower, lysates of cells immunoblotted forb-catenin and actin. (E) Quantitation of ID8 and KMF tumorsphere ALDEFLUOR activity. Values are means expressed as fold-change to ID8 (±SD, ***p<0.001, unpaired T-test, three independent experiments). (F) RNA sequencing Venn plot: number of shared or different expressed genes (DEGs) from ID8 and KMF cells in 3D culture. DEGs from FPKM (Fragments Per Kilobase of transcript per Million mapped read) values greater than 1. (G) Partial list of Reactome (top 20) KMF UP DEGs. N is the number of target genes elevated in KMF versus ID8. X axis are -log10 adjusted pP values. (H) Immunoblotting for cyclin D1, p21(Cip1), and tubulin in lysates of ID8 or KMF cells grown in 2D [10% serum] or 3D [serum-free PromoCell, 5 days] conditions. (I) Tumorsphere cytotoxicity (Alamar Blue) with increasing CP (5 days) expressed as percent viability to DMSO control. Means (n = 2) from four independent experiments (±SEM, *p<0.05, **p<0.01 by two-way ANOVA with a Bonferroni’s multiple comparisons test). EC50 values independently determined.
DOI: https://doi.org/10.7554/eLife.47327.008 The following source data is available for figure 2:
Source data 1.Annotated RNA sequencing results from ID8 and ID8-IP/KMF tumorsphere cell lysates.
DOI: https://doi.org/10.7554/eLife.47327.009
Research article Cancer Biology
Figure 3.FAK Y397 phosphorylation (pY397) in HGSOC patient tumors surviving neoadjuvant chemotherapy. (A) IHC staining of paraffin-embedded serial initial tumor biopsy sections (patient 3000276) with H and E, Pax8, pY397 FAK, and Ki67. Scale is 200mm. Inset (green box) region is shown at 40X (below). Scale is 60mm. (B and C) FAK pY397 staining intensity of paired patient ovarian tumor samples from initial biopsies (panel B) and after surgical removal following neoadjuvant chemotherapy (panel C) within Pax8-positive (tumor) and Pax8-negative (stroma) regions. Dot plots are quantified staining from 14 paired patient samples (Aperio software) and bars show mean±SEM (analyzed 11 regions per sample, ***p<0.001, unpaired T-test).
(D) Increased FAK pY397 staining within Pax8-positive regions post-chemotherapy (*p<0.05, paired T-test). Lines are connecting paired patient tumor samples collected prior to and after neoadjuvant chemotherapy.
DOI: https://doi.org/10.7554/eLife.47327.010
The following figure supplements are available for figure 3:
Figure supplement 1.Patient tumor samples pre- and post-neoadjuvant chemotherapy, qualitative IHC score, and summary of quantitative image analyses.
DOI: https://doi.org/10.7554/eLife.47327.011
Figure supplement 2.FAK pY397 phosphorylation is maintained in Pax8-positive HGSOC tumors after neo-adjuvant chemotherapy.
DOI: https://doi.org/10.7554/eLife.47327.012
FAKi was not directly cytotoxic, since only CP combined with FAKi decreased tumorsphere viabil- ity (Figure 5C). Single agent CP or FAKi treatment did not alter KMF (Figure 5—figure supplement 1) or OVCAR3 (Figure 5—figure supplement 2) growth or viability in 2D culture. Under 3D condi- tions, FAKi reduced FAK Y397 phosphorylation and resulted in an elevated percentage of KMF and OVCAR3 cells in G1 phase of the cell cycle (Figure 5—figure supplements 1 and2). The finding that FAKi decreased 3D cell proliferation, and that FAKi exhibits combinatorial activity with low-dose CP to promote apoptosis, highlights a potential therapeutic combination.
Platinum-resistant tumorspheres can acquire dependence on FAK for growth
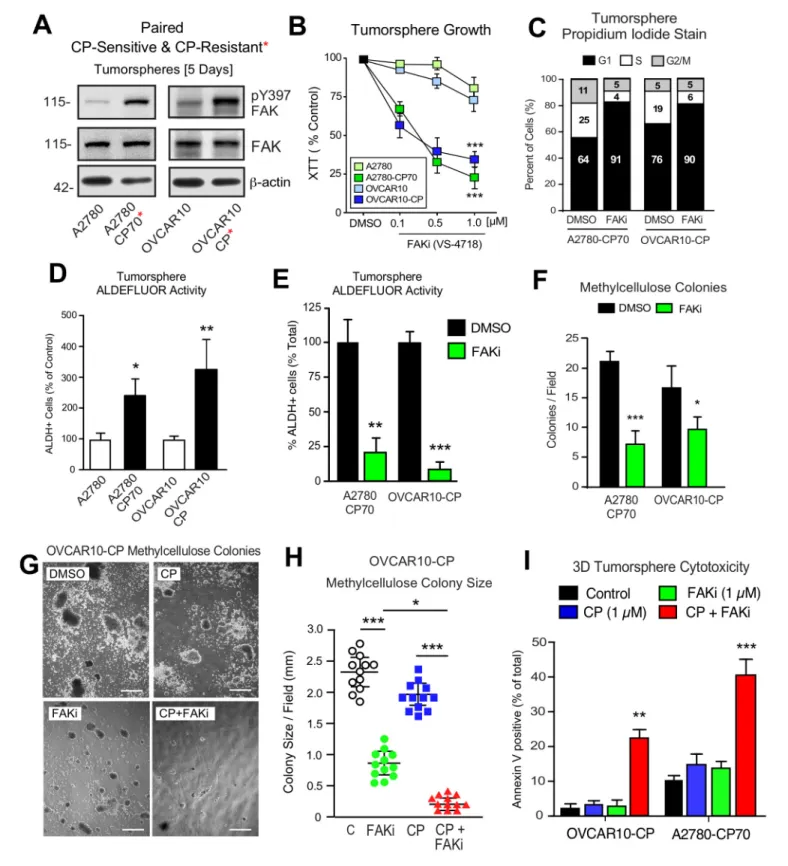
Phosphoinositide 3-kinase (PI3K)-elicited Akt activation is one of several survival signaling pathways downstream of FAK (Sulzmaier et al., 2014). More than half of HGSOC tumors harbor genetic lesions that can elevate PI3K activity (Hanrahan et al., 2012). A2780 human ovarian carcinoma tumor cells contain activating mutations inPI3KCAand inactivation ofPTEN- alterations that can promote Akt activation (Domcke et al., 2013). OVCAR10 cells similarly exhibit elevated Akt phosphorylation and both A2780 and OVCAR10 cells are resistant to FAKi (1 mM) effects on 3D cell proliferation (Tancioni et al., 2014). To determine if in vitro acquisition of increased CP resistance alters FAK sig- naling, intermittent CP exposure (10 mM) and cell recovery was used to generate OVCAR10-CP (EC50 = 9mM) and maintain A2780-CP70 cell (EC50 = 60mM) selection. Immunoblotting revealed constitutively elevated FAK pY397 within tumorspheres of CP-resistant compared to parental cells (Figure 6A). In addition, we find that CP-resistant A2780-CP70 and OVCAR10-CP cells exhibited a Figure 4.Non-canonical FAK Y397 phosphorylation in tumorspheres. (A) Paraffin-embedded IHC serial section staining (H and E, Pax8, pY397 FAK, and activeb-catenin) of peritoneal ascites cells (tumorspheres) from initial (patient 1014086) biopsy. (B) OVCAR3 lysates from 2D adherent, suspended (1 hr), and cells in anchorage-independent serum-free (PromoCell) conditions facilitating tumorsphere formation were analyzed by total FAK and pY397 FAK immunoblotting. (C) Representative images of OVCAR3 tumorsphere formation at Day 1, Day 2, and Day 3. Scale is 2 mm. (D) OVCAR3 cells as tumorspheres (Day 3) treated with DMSO or CP (1mM) for 1 hr and protein lysates blotted for pY397 FAK, total FAK, pY142b-catenin, and totalb- catenin.
DOI: https://doi.org/10.7554/eLife.47327.013
Research article Cancer Biology
newly acquired dose-dependent sensitivity to FAKi growth inhibition as tumorspheres (Figure 6B), but not when the same cells were grown in 2D conditions (Figure 6B—figure supplement 1).
FAKi treatment of A2780-CP70 and OVCAR10-CP tumorspheres was accompanied by an increased percentage of G1 phase cells, decreased cyclin D1 expression, but not increased apopto- sis (Figure 6—figure supplement 2). Both A2780-CP70 and OVCAR10-CP tumorspheres possessed increased ALDH activity compared to parental cells (Figure 6—figure supplement 3) and this was dependent on FAK activity (Figure 6E). FAKi selectively prevented A2780-CP70 and OVCAR10-CP methylcellulose colony formation (Figure 6F) but did not inhibit parental A2780 or OVCAR10 colony formation (Figure 6—figure supplement 2).
To determine the effects of combinatorial FAKi and low dose CP treatments, OVCAR10-CP col- ony formation was evaluated in the presence of DMSO (control), FAKi (1mM), CP (1mM), or FAKi and CP combination (Figure 6G,I). Single agent FAKi reduced colony size (Figure 6G), consistent with an inhibitory effect on tumorsphere proliferation. FAKi with CP prevented colony formation (Figure 6H) and this was associated with increased OVCAR10-CP apoptosis (Figure 6I). Only the combination of FAKi with CP triggered increased A2780-CP70 apoptosis (Figure 6I). These results support the notion that selection for platinum resistance can result in the acquired dependence on FAK activity for tumorsphere growth. Moreover, FAK inhibition in combination with CP can trigger CP-resistant tumorsphere apoptosis.
FAK inhibition sensitizes CP-resistant A2780-CP70 tumors to chemotherapy
DTomato plus luciferase-labeled A2780 or A2780-CP70 cells were orthotopically injected into mice to assess the combinatorial potential of FAKi (VS-4718) and cisplatin plus paclitaxel (CPT) chemo- therapy on paired CP-sensitive and CP-resistant tumors established in immune-deficient mice Figure 5.Prevention of CSC phenotypes in vitro by pharmacological FAK inhibition. Quantification of OVCAR3 and KMF tumorsphere formation (panel A), ALDEFLUOR activity (panel B), and tumorsphere viability (panel C) in the presence of DMSO (control), CP (1mM), FAKi (VS-4718, 1mM) or CP plus FAKi for 5 days. Values are means (±SEM, *p<0.05, **p<0.01, ***p<0.001 unpaired T-test) of three independent experiments. Panel C, values are means (±SEM, ***p<0.001, one-way ANOVA) from three independent experiments.
DOI: https://doi.org/10.7554/eLife.47327.014
The following figure supplements are available for figure 5:
Figure supplement 1.Small molecule FAK inhibition prevents KMF 3D tumorsphere proliferation with effects on cell cycle but not cell apoptosis.
DOI: https://doi.org/10.7554/eLife.47327.015
Figure supplement 2.Small molecule FAK inhibition selectively inhibits OVCAR3 3D tumorsphere proliferation with effects on cell cycle but not cell apoptosis.
DOI: https://doi.org/10.7554/eLife.47327.016
Figure 6.Acquired FAK dependence for CP-resistant tumorsphere growth. (A) Human A2780, A2780-CP70, OVCAR10, and OVCAR10-CP tumorsphere lysates immunoblotted for FAK pY397, total FAK, and actin. (B) Growth of A2780, OVCAR10, A2780-CP70, or OVCAR10-CP cells as tumorspheres in the presence of FAKi (VS-4718, 0.1 to 1.0mM) for 4 days. Values are means (±SEM, ***p<0.001, one-way ANOVA) from two independent experiments. (C) A2780-CP70 or OVCAR10-CP cells grown as tumorspheres (3 days) were treated with DMSO or FAKi (VS-4718, 1mM) for 24 hr, stained with propidium iodide, and analyzed by flow cytometry. Shown is percent of cells in G0/G1, S, or G2/M phase of the cell cycle. (D) Quantitation of A2780-CP70 and Figure 6 continued on next page
Research article Cancer Biology
(Figure 7). A2780 tumor growth was insensitive to FAKi (Figure 7—figure supplement 1), consistent with limited FAKi effects on A2780 growth in vitro. As expected, CPT chemotherapy inhibited A2780 tumor growth, but did not affect the resistant A2780-CP70 tumors. FAKi with CPT did not yield additional anti-tumor effects on A2780 tumor growth. In dramatic contrast, in A2780-CP70 tumors, single-agent FAKi treatment reduced tumor mass approximately 40% compared to controls (Figure 7A,D), and the combination of FAKi with CPT chemotherapy resulted in an even greater reduction in tumor growth (Figure 7B–D). Interestingly, CPT treatment increased FAK Y397 phos- phorylation (Figure 7E,F) and ALDH-1A1 staining (Figure 7G) in non-necrotic regions of A2780- CP70 tumors (Figure 7—figure supplement 2). Adding FAKi to CPT chemotherapy suppressed FAK Y397 phosphorylation, reduced ALDH-1A1 tumor staining, and increased tumor apoptosis in vivo (Figure 7E,H). These results show that the combination of a FAK inhibitor with CP exhibits selective anti-tumor effects on CP-resistant A2780-CP70 tumors in vivo.
KMF FAK inactivation and reconstitution link intrinsic FAK activity to b- catenin
To provide genetic support for the role of FAK in intrinsic CP resistance, CRISPR/Cas9 targeting was used to inactivate murinePtk2exon four in KMF cells (Figure 8) and humanPTK2exon 3 of OVCAR3 cells (Figure 8—figure supplement 1) to create FAK knockout (KO) cells. No difference in 2D adher- ent cell growth was detected and FAK KO clones were isolated. Sanger sequencing confirmed unique deletions/insertions predicted to terminate FAK protein translation in each of four Ptk2 alleles identified in KT3 and KT13 FAK KO clones (Figure 8—figure supplement 2). Exome sequenc- ing of FAK KO clone KT13 (90% of exons sequenced at 100X) detected only 165 unique variants, including the fourPtk2 alterations, indicating that CRISPR targeting was specific and that the FAK KO KT13 genome is similar to parental KMF cells (Figure 8—source data 1).
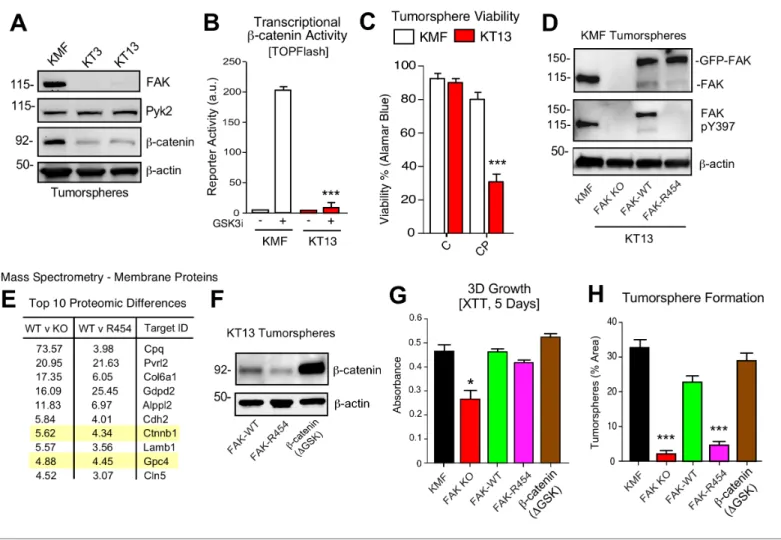
CRISPR inactivated FAK but not expression of the FAK-related Pyk2 kinase (Figure 8A). In KT3 and KT13 clones, totalb-catenin protein levels were constitutively lower than KMF cells (Figure 8A) and this corresponded to decreasedb-catenin transcriptional activity (Figure 8B). When cultured in PromoCell tumorsphere media under anchorage-independent conditions, FAK KO cell viability remained high after 5 days (Figure 8C). However, FAK KO cells exhibited sensitivity to CP-mediated cytotoxicity compared to parental KMF cells. Similar results were obtained comparing parental and FAK KO OVCAR3 cells (Figure 8—figure supplement 1). Importantly, phenotypes of decreased tumorsphere formation, ALDEFLUOR activity, and CP resistance in FAK KO OVCAR3 cells were res- cued by GFP-FAK re-expression (Figure 8—figure supplement 1). These results connect FAK expression to CP resistance and CSC-associated phenotypes.
To establish a genetic linkage with FAK activity, FAK KO KT13 cells were stably reconstituted with GFP-FAK wildtype (WT) or a catalytically-inactive (K454R) GFP-FAK point mutation (Figure 8D) Figure 6 continued
OVCAR10-CP colony formation in methylcellulose (21 days) with DMSO (control) or FAKi (VS-4718, 1mM). Values are means (±SEM, *p<0.05,
***p<0.001, unpaired T-test) from two independent experiments. (E) A2780-CP70 and OVCAR10-CP tumorsphere ALDEFLUOR activity treated with DMSO or FAKi (VS-4718, 1mM) for 24 hr. Values are means (±SEM, **p<0.01, ***p<0.001, one-way ANOVA compared to DMSO) for three independent experiments. (F) Quantitation of A2780-CP70 and OVCAR10-CP methylcellulose colony formation (21 days). Values are means (±SEM, *p<0.05,
***p<0.001, unpaired T-test) from two independent experiments. (G and H) Representative OVCAR10-CP methylcellulose colony formation (21 days) (panel G) and colony size (panel H) in the presence of DMSO (control), CP (1mM), FAKi (1mM), or CP plus FAKi. Scale is 2.5 mm. Values are means (±SEM, *p<0.05, ***p<0.001, one-way ANOVA) from two independent experiments. (I) A2780-CP70 and OVCAR10-CP tumorsphere cytotoxicity (annexin V) in the presence of DMSO (control), CP (1mM), FAKi (1mM), or CP plus FAKi. Values are means (±SEM, **p<0.01, one-way ANOVA) from three independent experiments.
DOI: https://doi.org/10.7554/eLife.47327.017
The following figure supplements are available for figure 6:
Figure supplement 1.Constitutively elevated FAK Y397 phosphorylation in CP-resistant tumorspheres.
DOI: https://doi.org/10.7554/eLife.47327.018
Figure supplement 2.Platinum-resistant A2780-CP70 exhibit FAK-dependent growth.
DOI: https://doi.org/10.7554/eLife.47327.019 Figure supplement 3.ALDEFLUOR assays.
DOI: https://doi.org/10.7554/eLife.47327.020
(Lim et al., 2010). In 3D anchorage-independent conditions, GFP-FAK-WT and GFP-FAK-R454 were equally expressed, but only GFP-FAK-WT was phosphorylated at Y397 (Figure 8D). This result con- firms that intrinsic FAK kinase activity facilitates FAK Y397 phosphorylation. To identify proteomic differences in an unbiased manner, lysates of KT13 FAK KO, FAK-WT, and FAK-R454 cells were ana- lyzed by mass spectrometry (Figure 8—source data 2). Elevated levels of extracellular matrix (colla- gen type six and laminin), surface receptors (N-cadherin and Nectin-2),b-catenin, and Wnt signaling targets (GPC4) (Sakane et al., 2012) were present in FAK-WT compared to FAK KO cells. These Figure 7.FAK inhibition sensitizes CP-resistant tumors chemotherapy-induced apoptosis. (A) Experimental schematic and IVIS imaging of labeled A2780-CP70 cells IP injected into NSG mice (randomized at Day 5). Experimental groups: control saline (black) injection on Days 5, 12, and 19; VS-4718 by oral gavage (green, 100 mg/kg, BID); CPT chemotherapy injection (blue, 3 mg/kg cisplatin and 2 mg/kg paclitaxel) on Days 5, 12, and 19; and VS- 4718 plus CPT combined administration (red). IVIS imaging was performed on Days 4, 11, 18, and 23. Tumor burden is expressed as percent of Day 4.
(B) Representative IVIS images of A2780-CP70 tumor burden on Day 18. (C) Representative images of omentum with A2780-CP70 tumors at Day 24.
Scale is 0.5 cm. (D) Omentum-associated A2780-CP70 tumor mass (n = 6,±SEM *p<0.05, one-way ANOVA) from each treatment group. (E) A2780-CP70 tumor lysates immunoblotted for FAK pY397, FAK, and actin. (F) Ratio of pY397 FAK to total FAK levels in tumor lysates by immunoblotting. Values are means (±SEM *p<0.05, ***p<0.001, one-way ANOVA) of three tumors per experimental group. Control set to 100. (Gand H) Percent ALDH-1A1- positive immunofluorescent A2780-CP70 tumor staining or apoptosis (TUNEL and Hoescht 33342 staining) in A2780-CP70 tumors. Values are means (±SEM, two independent tumors, five random fields per tumor at 20X, *p<0.05, **p<0.01, ***p<0.001 one-way ANOVA).
DOI: https://doi.org/10.7554/eLife.47327.021
The following figure supplements are available for figure 7:
Figure supplement 1.Inhibition of A2780 tumor growth by cisplatin-paclitaxel (CPT) chemotherapy.
DOI: https://doi.org/10.7554/eLife.47327.022
Figure supplement 2.Elevated FAK Y397 phosphorylation and ALDH staining in non-necrotic regions of CPT-treated mice with A2780-CP70 tumors.
DOI: https://doi.org/10.7554/eLife.47327.023
Research article Cancer Biology
Figure 8.KMF FAK KO and re-expression link intrinsic FAK activity tob-catenin and tumorsphere formation. (A) Immunoblotting of KMF and CRISPR- mediated FAK KO clones KT3 and KT13 cell lysates for FAK, Pyk2,b-catenin, and actin. (B) KMF and FAK KO KT13 cell viability treated with DMSO (control) or CP (1mM) after 72 hr as measured by Alamar Blue. Values are means (±SEM, *p<0.05, **p<0.01, ***p<0.001, one-way ANOVA with Fisher’s LSD multiple comparison test) for three independent experiments. (C)b-catenin transcriptional reporter activity (TOPFlash) in transfected KMF and KT13 FAK KO cells + /- GSK3binhibitor. Values are arbitrary units (***p<0.001, unpaired T-test, two independent experiments). (D) Immunoblotting for pY397 FAK, FAK, and actin in lysates of KMF, FAK KO, GFP-FAK-WT, and GFP-FAK-R454 re-expressing cells. (E) Top 10 proteomic differences (fold-change) detected by mass spectroscopy of membrane associated proteins in KT13 FAK KO, GFP-FAK-WT, and GFP-FAK R454 re-expressing cells. (F)
Immunoblotting forb-catenin and actin in lysates of KT13 FAK KO cells stably expressing GFP-FAK-WT, GFP-FAK-R454, orb-catenin (DGSK). (Gand H) XTT metabolic activity (panel G) or tumorsphere formation (panel H) of KMF, KT13 FAK KO, or the indicated reconstituted cells in PromoCell after 5 days. Values are means (±SEM, *p<0.05, ***p<0.001, one-way ANOVA with a Tukey’s multiple comparisons test) from 2 (panel G) or 3 (panel H) independent experiments.
DOI: https://doi.org/10.7554/eLife.47327.024
The following source data and figure supplements are available for figure 8:
Source data 1.KMF FAK KO clone KT13 exome sequencing variants.
DOI: https://doi.org/10.7554/eLife.47327.027
Source data 2.Summary of mass spectrometry-detected proteomic changes between KMF FAK KO, FAK-WT, and FAK kinase-inactive (K454R) re- expressing cells grown as tumorspheres.
DOI: https://doi.org/10.7554/eLife.47327.028
Figure supplement 1.OVCAR3 CRISPR-mediated FAK KO and re-expression.
DOI: https://doi.org/10.7554/eLife.47327.025
Figure supplement 2.Sequencing validation of CRISPR/Cas9-mediated FAK KO in KMF cells.
DOI: https://doi.org/10.7554/eLife.47327.026
differences were maintained in FAK-WT versus FAK-R454 cells (Figure 8E). As FAK can regulateb- catenin levels in colon carcinoma cells (Gao et al., 2015), the mass spectrometry results implicate intrinsic FAK activity in supporting Wnt-b-catenin signaling in KMF cells.
b-catenin promotes FAK KO tumorsphere formation, ALDEFLUOR activity, and CP resistance
To test whether stabilizedb-catenin was sufficient to complement KMF FAK KO cell phenotypes, an activated b-catenin point-mutant (DGSK) lacking the regulatory GSK3b phosphorylation sites (Barth et al., 1999) was expressed in KT13 FAK KO cells (Figure 8F). A series of assays were per- formed comparing KMF, FAK KO, FAK-WT, FAK-R454, and FAK KOb-cateninDGSK expressing cells.
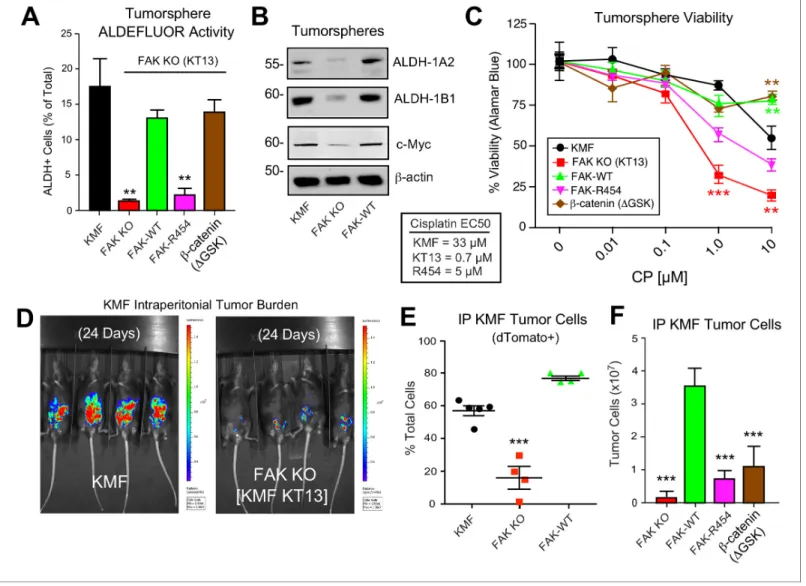
In 3D conditions, FAK KO proliferation was less than KMF cells and this was rescued by FAK-WT, FAK-R454, andb-cateninDGSK (Figure 8G). Notably, FAK-R454 cells grew in 3D culture, whereas parental KMF cells treated with FAKi exhibit growth defects (Figure 5). In contrast, FAK activity was required for clustering of KMF cells into tumorspheres and this phenotype was also supported byb- catenin DGSK expression (Figure 8H). FAK-WT restored total ALDEFLUOR activity, ALDH-1A2, ALDH-1B1, and Myc protein levels in FAK KO cells equivalent to parental KMF cells (Figure 9A,C).
Expression of FAK-WT andb-cateninDGSK but not FAK-R454 significantly enhanced FAK KO resis- tance to CP cytotoxicity in vitro (Figure 9C). Together, these results link intrinsic FAK activity andb- catenin in supporting KMF CSC and intrinsic CP resistance phenotypes.
FAK activity is essential for KMF tumor growth
Although oral FAKi administration can inhibit tumor growth in mice (Sulzmaier et al., 2014), it remains unclear whether this is mediated by FAK inhibition within tumor, stroma, or multiple cell types. Parental KMF, FAK KO, and FAK-WT cells were labeled with a dual reporter (luciferase and dTomato) and injected within the intraperitoneal cavity of C57Bl/6 mice to test whether FAK is essential for tumor establishment. At Day 24, luciferase imaging revealed significant KMF tumor bur- den whereas FAK KO tumor cells were only weakly detected (Figure 9D—figure supplement 1). At Day 28, flow cytometry enumeration of dTomato-positive peritoneal cells revealed significantly fewer FAK KO compared KMF and FAK-WT tumor cells (Figure 9E). In an independent experiment over 21 days, FAK KO and FAK-R454 cells did not grow in vivo as did FAK-WT tumors (Figure 9F). Sur- prisingly,b-cateninDGSK also did not promote FAK KO tumor growth (Figure 9F). This result con- trasted with the rescue of FAK KO tumorsphere formation, ALDEFLUOR activity, and CP resistance in vitro byb-cateninDGSK expression (Figure 8). Importantly, these results reveal that intrinsic FAK activity is essential for KMF tumor establishment in mice. Moreover,b-catenin signaling was not suffi- cient to support KMF tumor growth in the absence of FAK.
Transcriptomic analyses identify common FAK activity-dependent and b-catenin supported mRNA targets in KMF and HGSOC
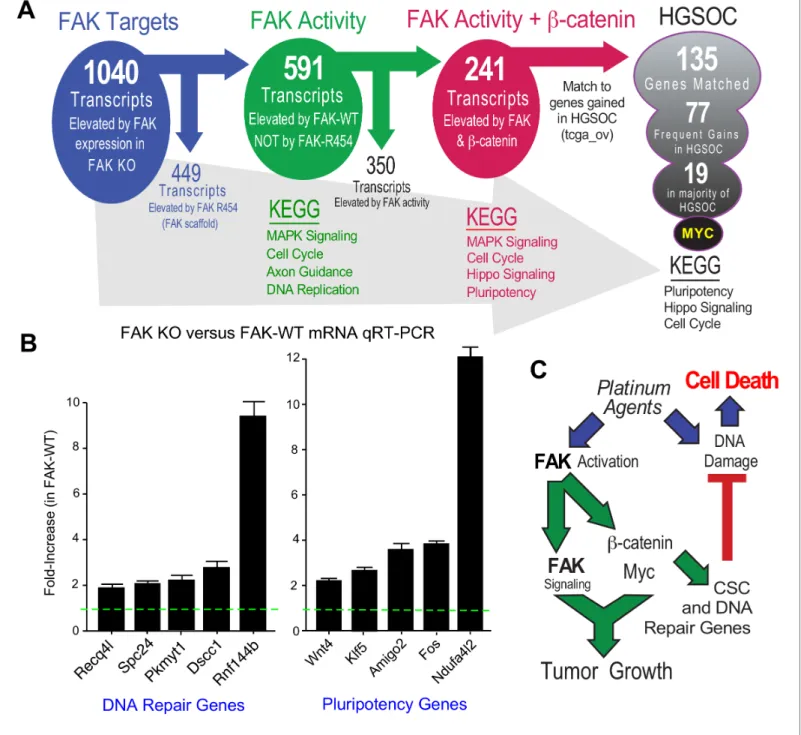
FAK controls various gene transcriptional networks (Sulzmaier et al., 2014;Serrels et al., 2017). As FAK KO cells are deficient in a number of different phenotypes, we performed RNA sequencing from KT13 FAK KO, FAK-WT, FAK-R454, andb-cateninDGSK cells grown in PromoCell to determine FAK activity-dependent, -independent, andb-catenin-specific patterns of differential gene expres- sion. Using an FPKM cutoff greater than one, 1040 mRNA transcripts were increased two-fold or more by FAK compared to FAK KO cells and significant after multiple testing correction (Figure 10—
source data 1 ). By filtering out transcripts that were elevated in FAK-R454 versus FAK KO cells (FAK activity-independent targets), 591 genes were identified as FAK activity-dependent and showed KEGG (Kyoto Encyclopedia of Genes and Genomes) pathway enrichment forMAPK Signal- ing, Cell Cycle, Axon Guidance, and DNA Replication.
After unbiased filtering of the 591 FAK activity-dependent transcripts with those elevated byb- cateninDGSK, 241 shared transcripts were identified as co-regulated by FAK activity andb-catenin (Figure 10A). KEGG enrichments wereMAPK Signaling, Cell Cycle, Hippo Signaling, and Pluripo- tency.Last, the 241 shared FAK andb-catenin murine targets were filtered against genes elevated in HGSOC by querying TCGA. Notably, 135 targets matched, 77 exhibit frequent gains in 20% of tumors, and 19 genes were elevated in greater than 50% of HGSOC patient tumors (Figure 10A).
Myc was the most common gene target and immunoblotting of KMF, FAK KO, and FAK-WT lysates
Research article Cancer Biology
confirmed the regulation of Myc protein expression by FAK (Figure 9B). Although Myc is a common target ofb-catenin (Sanchez-Vega et al., 2018), this result is surprising as bothMycandPtk2(FAK) DNA loci exhibit gains in KMF cells (Table 1). However, FAK knockout and FAK re-expression in human OVCAR3 cells also showed FAK-mediated regulation of Myc protein levels (Figure 8—figure Figure 9.Intrinsic FAK activity supports ALDFLUOR activity, CP resistance, and is essential for KMF tumor growth. (A) ALDEFLUOR activity of KMF, KT13 FAK KO, or the indicated reconstituted cells in PromoCell after 5 days. Values are means (±SEM **p<0.01, ***p<0.001, one-way ANOVA with a Tukey’s multiple comparisons test) of four independent experiments. (B) Immunoblotting for ALDH-1A2, ALDH-1B1, Myc, and actin in the indicated cell lysates. (C) Viability (Alamar Blue) of KMF (black circles), KT13 FAK KO (red squares), GFP-FAK WT (green triangle), GFP-FAK R454 (magenta triangle), andb-cateninDGSK (brown diamond) expressing cells treated with increasing CP concentrations for 5 days. Values are means (±SEM, **, p<0.01,
***p<0.001, two-way ANOVA with a Bonferroni’s multiple comparisons test) from three independent experiments. Lower, EC50 values were determined independently and using Prism. (D) IVIS imaging of C57Bl/6 mice with dTomato+ and luciferase-expressing KMF or KT13 FAK KO cells at experimental Day 24. (E) Flow cytometry analyses of peritoneal wash collected dTomato+ cells at Day 28 of mice bearing KMF (black), KT13 FAK KO (red), and FAK KO re-expressing FAK WT (green) cells. Values are means expressed as percent of total cells in peritoneal wash (±SEM, ***p<0.001, one-way ANOVA).
(F) Intraperitoneal (IP) tumor growth of KT13 FAK KO (red), GFP-FAK-WT (green), GFP-FAK-R454 (magenta), orb-cateninDGSK (brown) expressing cells.
Values are means of CD45-negative tumor cells determined by flow cytometry (±SD, ***p<0.001, one-way ANOVA).
DOI: https://doi.org/10.7554/eLife.47327.029
The following figure supplement is available for figure 9:
Figure supplement 1.Comparison of KMF, KT13 FAK KO, and FAK KO re-expressing GFP-FAK-WT orthotopic growth in C57Bl/6 mice.
DOI: https://doi.org/10.7554/eLife.47327.030
Figure 10.FAK activity andb-catenin promote a common gene signature elevated in HGSOC. (A) Summary of KMF RNA sequencing and filtering of differential gene expression. 1040 mRNAs were elevated (greater than log2 and FPKM >1) in FAK-WT versus KT13 FAK KO cells. 449 mRNAs were elevated in FAK R454 versus KT13 FAK KO cells. This represents FAK scaffold or activity-independent group (blue). By subtraction of FAK-R454 from FAK-WT targets, 591 FAK activity-dependent targets were identified (green). 1739 mRNAs were elevated inb-cateninDGSK cells, and by filtering against FAK activity-induced mRNAs, 241 common FAK activity andb-catenin enhanced mRNA targets were identified (red). 135 of 241 murine KMF targets were matched to genes elevated in HGSOC. 77 targets were elevated in 20% of HGSOC patients and 19 targets were elevated in more than 50% of HGSOC patients.MYCexhibits the highest genetic gain frequency. Top Kyoto Encyclopedia of Genes and Genomes (KEGG) pathway enrichments are listed for filtered groups. (B) Real-time PCR quantitation (qRT-PCR) of the indicated DNA repair- or pluripotency-associated mRNAs from FAK KO and FAK-WT cells grown in PromoCell for 5 days. Values were normalized to ribosomal RPL19 and fold increase are means from two replicates (±SEM, *p<0.05, T test). (C) Signaling summary of death-inducing and paradoxical survival-sustaining FAK activation by platinum chemotherapy. FAK signaling tob-catenin support elevated levels of Myc and mRNA target supporting pluripotency and DNA repair genes hypothesized to support cellular resistance platinum DNA damage. Tumor cell intrinsic FAK kinase activity is essential for KMF tumor growth via context-dependent signaling asb-catenin activation was not sufficient to promote tumor growth in the absence of FAK.
Figure 10 continued on next page
Research article Cancer Biology
supplement 2). Together, these results place FAK, b-catenin, and Myc within a common signaling pathway activated in ovarian cancer.
KEGG pathway analyses of FAK activity andb-catenin supported targets in HGSOC reveal conser- vation inPluripotency,Hippo Signaling, andCell Cycle(Figure 10A) which include targets support- ing platinum resistance and stemness phenotypes. Quantitative PCR using independent experimental samples verified at least twofold changes in genes linked to DNA repair (Recq4l, Spc24, Pkmyt1, Dscc1,andRnf144b) or pluripotency (Wnt4, Klf5, Amigo2, Fos, and Ndufa4l2) that were elevated by FAK-WT re-expression (Figure 10B). Although our studies did not establish causal- ity of mRNA changes with FAK phenotypes supporting CP resistance and pluripotency of KMF cells, these targets are part of the FAK activity- andb-catenin-regulated 135 genes elevated in HGSOC.
KMF cells are a unique murine model with profound similarities to HGSOC and will be made avail- able to the research community.
Discussion
Platinum-resistant ovarian carcinomas have complex tumor genomes, few targetable mutations, and no effective treatments (Patch et al., 2015). Gene breakage, gains, or losses are common drivers of tumor cell phenotypes. Using a new in vivo-evolved murine ovarian cancer model termed KMF - denoting gains in genes for Kras, Myc, and FAK – we demonstrate the functional significance of PTK2 (FAK) gains observed in HGSOC tumors. KMF cells exhibit more aggressive tumor growth, greater tumorsphere formation in vitro, elevated FAK Y397 phosphorylation, increased b-catenin and ALDH activities, and increased resistance to cisplatin-mediated cytotoxicity compared to paren- tal ID8 cells. In both KMF and human OVCAR3 ovarian carcinoma cells, we identify tumorsphere- associated non-canonical FAK signaling as supporting CSC phenotypes and intrinsic cisplatin resis- tance. This context-dependent signaling is consistent with an oncogenic role for FAK activation in ovarian cancer.
Although MYC amplification at 8q24.21 in HGSOC is associated with a poor prognosis (Goode et al., 2010), less is known aboutPTK2amplification at 8q24.3. We show that over 70% of HGSOC patient tumors contain gains at bothPTK2andMYCloci, thatPTK2copy number parallels PTK2 mRNA and FAK protein increases, and that elevatedPTK2 mRNA levels are associated with decreased patient disease-free survival. We identify a set of 36 genes associated withPTK2gain pre- dictive of HGSOC relapse. Additionally, we identifyMycas part of a set of 135 genes increased in murine KMF cells in a FAK kinase-dependent manner that also are highly expressed in HGSOC tumors. As FAK has also been proposed to function downstream of Wnt-Myc signaling in intestinal regeneration and tumorigenesis (Ashton et al., 2010), the contribution of FAK in support of Wnt signaling may be mediated by multiple mechanisms (Chen et al., 2012; Chen et al., 2018;
Gao et al., 2015;Kolev et al., 2017). Moreover, recent studies show that FAK andb-catenin over- expression cooperate to induce hepatocellular carcinoma (HCC) in mice (Shang et al., 2019) and that FAK promotes CSC-like phenotypes in HCC cells (Fan et al., 2019).
While platinum and taxane chemotherapy kills most ovarian tumor cells, we unexpectedly find that FAK activation is elevated in the residual tumor cells of patients undergoing chemotherapy, in mouse tumors, and in isolated ovarian carcinoma tumorspheres after cisplatin chemotherapy (Figure 10C). Previous studies showed increased FAK Y397 phosphorylation during the processes of acquired CP resistance of cultured ovarian carcinoma cells (Villedieu et al., 2006). This is consistent with studies linking chemotherapy to selective CSC survival (Wiechert et al., 2016) and we show Figure 10 continued
DOI: https://doi.org/10.7554/eLife.47327.031 The following source data is available for figure 10:
Source data 1.RNA sequencing annotated list of differentially expressed genes in KMF, KT13 FAK KO, FAK-WT, FAK-R454, andb-cateninDGSK cells grown as tumorspheres.
DOI: https://doi.org/10.7554/eLife.47327.032
Source data 2.List of 135 FAK-activity andb-catenin enhanced mRNAs in KMF matched to genes elevated in HGSOC (TCGA).
DOI: https://doi.org/10.7554/eLife.47327.033
that FAK inhibition compromises ALDH levels and CSC generation. Notably, platinum-resistant cells can acquire FAK dependence for growth. This dependence was manifest when culturing ovarian car- cinoma cells as tumorspheres and this 3D selective phenotype has been observed in breast (Tanjoni et al., 2010) and squamous cell carcinoma models (Serrels et al., 2012). In the A2780 and A2780-CP70 models, we found selective FAK dependence for growth in the CP resistant but not parental CP-sensitive cells.
Via complementary approaches including pharmacological inhibition, FAK knockout, and FAK re- expression, we show that FAK signaling sustains both intrinsic and acquired resistance to cisplatin chemotherapy in part via promotingb-catenin activation (Figure 10C). Notably, a FAK tob-catenin signaling linkage functions as an adaptive chemotherapy resistance pathway inBRAFmutated colon cancer (Chen et al., 2018). Stabilizedb-catenin DGSK expression in KMF FAK KO cells supported canonical Wnt target genes, yetb-catenin DGSK was unexpectedly insufficient to rescue FAK KO growth as tumors. This may be due to weak oncogenic activity of the b-catenin DGSK construct (Barth et al., 1999) or due to a supporting requirement for FAK. Additionally, the FAK-associated protein Rgnef is also essential for KMF tumorsphere growth and protection from oxidative stress (Kleinschmidt et al., 2019). We show that FAK expression and intrinsic activity are essential for KMF tumor growth and that elevated FAK activity and Y397 phosphorylation is an acquired and target- able cellular adaptation of cisplatin resistance in HGSOC.
In cell culture, cisplatin resistant cells acquired dependence on FAK activity to maintain prolifera- tion as 3D tumorspheres without alterations in 2D growth. Single agent pharmacological FAK inhibi- tion did not promote apoptosis of platinum-resistant ovarian cells. Rather, the combination of FAK inhibition (genomic and pharmacological) with cisplatin-triggered apoptosis of platinum-resistant cells as tumorspheres in vitro and prevented the growth of platinum-resistant tumors in mice. To this end, a phase I/II clinical trial for recurrent platinum-resistant ovarian cancer termed ROCKIF (Re-sen- sitization of platinum-resistant Ovarian Cancer by Kinase Inhibition of FAK, NCT03287271) has been initiated. ROCKIF will investigate whether the small molecule FAK inhibitor defactinib, in combina- tion with carboplatin and paclitaxel chemotherapy, can provide benefit for this difficult to treat patient population.
Materials and methods
Key resources table Reagent type (species)
or resource Designation Source or reference Identifiers
Additional information
Antibody anti-FAK
(mouse monoclonal)
Millipore Sigma clone 4.47;
Cat# 05–537;
RRID:AB_2173817
WB (1:1000)
Antibody anti-FAK (rabbit
polyclonal)
Millipore Sigma Cat# 06–543;
RRID:AB_310162
WB (1:1000)
Antibody anti-phospho-FAK (Tyr397)
(rabbit monoclonal)
Thermo Fischer Scientific
clone 141–9;
Cat# 44–625G;
RRID:AB_2533702
WB (1:1000)
Antibody anti-phospho-FAK (Tyr397)
(rabbit monoclonal)
Thermo Fischer Scientific
clone 31H5L17;
Cat# 700255;
RRID:AB_2532307
WB (1:1000)
Antibody anti-phospho-FAK (Tyr397)
(rabbit monoclonal)
Abcam clone EP2160Y;
Cat# ab81298;
RRID:AB_1640500
WB (1:1000)
Antibody anti-E-cadherin
(mouse monoclonal)
Cell Signaling Technology
clone 4A2;
Cat# 14472;
RRID:AB_2728770
WB (1:1000)
Antibody anti-b-actin
(mouse monoclonal)
Millipore Sigma clone AC-74;
RRID:AB_476697
WB (1:1000)
Antibody anti-b-actin
(mouse monoclonal)
Proteintech Group Cat# 60008–1;
RRID:AB_2289225
WB (1:1000)
Continued on next page
Research article Cancer Biology
Continued
Reagent type (species)
or resource Designation Source or reference Identifiers
Additional information
Antibody anti-b-cateninXP
(rabbit monoclonal)
Cell Signaling Technology
clone D10A8;
Cat# 8480;
RRID:AB_11127855
WB (1:1000)
Antibody anti-non-phospho
(Active)b-Catenin (Ser33/37/Thr41) (rabbit monoclonal)
Cell Signaling Technology
clone D13A1;
Cat# 8814;
RRID:AB_11127203
WB (1:1000)
Antibody anti-b-Catenin
(phospho Y142) (rabbit polyclonal)
Abcam ab27798;
RRID:AB_725969
WB (1:1000)
Antibody anti-c-Myc XP
(rabbit monoclonal)
Cell Signaling Technology
clone D84C12;
Cat# 5605;
RRID:AB_1903938
WB (1:1000)
Antibody anti-Pyk2
(mouse monoclonal)
Cell Signaling Technology
clone 5E2;
Cat# 3480;
RRID:AB_2174093
WB (1:1000)
Antibody anti-p21
(mouse monoclonal)
Santa Cruz Biotechnology
clone F5;
Cat# sc-6246;
RRID:AB_628073
WB (1:250)
Antibody anti-GFP
(mouse monoclonal)
Santa Cruz Biotechnology
clone B2;
Cat# sc-9996;
RRID:AB_627695
WB (1:1000)
Antibody anti-p53 (Pab 240)
(mouse monoclonal)
Santa Cruz Biotechnology
Cat# sc-99, RRID:AB_628086
WB (1:250)
Antibody Anti-a-Tubulin
(mouse monoclonal)
Millipore Sigma Cat# T6199;
RRID:AB_477583
WB (1:1000)
Antibody anti-ALDH1A1
(rabbit polyclonal)
Abcam Cat# ab23375;
RRID:AB_2224009
WB (1:1000)
Antibody anti-ALDH1A2
(rabbit polyclonal)
Proteintech Group Cat# 13951–1-AP, RRID:AB_2224033
WB (1:1000)
Antibody anti-ALDH1B1
(rabbit polyclonal)
Proteintech Group Cat# 15560–1-AP, RRID:AB_2224162
WB (1:1000)
Antibody anti-ALDH3B1
(rabbit polyclonal)
Proteintech Group Cat# 19446–1-AP WB (1:1000)
Antibody anti-Ki67
(rabbit polyclonal)
Abcam Cat# ab15580;
RRID:AB_443209
WB (1:1000)
Antibody anti-Pax8
(rabbit polyclonal)
Proteintech Group Cat# 10336–1-AP;
RRID:AB_2236705
WB (1:1000)
Antibody anti-p53
(mouse monoclonal)
Abcam clone PAb 240;
RRID:AB_303198
WB (1:250)
Antibody anti-Cyclin D1
(rabbit polyclonal)
Cell Signaling Technology
Cat# 2922;
RRID:AB_2228523
WB (1:1000)
Antibody Alexa Fluor 700
Rat Anti-Mouse CD45
Thermo Fisher Scientific
clone 30-F11;
Cat# 45-0451-80;
RRID:AB_891454
1 ul per test
Strain, strain background (Escherichia coli)
Stellar Competent Cells,
E. coliHST08 strain
Takara Cat# 636763 Chemically
competent cells
Strain, strain background (Escherichia coli)
One Shot Stbl3 Chemically CompetentE. coli
Life Technologies Cat# C737303 Chemically
competent cells
Chemical compound, drug
Jet PRIME Polyplus-transfection Cat#114–15
Chemical compound, drug
FuGENE HD Transfection Reagent
Promega Cat# E2311
Continued on next page