University of Pannonia
Doctoral School of Chemical Engineering and Material Sciences
Submitted for the degree of Doctor of Philosophy
of the University of Pannonia, Hungary
Author: Dong Sun
Supervisor: Dr. habil. Gusztáv Fekete
Dissertation Title: Gait analysis and musculoskeletal modeling used in athletes recovery from Achilles tendon rupture
Veszprém 2020
DOI:10.18136/PE.2020.742
GAIT ANALYSIS AND MUSCULOSKELETAL MODELING USED IN ATHLETES RECOVERY FROM ACHILLES TENDON RUPTURE
Thesis for obtaining a PhD degree in the Doctoral School of Chemical Engineering and Material Sciences of the University of Pannonia
in the branch of Material Sciences and Technologies Written by Dong Sun
Supervisor: Dr. habil. Gusztáv Fekete propose acceptance (yes / no)
…….…………...………
Dr. habil. Gusztáv Fekete supervisor
As reviewer, I propose acceptance of the thesis:
Name of Reviewer: Dr. habil. Krisztián Andor yes / no
…….…………...………
Dr. habil. Krisztián Andor 1st reviewer
Name of Reviewer: Dr. Gábor Katona yes / no
…….…………...………
Dr. Gábor Katona 2nd reviewer The PhD-candidate has achieved …...% at the public discussion.
Veszprém,
…….…………...………
Prof. Dr. László Gubicza Chairman of the Committee The grade of the PhD Diploma …... (…….. %)
Veszprém,
…….…………...………
Prof. Dr. Katalin Bélafiné Bakó Chair of the UDHC
Submitted with 113 pages and 176 references The Dissertation contains 34 Figures, and 5 Tables
Supervision
Dr. habil. Gusztáv Fekete Supervisor PhD supervisor, Doctoral School of Chemical Engineering and Material Sciences, University of Pannonia. Associate Professor at Savaria Institute of Technology, Faculty of Informatics, Eötvös Loránd University
Acknowledgements
Firstly, I would like to express my sincere gratitude to my supervisor Dr. habil. Gusztáv Fekete and Prof. Dr. Yaodong Gu for the continuous support of my PhD dissertation and related research, for your patience, motivation, and immense knowledge. I am glad to have the opportunity to be your student and have the benefit of all your knowledge. Your guidance helped me in all the time of research and writing of this thesis. I could not have imagined having a better advisor and mentor for my PhD dissertation.
Many other academic, secretarial and technical members of staff have facilitated the realization of this thesis and I express them all my gratitude. I acknowledge the Faculty of Engineering, University of Pannonia (PE), Savaria Institute of Technology, Eötvös Loránd University (ELTE) and Faculty of Sports Science, Research Academy of Grand Health, Ningbo University (NBU) for the facilities and support provided.
I’m very fortunate to work in a group full of talented people who have not only helped me in conducting my experiments, but also given me invaluable advices and support. Special thanks to all the professors and colleagues, Prof. Jianshe Li, Prof. Dr. László Kollár, Dr. Endre Jánosi, Dr. Tej Singh, Dr. Qichang Mei, Dr. Shirui Shao, Dr. Yan Zhang, Dr. Gongju Liu, Dr.
Meizi Wang, Dr. Yang Song, Dr. Liangliang Xiang and all PhD students for their helpful assistance, comments, and suggestions during my research work and sharing the experience of being a postgraduate student. Thanks to everyone who took part in the studies of this dissertation, your time was much appreciated. This dissertation could not completed without you. Many thanks to Prof. Dr. Katalin Bélafiné Bakó, Dr. Varga Tamás, Ms. Madléna Albert, Ms. Judit Szirmay, Ms. Tajnai Anita for managing many administrative processes and excellent help for managing administrative letters and various affairs during my PhD dissertation.
I would like to thanks my family and particularly my father, Mr. Youqiang Sun, my mother, Mrs. Jing Dong, and my beloved girlfriend, Ms. Yanping Zhang, thank you for supporting me to pursue what I loved, and thank you for your endless motivation and your unconditional love.
Finally, the financial support from Stipendium Hungaricum Programme, Tempus Public Foundation and China Scholarship Council (CSC) is gratefully acknowledged.
Content
Acknowledgements ... 7
Abstract ... 11
Abbreviations ... 15
List of Figures ... 17
List of Tables ... 19
1. Introduction ... 21
1.1 Achilles tendon (AT) and human movement ... 21
1.2 Human gait analysis ... 26
1.3 Musculoskeletal modeling based on OpenSim software ... 30
1.4 Achilles tendon rupture mechanism ... 40
1.5 Aims and objectives ... 46
2 Materials and methods ... 49
2.1 Introduction to the experimental and computational workflow ... 49
2.2 Experiments ... 51
2.3 Musculoskeletal modeling ... 58
2.4 Model validation ... 61
2.5 Data analysis ... 62
3 Results ... 63
3.1 AT anthropometric ... 63
3.2 Gait abnormality and asymmetry ... 63
3.3 Musculoskeletal modeling estimation... 71
4 Discussion... 79
4.1 Gait abnormality and asymmetry ... 79
4.2 Musculoskeletal modeling and estimation ... 82
5 Conclusions and future work ... 87
5.1 Conclusions ... 87
5.2 Recommendations for future works ... 88
Thesis points ... 91
List of publications ... 95
References ... 100
Abstract
Achilles tendon rupture (ATR) is common and life-altering injury. A patient who sustains an ATR should expect recovery in years with extensive rehabilitation. In general, the incidence of acute ATR has been 53/100.000 persons/year. Incidence of ATR highly increased over the last years, which can alter tissue composition while having non-wanted effects on long-term tendon mechanics and lower limb functions during daily movement.
The first research question of this thesis: It has been revealed in the literature study, that in case of musculoskeletal modeling, no authors have considered to alter two important musculotendon related parameters, namely: tendon slack length lst and optimal fiber length lom. Without considering these parameters, the musculotendon forces will be very likely overestimated in the pathological side for ATR patients. By changing these parameters, it is possible to alter the Achilles tendon to behave like if it was ruptured and therefore, we could obtain realistic muscle forces for the triceps surae and the joint reaction forces.
The first objective of this thesis: To create a new musculoskeletal model, combined with experimental techniques (involving motion capture, ground reaction force measurement and medical imaging) which can realistically calculate the musculotendon forces and joint reaction forces in case of simulated Achilles tendon rupture. As a novel augmentation, the tendon slack length lst and optimal fiber length lom are determined by medical imaging, and they are integrated into the model. Therefore, it is possible to quantify the percentile difference between the musculotendon forces with or without Achilles tendon rupture.
The second research question of this thesis: It has been not discussed whether the Achilles tendon rupture has any critical effect on the knee joint and its area. However, it is assumed that it does and this effect is very likely resulted in higher knee adduction moment and joint forces during walking, which should be quantified.
The second objective of this thesis: By creating the new musculoskeletal model, the effect of Achilles tendon rupture on the knee kinetics will be quantified. The aim of this part is to compare the magnitude of the knee adduction moments in frontal plane and estimate knee joint reaction forces between the injured side (with ATR) and the uninjured side (without ATR) during walking, jogging and running. On one hand, by knowing the realistic joint loading in the injured side, a safer physical activity guideline during ATR rehabilitation process can be proposed to avoid the risk of knee pain and knee osteoarthritis in case of overloading. On the other hand, it should be evaluated if the Achilles tendon can increase the chance of knee osteoarthritis or it is an irrelevant factor.
The third research question of this thesis: In the previous studies, reduced ankle plantarflexion moments, plantarflexion joint power (moment multiply by angular velocity) were found during walking in the injured side of unilateral ATR patients. However, little is known regarding ankle joint mechanics during high demand sporting tasks such as jogging and running after an ATR.
It is also unclear in what way is the ankle-knee relationship effected by the ATR and whether it can cause negative long-term effect on the joints?
The third objective of this thesis: To reveal how the kinematics (trajectory of the center of pressure) and the kinetics (joint moments, gastrocnemius medialis, gastrocnemius lateralis, soleus and ankle joint reaction forces) of the ankle joint can be realistically estimated during walking and especially high demand sporting tasks consists of jogging and running. In addition, long-term physical effects are also addressed and explained in this part.
It is supposed that side to side gait variable differences, found between lower limbs, may be related to the AT elongation of surgical repaired side. The previous part revealed that gait asymmetry, in a higher degree, exist after surgical repair in case of patients with unilateral ATR history. However, few information was reported about the muscular contribution with ATR in case of normal daily activities like walking, jogging and running. Therefore, this part aimed to reveal how gastrocnemius and soleus muscles contribute to walking/jogging/running tasks, and investigate the inter-limb (injured and non-injured side) joint loading characteristics via subject-specific musculoskeletal modeling. The modelling process has been carried out in several steps, as follows:
First, the evaluation of bilateral AT lengths by ultrasound imaging and magnetic resonance imaging (MRI). By this method, I could reconstruct the geometry of the AT to serve as an input for the subject-specific model in the OpenSim software.
Second, data were collected from the experimental part of the thesis to serve as input, for the subject-specific modell in the OpenSim software. These data are: three- dimensional marker trajectories, ground reaction forces (GRF) and surface electromyography (sEMG).
Third, subject-specific musculoskeletal models were created to compute joint kinematics, joint moments, muscle forces and joint reaction forces in the OpenSim software.
Forth, based on the simulation results, one-dimensional statistical parametric mapping (SPM1d) with a two-sample t-test was conducted to assess differences over a stance phase on the variables of interest between the injured and uninjured sides.
It has been concluded that AT lengths were significantly (cca. 10%) longer in the injured side. The side-to-side triceps surae muscle-strength deficits were combined with decreased plantarflexion angles and moments in the injured leg during walking, jogging and running.
However, the increased knee-extensor femur muscle forces were associated with greater knee extension degrees and moments in the injured limb during all tasks. Greater knee joint moments and joint reaction forces versus decreased ankle joint moments and joint reaction forces in the injured side indicate elevated knee joint loads compared with reduced ankle joint loads that are present during normal activities after an ATR. In the frontal plane, increased subtalar inversion angles and eversion moments in the injured side were demonstrated only during jogging and running, which were regarded as an indicator for greater medial knee joint loading. After an
ATR, the elongated AT accompanied by decreased ankle plantarflexion degrees and calf muscle strength deficits indicate ankle joint function impairment in the injured leg. Practically, this means that the force-transmission efficiency of the injured side is heavily. In addition, increased knee extensor muscle strength and knee joint loads may be a possible compensation mechanism for decreased ankle function. These data suggest that patients after an ATR may suffer from increased injury risk due to knee overuse.
The results, obtained from the experiments and the simulation, will provide implications on designing optimal rehabilitation movements. This workflow will show the most significant factors that contribute to rehabilitation and how these factors can be changed by alteration in external load, position and execution of the exercises. The individual tendon properties and computational workflow can be used to investigate which rehabilitation exercise will provide an optimal loading stimulus for athletes or simple patients.
In summary, this dissertation innovates a multidisciplinary approach combining biomechanics, sports medicine, rehabilitation sciences and medical imaging. A combined experimental and computational workflow was created to model inter-limb asymmetry, muscular contribution and joint loading to reveal the mechanism and effect of ATR during normal activities.
Abbreviations
AT: Achilles tendon SH: shod
ATR: Achilles tendon rupture HO: heel-off ATRs: Achilles tendon ruptures TC: toe contact ATRS: Achilles tendon rupture
score
sEMG: surface electromyography
TB: tibia SPM1d: one-dimensional statistical
parametric mapping
HF: hindfoot ICC: intraclass correlation efficient
FF: forefoot MVIC: maximal voluntary isometric
contraction
HX: hallux ATL: Achilles tendon length
GRF: ground reaction force IS: injured side
DF: dorsiflexion US: uninjured side
PF: plantarflexion MG: gastrocnemius medialis
SP: supination LG: gastrocnemius lateralis
PR: pronation SL: soleus
ADD: adduction IK: inverse kinematics
ABD: abduction ID: inverse dynamics
IV: inversion RRA: residual reduction algorithm
EV: eversion SO: static optimization
COM: center of mass IC: initial contact TO: toe-off
OFM: Oxford foot model PIG: plug-in-gait
ROM: range of motion BMI: body mass index HC: heel contact
RMS: root mean square
List of Figures
Figure 1 (a) Anatomy of the AT; (b) The poor blood supply region of Achilles tendon (Egger and Berkowitz, 2017, used by permission) ... 21 Figure 2 Stress-strain curve of AT and a schematic view of the surgical technique used
(Karlsson et al., 2019, used by permission). ... 24 Figure 3 Functional divisions of the gait cycle (Perry and Burnfield, 2010, used by
permission). ... 28 Figure 4 Steps for generating a muscle-driven simulation of a subject’s motion with
SimTrack (Delp et al., 2007), used by permission. ... 30 Figure 5 Hill-type model of muscle used to estimate tendon and muscle force (Rajagopal
et al., 2016). used by permission... 31 Figure 6 (A) Musculoskeletal model used to generate three-dimensional simulations of
walking for eight subjects, each walking at four speeds (very slow, slow, free, and fast) (Liu et al., 2008); (B) Snapshots from a simulation of the running gait cycle (Hamner et al., 2010), used by permission. ... 33 Figure 7 Illustration of OpenSim musculoskeletal model with different jumping and
landing patterns; (A) Counter movement jump; (B) Single-leg jump landing; (C) Standing long jump. (Morgan et al., 2014) (Palmieri, Callegari, & Fioretti, 2015).
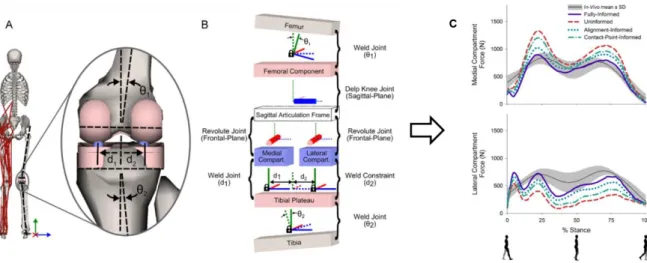
Used by permission. ... 36 Figure 8 Graphical (A) and schematic (B) depictions of the medial/lateral compartment
joint structures in the musculoskeletal model; (C) Medial (top) and lateral (bottom) compartment tibiofemoral contact forces during stance (Lerner, DeMers, Delp, &
Browning, 2015), used by permission. ... 37 Figure 9 (A) MRI-based patient-specific foot-ankle model; (B, C) to define motion axis
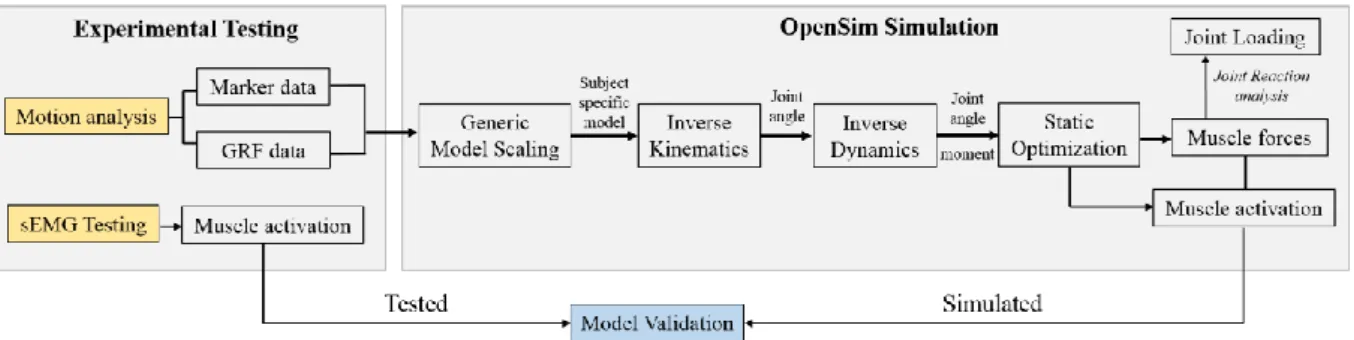
and muscle tendon insertion points; (D) for the comparative analysis of ankle joint reaction force. (Prinold et al., 2016), used by permission. ... 39 Figure 10 Data processing flow chart, from experimental testing to OpenSim simulation.
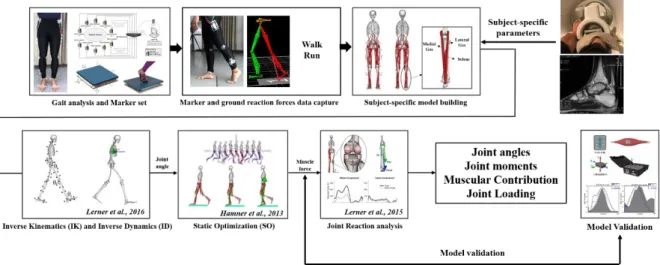
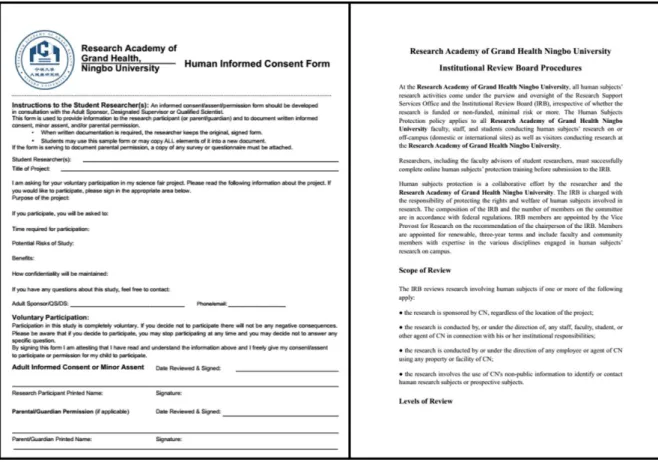
Note. GRF: ground reaction force; sEMG: surface electromyography. ... 49 Figure 11 Experimental and computational process flowchart. ... 50 Figure 12 The human informed consent form and institutional review board procedures.
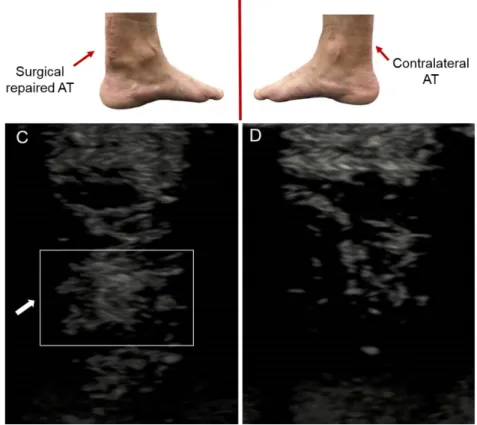
... 51 Figure 13 Experimental set-up (not on scale). ... 52 Figure 14 Ultrasonography images in the sagittal (longitudinal) plane of the (A) AT
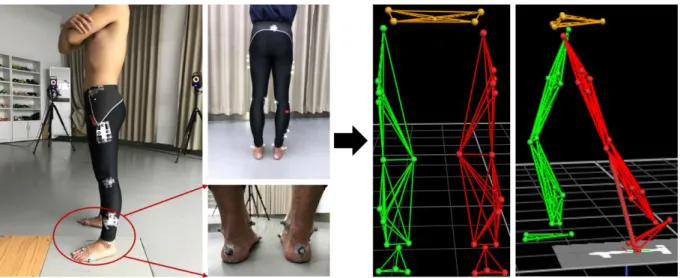
injured side and (B) AT uninjured side. ... 53 Figure 15 Ultrasonography images in the transverse plane of the (C) AT injured side and (D) AT uninjured side. ... 53 Figure 16 Magnetic resonance imaging for the participants. ... 54 Figure 17 Three dimensional motion capture for the lower extremities. ... 55 Figure 18 The illustration of cut-off points (I-V) for stance phase division. Note. I: first
foot contact (FFC); II: first metatarsal contact (FMC); III: forefoot flat (FFF); IV:
heel off (HO); V: toe off (TO). ... 56 Figure 19 The Delsys surface electromyography devices (https://www.delsys.com/). ... 56 Figure 20 The placement of the EMG electrodes on the lower limbs. ... 57
Figure 21 The scaling flowchart (left) and the operating principle (right). Experimental marker positions are measured with motion capture equipment (dark blue). Virtual markers are placed on a model in anatomical correspondence
(https://simtkconfluence.stanford.edu/display/OpenSim/How+Scaling+Works). .... 58 Figure 22 Schematic depiction of the subject-specific musculoskeletal modeling used in
this dissertation. a) The generic musculoskeletal model is scaled for each subject using experimental markers placed on anatomical landmarks. b) The slack AT length of the injured side was measured with an ultrasound of each subject to obtain subject-specific parameters. c) Graphic depiction of modifying gas_med, gas_lat and soleus musculo-tendon parameters. Note. Gas Med: gastrocnemius medialis, Gas Lat: gastrocnemius lateralis. ... 59 Figure 23 Comparison of muscle activations from static optimization estimated (blue
line) and filtered electromyography (EMG) signals measured from the subjects during the same trial of normal walking, jogging and running. Note. EMG and activations were normalized from zero to one for each subject based upon the minimum and maximum values over the stance phase. ... 61 Figure 24 The knee joint adduction moments and joint reaction forces between injured
and uninjured limbs during walking, jogging and running. ... 67 Figure 25 The comparison of plantar pressure during walking between injured and
uninjured side. ... 68 Figure 26 The comparison of plantar pressure during running between injured and
uninjured side. ... 69 Figure 27 In the first line (center of pressure trajectories),“a” and “b” represent COP
trajectory between Uninjured and injured leg during walking, “c” and “d”
represent COP trajectory between Uninjured and injured leg during running; In the second line, higher ankle inversion moments were found in the injured side during walking and running. ... 70 Figure 28 Mean and standard deviation lower extremity joint angle waveforms over
stance phase (100%) for the uninjured side (yellow) and injured side (blue) during self-selected speed walking, jogging and running. Grey shaded regions on graphs indicate a significant difference between the two sides (p<0.05) from SPM1d
analyses. ... 72 Figure 29 Mean and standard deviation of lower extremity joint moment waveforms over
stance for the uninjured side (yellow) and injured side (blue) during self-selected speed walking, jogging and running. Grey shaded regions on graphs indicate a significant difference between the two sides (p<0.05) from SPM1d analyses. ... 73 Figure 30 Mean and standard deviation of estimated vas_med (vastus medialis), vas_lat
(vastus lateralis), vas_inter (vastus intermedius) and rectus femoris musculo-tendon forces waveforms over stance between uninjured side (yellow) and injured side (blue) during walking, jogging and running. Grey shaded regions on graphs indicate a significant difference between the two sides (p<0.05) from SPM1d
analyses. ... 75 Figure 31 Mean and standard deviation of estimated gas_med (gastrocnemius medialis), gas_lat (gastrocnemius lateralis) and soleus musculo-tendon forces waveforms over
stance between uninjured side (yellow) and injured side (blue) during walking, jogging and running. Grey shaded regions on graphs indicate a significant
difference between the two sides (p<0.05) from SPM1d analyses. ... 76 Figure 32 The compared estimated triceps surae muscle forces between patient-specific
from this dissertation and study from Modenese et al., 2018, used by permission. .. 77 Figure 33 Mean and standard deviation of estimated joint reaction forces waveforms
over stance at the hip, knee and ankle joints for uninjured side (yellow) and injured side (blue) during walking, jogging and running. Grey shaded regions on graphs indicate a significant difference between the two sides (p<0.05) from SPM1d
analyses. ... 78 Figure 34 The center of pressure (COP) trajectories in the injured and uninjured sides 92
List of Tables
Table 1 Subject AT length details (n=6). The gastrocnemii and soleus AT lengths (ATL) of each subject were measured for both the injured and uninjured sides. ... 63 Table 2 Comparisons of kinematic variables between injured side and un-injured side
during walking and running... 64 Table 3 Comparison of Angular velocity variables between injured side and uninjured
side during walking and running. ... 65 Table 4 Comparison of kinetic variables between injured limb and uninjured limb during walking and running. ... 66 Table 5 Differences of selected biomechanical variables in symmetry angles (SA)
between walking and running. ... 71
1. Introduction
1.1 Achilles tendon (AT) and human movement 1.1.1 The anatomy of the Achilles tendon
The AT is the largest and thickest tendon structure in the body, consisting of the calf triceps tendon (which includes the medial- and lateral gastrocnemius and the soleus muscle). However, the AT of some people are composed only of calf triceps tendon, accounting for 6% to 8% of the total population. The AT has a unique behavior since it rotates 90° during its distal travel and ends at the posterior calcaneus. Unlike other parts of the tendon, the AT does not have a true synovial sheath. The AT is composed of para-orbital tissues, which are divided into visceral and parietal layers, and they are called as adventitia and intima (Doral et al., 2010). The artery is worn in front of the capsule and penetrates the anterior capsule to nourish the AT. The inner surface of the film has a plurality of lubricating structures composed of a thin layer of mucopolysaccharide. This facilitates the sliding of the AT in the film where the maximum relative sliding distance is about 15 mm. The tendon sheath is composed of connective tissues, rich in blood vessels, as it is seen on Figure 1(a) (Egger & Berkowitz, 2017).
Figure 1 (a) Anatomy of the AT; (b) The poor blood supply region of Achilles tendon (Egger and Berkowitz, 2017, used by permission)
A clear understanding of the Achilles blood supply is crucially important to the surgeon. The posterior tibial artery recirculates through the abdomen and the abdomen junction to nourish the proximal part of the AT. The anterior tibial artery and the osteogenesis branch include a number of perforating arteries behind the humerus to nourish the distal part of the AT. It must be noted, that nuclear medicine research has shown that AT has the worst blood supply in the following range: if calcaneus is taken as an origin, the AT has a poor blood supply in its length between 2 to 6 cm, horizontally measured, as shown in Figure 1 (b). Further research has shown that as age increases, the number of blood vessels in the AT will be further reduced. This may be the reason why the risk of AT injury increases with age (O’Brien, 2005).
Many AT diseases are closely related to their surrounding structural lesions. For example, patients with Haglund malformations (abnormal protrusions behind the lateral wall of the calcaneus) are more prone to have post-calcaneal bursitis and mechanical irritations of the AT.
It must be noted that AT is mainly composed of collagen, elastin, mucopolysaccharide, and glycoprotein (Ganestam, Barfod, Klit, & Troelsen, 2013). Type I and type III collagen are produced by mature fibroblasts in the AT. 95% of the normal AT is composed of type I collagen.
After the ATR, the proportion of type III collagen in the AT increases, which may eventually lead to a decrease in the strength of the AT. As the age increases, the density of fibroblasts, the diameter of collagen fibers, and the density of collagen fibers in the AT decrease, causing a decrease in the strength of AT fibers (Hansen et al., 2013). That is the reason for higher injury risk to AT in elder athletes.
1.1.2 The biomechanical function of Achilles tendon
The AT is a key structure in the lower limb since it transmits force upward through the joint chain and further consumes energy through the bone and soft tissues (Müller, Siebert, &
Blickhan, 2012). This process takes place as follows: the AT stores energy in the early stage of ground contact and releases energy in the push-off of the stance phase. Farris et al. found that the contribution of the AT to the ankle joint during running was more than 50% (Farris, Trewartha, & Polly McGuigan, 2011). Therefore, AT is related to the improvement of running economy. Larger AT stiffness can significantly reduce oxygen consumption, while longer AT arms can improve running economy by reducing the required muscle activity (Kubo, Tabata, Ikebukuro, Igarashi, & Tsunoda, 2010; Fletcher, Esau, & MacIntosh, 2010; Kunimasa et al., 2014).
With regard to the stiffness of the AT, studies have shown that the load that AT could withstand is the largest in the body. At full speed run, the peak load of the AT is about 12.5 times the bodyweight (about 9000N) while during jumping or shuttle run, the peak load of the AT can reach 1000~4000N (Lorimer & Hume, 2014). AT is highly sensitive to mechanical stimuli, therefore regular exercise can increase the diameter of the AT, while less activity results in a decrease in the diameter (Bramble & Lieberman, 2004; Lorimer & Hume, 2016). By controlling the amount of exercise, it is possible to effectively increase the collagen content, increase the diameter of the collagen fibers, and thereby improve the quality of the AT (O’Neill, Watson, & Barry, 2016).
With respect to the biomechanical characterization of the aforementioned tendon, we must note that recent biomechanical studies have mainly used ultrasound systems to study the functions and characteristics of the AT, including AT length and cross-sectional area. Ueno et al. compared the AT cross-sectional area of numerous athletes under three different speeds and the AT length at three different positions (the calcaneal tubercle to the medial head of the gastrocnemius/the lateral head of the gastrocnemius/the point of junction of soleus and AT) (Ueno et al., 2018).
They concluded that AT connected to the medial head of gastrocnemius had showed a reduction in energy consumption, while the cross-sectional area of AT was not significantly related to running economy (Ueno et al., 2018). These results suggest that a longer AT connected to the medial head of the gastrocnemius may be more beneficial for middle and long- distance runners to achieve superior running performance (Hunter et al., 2011). This is consistent with the results of previous studies. The improvement of the mechanical properties of the AT after training is not mainly achieved by hypertrophy. This may be because fewer blood vessels are distributed in the AT accompanied with a slower metabolism and recovery process. The increase in elastic modulus and stiffness after training indicates that the AT will undergo adaptive changes after training to withstand higher stress. Since AT cannot do work alone, it is intrinsically linked to the movement of the triceps and the ankle joints of the calf, while it is indirectly related to the proximal muscles and their joint movements. Compared with healthy runners, the runners with AT diseases are in a more inverted posture when they touch the ground, and the heel joints show a more everted posture after the heel touches the ground.
It has been also proven that muscle activation decreases during the load-bearing period (Baur et al., 2011). Achilles tendinopathy does not seem to affect neuromuscular control but may affect the output of the lower limb mechanical power during the stance period, thereby affecting joint stability. Consequently, when discussing complex AT injuries, it is not possible to consider only the mechanical properties and functions of the AT itself.
At the end, with regard to its physiology, the latest epidemiological survey shows that Achilles tendinopathy is the most common and most difficult injury to cure among the medium and long-distance runners and its incidence can reach 8% to 15% (Arampatzis, Peper, Bierbaum,
& Albracht, 2010). It is well known in sport science, that AT injury seriously reduces the athletic performance of professional athletes, ultimately leading to ATR or early termination of athlete career (Munteanu & Barton, 2011). Here it must be mentioned, that the incomplete recovery of the Achilles tendinopathy after a long period of abnormal force are the primary causes of ATR (Khan, Cook, Kannus, Maffulli, & Bonar, 2002).
1.1.3 Achilles tendon pathology and ruptures
The incidence of ATR continues to grow, due to the fact that there are fewer daily activities and more “weekend warriors” (people who participate in sports only on weekends). Facts about the ATR are as follows: the age of high incidence is between 30 to 40, the ratio of male to female gradually changes from 2:1 to 19:1, the incidence on the left side is higher than on the right side while 75% of acute ATR is associated with exercise. Incidences regarded to the right side may be due to the fact that the right leg is more often used to pushing the weight to the left leg (Egger & Berkowitz, 2017). It is worth noting that 80% of the ATR occurs in the range of 2 to 6 cm above the AT. High-risk factors for ATR include a sedentary lifestyle, corticosteroid injection (leading to local collagen necrosis), use of anabolic steroids (resulting in abnormal collagen hyperplasia to reduce AT strength), hyperthyroidism, incomplete renal function, gout,
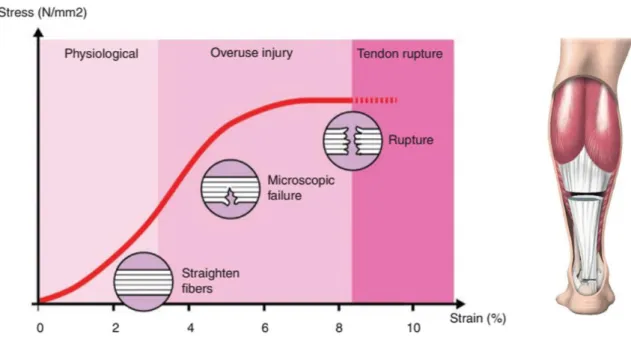
atherosclerosis, and the use of fluoroquinolones. In addition, cardiovascular issues can also lead to the risk of ATR (Magnan, Bondi, Pierantoni, & Samaila, 2014). Naturally, acute ATR usually occurs when mechanical overload acts on the gradual degeneration of the AT. Sedentary can lead to a decrease in local blood vessels in the AT, which makes it difficult to repair the micro-injury; such damage gradually accumulates and eventually leads to macroscopic fracture (as shown in Figure 2). This theory is supported by the fact that 15% of patients have local symptoms before having an ATR. These typical manifestations or symptoms of acute ATR include pain in the posterior malleolus, difficulty in lifting, weakness in the knee, and a sound of fracture when injured (Hess, 2010).
Figure 2 Stress-strain curve of AT and a schematic view of the surgical technique used (Karlsson et al., 2019, used by permission).
The mechanism of injury can be related to rapid plantarflexion movements in the ankle joint when the soleus muscle contracts. This can be explained as follows: when stepping on the edge of the sidewalk, the knee is in full extension while at the same time the ankle joint is in complete plantarflexion. In this moment a huge ankle dorsiflexion force is exerted on the foot likewise as an athlete jumps or falls from a height. This dorsiflexion force can rupture the AT suddenly.
As a results, local swelling and ecchymosis can be seen during a physical examination, and obvious tender points and AT defects can be reached (Hess, 2010). Compared with the contralateral limbs, the passive lateral extension of the affected side increases and the plantar flexion is weakened. The bilateral contrast Thompson test is often used to assess the patient's active plantar flexion function and to effectively remove the false-negative test results caused by long flexor tendon assisted plantar flexion. It is also important to assess the resting position of the injured side of the AT. The patient should remain in a prone position during the examination (Lorimer & Hume, 2014). An increase in the resting position of the AT may indicate an increase in the ATR.
Since the trauma is mainly diagnosed based on typical medical history and physical examination results, further imaging examination is required only when the medical history and physical examination results are not clear.
The “Kager Triangle” in the X-ray film, the high translucent area at the AT, and the avulsion fracture of the calcaneus are typical imaging findings. If the ultrasound shows low echo zone at the AT, that means the density is lower compared to normal tissues, which is a clear diagnosis for rupture. (N. Maffulli, Regine, Angelillo, Capasso, & Filice, 1987).
Chan’s dynamic ultrasound study showed no significant difference in the incidence of ATR after non-surgical or surgical treatment in patients with a hernia stump separation of less than 5 mm (Chan et al., 2011). Although ultrasonography can measure the distance separating the AT, its reliability is closely related to operator proficiency; in this respect, its reliability is not as good as MRI. Although MRI is more expensive and time-consuming, it has an advantage in assessing the degree of ATR and surrounding tissue damage. MRI will reflect the interruption signal of the ATR on the Tl and T2 phases (Khan et al., 2003). Postoperative rehabilitation includes a short intertemporal brake and early functional exercise. Athletes can achieve satisfactory functions through rehabilitation training with increasing postoperative strength, including joint activity training starting 72 hours after surgery, bed-away training with 2 weeks postoperatively, and complete weight-bearing training after 6 weeks.
Through this training, 93% of athletes can rejoin the competition about 6 months after surgery. Only 2% to 3% of patients will feel the loss of plantar flexion force (Nilsson-Helander et al., 2010). In addition, the use of gypsum brakes after surgery is better than traditional plaster fixation, which can reduce the incidence of postoperative adhesions, paresthesia, scar hypertrophy, infection, and other complications (Gwynne-Jones & Sims, 2011).
1.2 Human gait analysis
1.2.1 The state-of-the-art of human gait analysis
The generalized definition of gait is a pattern in which the limbs of animals move on a solid surface. The gait patterns vary greatly between different species due to the anatomical structure.
The same species can select a variety of different gait patterns according to different moving speed, ground conditions and functional requirements (Shapiro, Zernicke, Gregor, & Diestel, 1981). Bipedalism walking is one of the characteristics that distinguish human beings from other animal species (McGrath et al., 2019). Humans only use the lower limbs to carry out walking. It is the result of the long-term evolution of species in the gravitational environment.
One study found that this walking mode only consumes a quarter of four feet of energy (Bennett et al., 2009). Clinical gait analysis refers specifically to the behavior and manner of human physical activity. Walking is the basic movement during human daily life, which is the ability acquired and continuously practiced in the process of growth and development. Through repeated learning and adjustment, human beings gradually form walking pattern suitable for themselves. This process is the result of the establishment of neural pathways and the coordinated development of muscles. It reflects the ability of central nervous system to control peripheral and skeletal muscles (Stolwijk et al., 2014).
Gait analysis can be used for the examination and evaluation of individual activities by different ways. The most commonly used is the assessment of walking on the ground, followed by running, jumping, up and downstairs (Simon, 1993). Quantitative gait analysis is an important clinical tool for distinguishing normal and abnormal gait pattern. Early gait analysis was performed by taking continuous photos, however it was soon disregarded due to the limited technology, poor accuracy and the fact that only general description could be made (Davis, Õunpuu, Tyburski, & Gage, 1991).
With the development of motion capture technology, a variety of methods and tools for gait analysis have been developed. One early but still useful technique for quick field testing among athletes is the electronic protractor. This device can be used to measure the instantaneous three- dimensional rotation angle of the lower limb joints, and the accelerometer has been used as an indirect measurement tool for the angular displacement of the limb. The sagittal displacements can be calculated by performing intermittent optical photography with a reflective markers attached to important anatomical landmarks (Whittle, 2007). The photographic images can also be converted into three-dimensional movement patterns. In the past decade, two-three dimensional (2D/3D) motion capture technology has been developed and utilized to meet the need of more precise kinematic analysis. These techniques use a simple perspective image and a pre-stored 3D model to match the marker position and silhouette contours in the perspective (Wren, Gorton, Õunpuu, & Tucker, 2011). By doing this, the position of the model can be reconstructed, and if a series of image processing is completed, the relative motion of the joints can be calculated.
Currently, it is only used for scientific research purposes, especially artificial joint prosthesis and wear analysis, and it is unlikely to be carried out on a large scale (Muro-de-la-Herran, García-Zapirain, & Méndez-Zorrilla, 2014).
The commonly used three-dimensional gait analysis system usually consists of three parts:
a motion capture system for capturing three-dimensional motion trajectories of reflective markers; a force measuring platform for collecting ground reaction forces; and a surface electromyography (sEMG) device. The motion capture system is generally composed of more than six high-resolution infrared cameras. According to the special spatial position arrangement, the infrared reflective marker ball is attached to each anatomical landmark of the human body during data acquisition (Carse, Meadows, Bowers, & Rowe, 2013). The camera can capture the three-dimensional coordinate positions of the marker set in the space and by the use of inverse kinematics algorithm, the joint motions can be calculated (Ceseracciu, Sawacha, &
Cobelli, 2014). The force platform is generally installed in the ground, while the force and its direction can be recorded when the subject walks over the force plate (Ismadi Ismail, 2018).
The surface EMG system is attached to the skin surface through the electrode slices, while the main muscle EMG signals at different time steps, during walking, are being recorded. The collected data include the relative position and direction of various parts of the body, the force between the foot and the ground, the time-space relationship, and the activity of the lower limb muscles (Bovi, Rabuffetti, Mazzoleni, & Ferrarin, 2011).
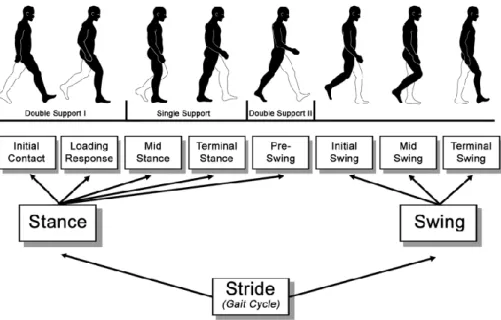
The three systems are integrated via a computer software to maintain consistency in data collection during motion capture. The human gait is biphasic, and the gait cycle can be divided into two parts according to the position of the limb in the gait cycle: the stance phase and the swing phase (Figure 3). The stance phase accounts for around 60% of the entire gait cycle. In the stance phase, one side of the lower limb carries most of the body weight. The swing phase accounts for around 40% of the entire gait cycle, and in the swing phase, the bodyweight is carried by the contralateral side (Mummolo, Mangialardi, & Kim, 2013). The stance phase could be further divided into heel strikes, mid-stance and push-off phases. These phases are named according to the position of the ipsilateral foot. The swing phase is further divided into an acceleration phase, an intermediate phase, and a deceleration phase (Figure 3). The lower limbs swing forward in the acceleration phase, catching up and surpassing the torso. While the lower limbs swinging in the deceleration phase prepare the heel to strike the ground and begin the next stance phase. However, the actual human walking gait is much more complicated than this division. The above-mentioned gait cycle detection is only a general simplification of the human walking gait. However, this division creates a convenient and widely-accepted protocol to analyze the muscle contraction changes of the lower limb joints during the gait cycle (Kharb, Saini, Jain, & Dhiman, 2011).
Figure 3 Functional divisions of the gait cycle (Perry and Burnfield, 2010, used by permission).
Gait consists of a series of gait cycles. In each gait cycle, a series of gait events are produced that mark changes in the gait phase. The gait phase includes the swing phase and the stance phase, and each phase is divided into early, middle, and late phases, and there is a pre-swing phase for the swing phase. The gait phase is distinguished by a gait event that includes the heel strike, the plantar contact, the heel push-off, and the toe-off the ground (Pistacchi et al., 2017).
One side of the heel strikes the ground to toe-off the ground as a stance phase of the side foot.
Gait analysis refers to the measurement and description of the skeletal muscle function of the human body during exercise and quantitative assessment during rehabilitation assessment and physical therapy through biomechanical methods (Esquenazi, 2014). Objectively and quantitatively reveals the walking function and comprehensively reflects the patients’
rehabilitation. Gait analysis often contributes to clinical diagnosis and efficacy evaluation.
Through gait analysis, we can calculate the spatial-temporal, kinematic, kinetic parameters, etc., and make some guidance for the clinical intervention (Fukuchi, Fukuchi, & Duarte, 2018).
1.2.2 Gait analysis used in functional assessment and rehabilitation
Rehabilitation refers to the patient's ability to regain and adapt to normal life. The purpose of rehabilitation is to comprehensively and coordinately use various methods such as medicine, education, occupation, society, and engineering to reduce the physical and mental dysfunction of the disabled and to exert their highest potential to help them return society and improve the quality of life (Cimolin & Galli, 2014). Rehabilitation mainly includes assessment and treatment. Assessment is physiological check-up on the functional progress of the patient.
Treatment refers to planning and designing therapeutic programs using various methods after a clear understanding of the location and extent of the obstacles (Ornetti et al., 2010; Montero- Odasso, Verghese, Beauchet, & Hausdorff, 2012).
In the evaluation of rehabilitation effects, the general methods and contents of sports evaluation include: muscle tension, muscle strength, measurement of joint range of motion, assessment of balance and coordination function and finally gait evaluation.
Since muscle tension, muscle strength, joint range of motion, and balance are ultimately reflected in walking, so gait is the most intuitive response to exercise ability (Lienhard, Schneider, & Maffiuletti, 2013). Therefore, gait functional evaluation is based on gait analysis.
The purpose is to evaluate the gait of the person and obtain the rehabilitation or disease status by comparing the gait parameters (Leardini et al., 2014). It must be mentioned that the motion control mechanism is highly complicated, including the central command, body balance, and coordinated control, involving the joint operation of the lower limbs muscles (Nadeau, Betschart, & Bethoux, 2013). Any of the problems associated with the reproduction of normal gait or the interconnection of various links may affect the gait performance, resulting in abnormal gait pattern. The main causes of abnormal gait can be divided into two categories:
neurological diseases, and non-neurological diseases (Axer, Axer, Sauer, Witte, & Hagemann, 2010). Neurological diseases mainly include stroke, brain trauma, spinal cord injury, cerebral palsy, Parkinson’s disease whilst non-neurological diseases are mainly caused by sports injuries, bone, and joint diseases, congenital malformations, amputations, and surgery (Kainz et al., 2017).
The rehabilitation process of ATR patients is divided into four stages: inflammation, hyperplasia, plasticization, and maturity. In the first 6 weeks of healing (inflammation and proliferative phase), AT is the most vulnerable, and the intensity increases slowly over the next 6 weeks to 12 months (molding and mature). Patient rehabilitation is a standard functional recovery process (Matt L. Costa, 2005). At present, gait analysis is applied to sports injury rehabilitation. The following problems exist:
1. Generally, research and clinical practice set the focus on the evaluation of rehabilitation on the large joints such as the hip, knee, and ankle (Oda, Sano, Kunimasa, Komi, &
Ishikawa, 2017) based on the comparison of the population with and without lower limb injury history. This evaluation was carried out to investigate the correlation between the gait parameters and the amplitude of the parameter curve (Mezzarobba et al., 2013).
However, the application of foot inter-segmental joint motion characteristics and gait parameters in the rehabilitation of athlete's foot-related injuries are still quite limited (Dubbeldam et al., 2010; Sun, Fekete, Mei, & Gu, 2019).
2. Lack of gait comprehensive evaluation indicators. At present, gait evaluation method mainly finds the problem by comparing the individual with the normal range and lacks an intuitive score, which is difficult to be directly applied to any population for precise diagnosis (Sun, Fekete, Baker, & Gu, 2019).
3. Treatment and rehabilitation evaluation are not synchronized. Few studies combine them to do the real-time treatment and evaluation system. The real-time synchronization technology of rehabilitation treatment and evaluation can provide timely feedback to therapists and patients, which could help patients to adjust their rehabilitation strategies and to accelerate their recovery (Van Den Bogert, Geijtenbeek, Even-Zohar, Steenbrink, & Hardin, 2013).
1.3 Musculoskeletal modeling based on OpenSim software 1.3.1 Introduction of OpenSim software
At present, experts and scholars in the field of sports biomechanics often use VICON Motion System and other infrared capture systems based on optical principles, high-speed camera, photography and other equipment to record the movement of the human body. Then input the data into Visual 3D, VICON Nexus and other motion analysis software to analyze the human motion and the movement characteristics of each joint. However, the traditional motion analysis method has several deficits in detecting of human motion characteristics e.g. is difficult to measure dynamically large amount of important information, like muscle forces intensity, in the laboratory.
OpenSim is an open source software based on C++ and JAVA for musculoskeletal model building, simulation, and analysis (website: https://simtk.org/). The OpenSim software dynamically simulates human motion to study muscle geometry, muscle-tendon properties, muscle forces and joint reaction forces generated by muscles (Delp et al., 2007). OpenSim includes a computing tool (SimTrack) and related algorithms for users to study and analyze static model optimization and dynamic visualization of human musculoskeletal models. In OpenSim software, the musculoskeletal model consists of bones that are connected by joints and muscle-tendon units that span the joints and generate forces to drive various human motion.
In addition, the software is designed to provide collaborative tools and platforms for biomechanics researchers to develop, share and extend the simulation of musculoskeletal models (E. M. Arnold, Ward, Lieber, & Delp, 2010; Pandy & Andriacchi, 2010; Rajagopal et al., 2016), as shown in Figure 4.
Figure 4 Steps for generating a muscle-driven simulation of a subject’s motion with SimTrack (Delp et al., 2007), used by permission.
The operation steps of the SimTrack tool include four steps:
Step 1: Input the subject’s relevant anthropometric data and static model experimental data to scale and calibrate the dynamic musculoskeletal model;
Step 2: Input experimental kinematics data combined with the scaled musculoskeletal model using Inverse Kinematics (IK) tool to calculate and obtain joint kinematics;
Step 3: Input the experimentally measured ground reaction force data combined with joint kinematics, using Inverse Dynamics (ID) and Residual Reduction Algorithm (RRA) to reduce the error between simulated and experimental data;
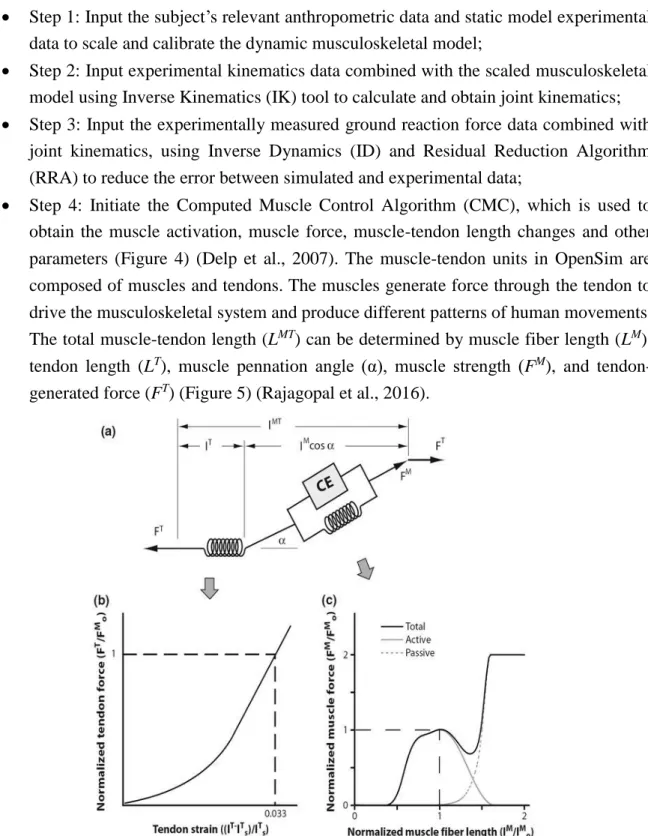
Step 4: Initiate the Computed Muscle Control Algorithm (CMC), which is used to obtain the muscle activation, muscle force, muscle-tendon length changes and other parameters (Figure 4) (Delp et al., 2007). The muscle-tendon units in OpenSim are composed of muscles and tendons. The muscles generate force through the tendon to drive the musculoskeletal system and produce different patterns of human movements.
The total muscle-tendon length (LMT) can be determined by muscle fiber length (LM), tendon length (LT), muscle pennation angle (α), muscle strength (FM), and tendon- generated force (FT) (Figure 5) (Rajagopal et al., 2016).
Figure 5 Hill-type model of muscle used to estimate tendon and muscle force (Rajagopal et al., 2016). used by permission.
OpenSim simulation analysis can establish and clarify the quantification and causal relationship between neuromuscular activation patterns, muscle strength, and geometric changes, external reaction forces and motion patterns obtained from laboratory tests.
The aim is to explore the changes in the above-mentioned principle mechanism during abnormal movement by revealing the functional principle of muscle coordination control and to predict potential rehabilitation treatment plans. The program can enable us to acquire functional characteristics on special groups such as people with obesity, diabetes, hemiplegia, as well as knee- or other sort of arthritis (Pandy & Andriacchi, 2010).
1.3.2 OpenSim lower extremity modeling in human basic movements
WALKING
At different walking speeds, the spatial-temporal parameters, joint angle, joint moment and plantar pressure distribution show different characteristics, so the level of muscle activity that provides the power also shows a certain difference (Sun, Fekete, Mei, & Gu, 2018). Arnold et al found that with the increase of walking speed, the knee joint flexion angular velocity increased at the end of the stance phase, and knee joint extension angular velocity increased immediately after push-off (A. S. Arnold, Schwartz, Thelen, & Delp, 2007). This mechanism works as follows: the knee joint accelerates knee flexion at the end of the swing via the use of the quadriceps muscle, which uses 50-70% of its muscle strength during this process.
The swing-related dorsiflexion muscle group, including the hip flexor muscle group, the biceps muscle group, the quadriceps muscle group, the hip extension muscle group and the abductor muscle group show consistent muscle activation variations (A. S. Arnold et al., 2007).
Liu et al. (2008) performed slower (0.54m/s), slow (0.75m/s), comfortable (1.15m/s) and fast (1.56m/s) gait speed for population with no history of any injury. In their study, they used biomechanical testing, combined with OpenSim 2392 model (23 degrees of freedom and 92 muscle-tendon complex). The results from the simulation and experiments showed high consistency, which indicates that the muscle strength output obtained by the OpenSim musculoskeletal model simulation, has high reliability (Liu, Anderson, Schwartz, & Delp, 2008).
With alteration of the external load on the trunk (reducing by leaning forward or increasing by leaning backward 25%, 50% body weight), it was found that the joint kinematics, kinetics and muscle activation outputs from the lower extremity musculoskeletal model were highly inconsistent with the experimental data during walking. Muscle function exhibits the same degree of activation as the torso load increases, and the soleus muscle is the main muscle that satisfies the incremental load during the support and push-off phases (linear correlation coefficient between load increase and soleus muscle excitability R2=0.95, highly relevant) (McGowan, Kram, & Neptune, 2009). The internal and external ground reaction forces (GRFs) during the stance phase and the push-off phase are respectively generated by the lower extremity abductor muscles and the knee extension, plantar flexor and adductor muscle groups (John, Seth, Schwartz, & Delp, 2012).
Subject-specific musculoskeletal model of joints have also been studied. It has been found
that not only the femoral articular surface load increased together with the increment of different (Slow velocity: 0.75m/s, Normal velocity: 1.25m/s, Fast velocity: 1.5m/s) walking speeds (Figure 6), but the flexion, extension and abduction moment of the knee joint, together with compression force of the tibial-femoral joint surface (Lerner, Haight, DeMers, Board, &
Browning, 2014).
It is worthy to note that the similarity and difference of muscle strength exist between individuals in walking gait. The force of soleus muscle (1856.1N) acting on ankle joint is higher than that of gastrocnemius muscle (1232.5N); the foot length (-0.01); the foot width (-0.012) and the arch height index (-0.012) were closely related to the maximum moment of the subtalar joint (p<0.01, r=0.678) (Błażkiewicz, Wiszomirska, Kaczmarczyk, Naemi, & Wit, 2017). The individualized model combined with the subject-specific differences of the population improves the accuracy and pertinence of the simulation outputs, therefore it can be applied to basic research and clinical pathological diagnosis (Knarr & Higginson, 2015).
Figure 6 (A) Musculoskeletal model used to generate three-dimensional simulations of walking for eight subjects, each walking at four speeds (very slow, slow, free, and fast) (Liu et al., 2008); (B) Snapshots from a
simulation of the running gait cycle (Hamner et al., 2010), used by permission.
RUNNING
Another important physical activity with the evolution of human biology to produce an upright walking movement is running. Studies have shown that in running gait, the stance phase accounts for about 31% of the gait cycle, and the swing phase accounts for about 69% of the gait cycle (Bramble & Lieberman, 2004). One important difference between running and gait (with double stance phase) is that running has a period, the so-called ‘Double Float’ when both of the feet are off the ground which creates gaps e.g. during ground reaction force
measurements, but means no hindrance in motion capture.
With increased running speed, the strike pattern transfer from heel strike to forefoot strike, which is the main difference between jogging and sprint running. The former is mainly used for endurance running by aerobic metabolism, the latter is commonly used in short distance sprinting using anaerobic metabolism (Mclean, 2008).
In view of the difference between running and walking, it is more complicated to coordinate the muscle function by the nervous system to provide vertical support and propulsion force for running (Hamner, Seth, & Delp, 2010).
The study found that during the stance phase of running, the quadriceps muscle is the main braking muscle and it balances the center of gravity as well. In the late stance phase of running, the gastrocnemius and the soleus muscles are the main muscles that initiate the acceleration and balance the body center of gravity (Debaere, Delecluse, Aerenhouts, Hagman, & Jonkers, 2013). The coordinated oscillation of the torso and upper arm has less effect on initiating or balancing the acceleration of the center of the body, but stabilizing the vertical angular momentum generated by the lower extremities.
Another study aimed to analyze the different running speeds (2.0m/s, 3.0m/s, 4.0m/s and 5.0m/s), to explore the characteristics of the related muscle activities on human running movements, and to find the soleus muscle contribution for the acceleration of the body center in the vertical direction under different speed conditions (Debaere, Delecluse, Aerenhouts, Hagman, & Jonkers, 2015). It was also reported that other muscle groups (such as gastrocnemius, tibialis anterior, quadriceps and gluteus maximus) also gradually increase the acceleration of the body center of gravity in the vertical and anteroposterior directions during the heel strike and the push-off phases, which indicates an increasing vertical ground reaction force (Debaere et al., 2015).
The muscle-tendon unit geometry that produces the force also changes with the exercise pattern, such as the maximal length of the rectus femoris (119±2%) and the hamstring muscle (125±4%) relative to the rest condition (Hamner & Delp, 2013; Riley, Franz, Dicharry, &
Kerrigan, 2010). The running musculoskeletal model is also used to analyze the technical movements of the short-track sprinting. By analyzing the musculoskeletal movement of sprinting squat-type starting movement, it was found that the hip joint stretched during the first stance phase after the start. The knee flexor muscle group produced more significant power during the action transition, occupying about 54% (hip), 31% (knee) and 15% (ankle) respectively, while the speed was 3.1±0.25m/s. During the second stance phase, the speed increased to 4.28±0.27m/s, and the hip, knee and ankle joints performed 35%, 17% and 48%
respectively. Exploring the effect of related muscle groups on increasing the starting speed, the ankle joint flexor muscles (gastrocnemius and soleus muscle) played a prominent role in the first and second steps, and the gastrocnemius muscle played an even more significant role in the second step, up to 92.9 % (in the first step is 67.1%) (Debaere et al., 2015). The role of the knee joint and the hip joint muscle group showed different effects due to the various starting
positions of the athletes.
As a conclusion of this study it was deduced that the knee joint accelerates the vertical direction of the body center of gravity and the hip joint has a significant effect on the forward and vertical directions of the center of gravity of the body. Further analysis of the starting movements of sprinters with different ages showed that adult athletes relied on the knee joint (35%) for work and produced larger steps and speeds in the first step of the start, while young athletes relied more on hip joints (57%). A study of musculoskeletal models for hurdlers and sprinters revealed differences in geometric and mechanical changes in the soleus and gastrocnemius-Achilles tendon units. Due to hurdle movements, geometric deformation (elongation: 0.031 m respectively for the soleus and the gastrocnemius-Achilles tendon) and the mechanical load on the AT (4066.91±322.56N) was found significantly higher compared to sprint movements (elongation: 0.016 m for the soleus and 0.021 m for the gastrocnemius- Achilles tendon) and load (3361±194.01N) (Li & Zhang, 2013). This research results provide a research basis for the risk of high damage to hurdles. Analysis and clarification of the characteristics of the starting movements at different levels have theoretical guiding significance for the formulation of training plans and strategies.
JUMPING
Jumping is a basic movement in several sports (such as basketball, volleyball, track and field, etc.). According to the difference in the support limb in the final step, the jump is divided into one-legged take-off, two-legged take-off, one-foot landing and two-foot landing (Hackney, Clay, & James, 2016). According to the difference in the completion of the action mode, the jump is further divided into jumping landing and free landing. Based on the differences in jumping movements, the biomechanical characteristics are also different (Vint & Hinrichs, 1996). Studies have shown that the single-leg take-off can provide higher center of gravity elevation by the auxiliary action of the swinging leg. On the contrary, the vacant period of the two-legged take-off is longer; the load distribution characteristics of the lower limb of the drop- landing and the free-falling are also different, resulting in potential injury characteristic differences. For example, anterior cruciate ligament (ACL) injury commonly occurs during landing.
The study found that the risk of ACL injury is not only related to the muscles of the knee joint (such as the quadriceps, the posterior femoral muscle and the gastrocnemius), but also to the muscles that do not cross the knee (such as the soleus muscle). For example, if the muscle strength of the gastrocnemius muscle is activated (flexed) then it will decrease the force submitted to the hamstring muscle during landing. Thus this muscle mechanism will produce immediate protection on the knee joint and it will prevent ACL from injury risk (Mokhtarzadeh et al., 2013).
The above-mentioned information not only reveals the biomechanical functional
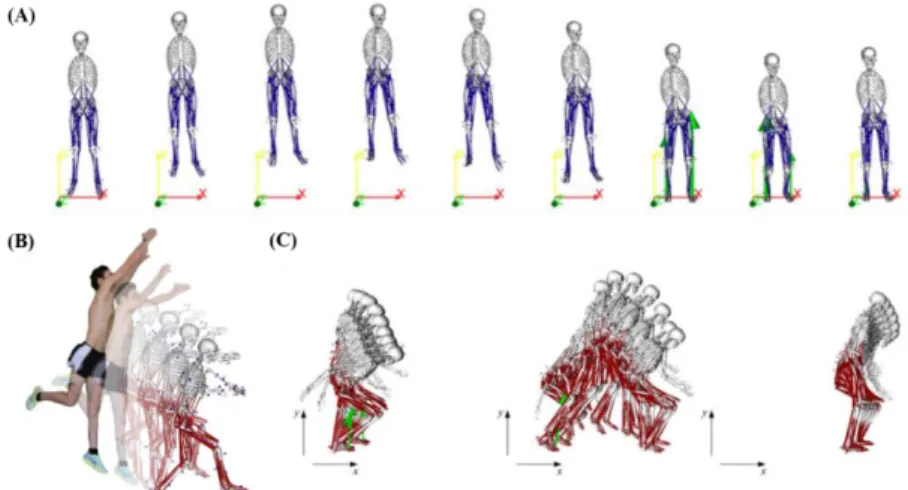
characteristics of the jumping movement, but also has a guiding on preventing injury and carrying out intervention training programs, such as avoiding the injury of the ACL by enhancing the strength of the knee flexor muscle group (Figure 7) (Morgan, Donnelly, &
Reinbolt, 2014).
Figure 7 Illustration of OpenSim musculoskeletal model with different jumping and landing patterns; (A) Counter movement jump; (B) Single-leg jump landing; (C) Standing long jump. (Morgan et al., 2014) (Palmieri,
Callegari, & Fioretti, 2015). Used by permission.
1.3.3 OpenSim lower extremity modeling in pathology gait
OpenSim musculoskeletal model is gradually applied to investigate the mechanism and the characteristics of movement patterns of numerous abnormalities such as joint dysfunction, obesity, diabetes, hemiplegia, hip dysplasia or knee arthritis. According to statistics from the World Health Organization (WHO) in 2016, the global adult population (over 18 years-old) has over 39% overweight and obesity. Children and adolescents (5-18 years old) have over 18%
overweight and obesity (Harris et al., 2017). Obesity has been shown to be associated with several diseases and is a major preventable risk factor for degenerative changes in lower extremity joints, primarily knee joints. Moderate-intensity walking is often used as an exercise to intervene in obesity; however, studies have shown that with body weight gain by 5 kg the risk of knee arthritis will increase by 35% (Figure 8).
Figure 8 Graphical (A) and schematic (B) depictions of the medial/lateral compartment joint structures in the musculoskeletal model; (C) Medial (top) and lateral (bottom) compartment tibiofemoral contact forces during
stance (Lerner, DeMers, Delp, & Browning, 2015), used by permission.
Another example where OpenSim musculoskeletal model can be effectively applied is the investigation of the effect of hemiplegia. This is an undesired brain malfunction which often leads to motor dysfunction in the neuromuscular system. For example, people with cerebral hemiplegic tend to exhibit a “Duchenne” gait, that is, the trunk leans toward dysplasia and keeps the pelvis stable or increases the swinging limb during the single stance phase. It is clinically interpreted as the mechanism of the resistance reduction of the hip abductor muscle group. By constructing an individualized three-dimensional musculoskeletal model, researchers explored the joint torque and power of the trunk to the frontal plane of the hip joint, and found that the trunk lumbar vertebrae in the frontal plane is more active than the normal population (32.48±8.04° vs 16.71±4.36°, p<0.001), and significantly reduced hip torque. While the torque and power of lumbar spine were significantly higher than the normal population, indicating that the hemiplegia needs compensatory improvement of the trunk muscle (Salami, Niklasch, Krautwurst, Dreher, & Wolf, 2017; Mei, Gu, Sun, & Fernandez, 2018).
In addition to lower limb modeling, problems related to the knee joint have been adequately handled by OpenSim application. For the musculoskeletal model of knee arthritis with different degrees of lesions, the knee joint contact force of early knee arthritis is not significantly different from that of normal and confirmed knee arthritis. It is necessary to evaluate the abduction and flexion moment of the knee joint to understand more the pathogenesis of the knee joint. One potential strategy is to shorten the duration of the high-intensity load during the gait stance phase (Meireles et al., 2016). The calculation of the adduction moment of the knee joint is also affected by the motion axis of the constructed model, such as Transepicondylar axis (TEA). The functional axis of rotation (FAR) is found to be different due to the difference of the movement axis of the constructed model (Richards & Higginson, 2010). In case of the factors, such as the relaxation of the joint ligament, the calculation of the knee arthritis load should consider the load-bearing condition. The function of the lower