Carpathian Journal of Earth and Environmental Sciences, February 2018, Vol. 13, No. 1, p. 77 - 84
EVALUATING OF WASTEWATER IRRIGATION IN LYSIMETER EXPERIMENT THROUGH ENERGY WILLOW YIELDS AND SOIL
SODICITY
Ágnes KUN
1, Csaba BOZÁN
1, Mária B. ONCSIK
1& Károly BARTA
21National Agricultural Research and Innovation Centre, Research Department of Irrigation and Water Management, Anna liget 8, Szarvas, Hungary HU-5540 email: kun.agnes@ovki.naik.hu, bozan.csaba@ovki.naik.hu,
oncsik.maria@ovki.naik.hu
2Department of Physical Geography and Geoinformatics, University of Szeged, Hungary Egyetem str. 2-6. Szeged, Hungary HU-6722 email: barta@geo.u-szeged.hu
Abstract: In Hungary, alternative water resources utilization should take priority over the conventional irrigation water resources (surface and subsurface waters) in the future, similarly to the global trends because of the global warming and water scarcity. To preserve our most important renewable natural resource (soil), farmers and researchers are responsible for development of soil management practices and irrigation principles. Adaptation by farmers of this new, sustainable technologies soil degradation can be avoided, and the natural soil processes can be improved.Usage of different quality irrigation water was evaluated in our experiment measuring the variation of the soil exchangeable cations after one season of irrigations using wastewater in an energy willow plantation. The thermal water based wastewater, originated from an intensive catfish farm, was applied for micro-sprinkler irrigation in the Lysimeter Station of National Agricultural Research and Innovation Centre (NAIK), Research Department of Irrigation and Water Management (OVKI) in Szarvas, Hungary. According to our results the exchangeable sodium percentage (NaS%) increased significantly in all wastewater treatments with +1.16- 4.4% after one year, and the sodium decreased significantly in the treatment with Körös River water irrigation with -0.26-1.1%. There were no significant changes in the NaS% when a diluted and improved (gypsum-added) wastewater was applied, and the soil’s sodium content did not increase above 200 mg/kg. In addition, the willow yields depended on the available irrigation water amount and there was no significant impact of the irrigation water quality on it. The highest biomass yields (4480.8±435.8 g/m2) were achieved in treatments with 60 mm water per two weeks. The accumulated sodium in the willow stem was less than 1% of the irrigation water sodium content, making the removal of this harmful element by willow harvest unsuitable. The results suggest that further wastewater irrigation usage might be sustainable with the diluted and improved quality water.
Key words: exchangeable sodium percentage, adsorption, irrigation water quality
1. INTRODUCTION
The continuous increase in global population and simultaneous decrease in good quality water resources emphasize the need of using poor quality irrigation water for agricultural production (Singh, 2015). The scarcity of resources, mainly in Mediterranean and other coastal areas (aggravated by climate change effects and demographic pressures) boosted the use of non-conventional resources, mainly waste water reuse and desalination, increasing water supplies (Frances et
al., 2017). The importance of wastewater for agriculture has increasingly been recognised not only as a valuable water resource but also for its nutrient value (Elgallal et al., 2016). According to Urbaniak et al., (2017) the results of the soil analyses showed an increase of total organic carbon content in samples fertilized with sewage sludge, especially those coming from small and medium wastewater treatment plans. However, the wastewaters and sewage sludge have harmful elements as well. If excessive salt is not removed, it may result in accumulation in the soil, particularly in
the topsoil (Elgallal et al., 2016). In the case of sodic wastewater irrigation, the excess levels of Na+ and bicarbonate (HCO3
–) result in the gradual development of sodicity problem in soils, thereby exhibiting structural problems created by certain physical processes (Quadir &Scott, 2010).
According to Kreybig (1938) when the exchangeable sodium percentage (NaS%) is above 10-12%, soil has no sand texture, making the soil’s physical properties disadvantageous and when the NaS% exceeds the value is 8% the soil has many sodic properties (Kreybig, 1946). According to Mados (1939), when the NaS% reaches 15-20%with the soil water conductivity can be ceased due to elimination of the pores. This is caused by the soil aggregates with low water stability, individual particles (after breakdown of aggregates) close the pores. According to Herke (1983), when the NaS% reaches 13-15% the soil structure can be destroyed due to the sodium adsorption and decrease of the water stable aggregates. According to Stefanovits (2010), when the NaS% is above 5% the soil has already sodic properties. According to Sione et al., (2017) when the exchangeable sodium is above 322 mg/kg the soil can be categorised to low quality class according to their own category system.
In our experiment, wastewater from an intensive catfish farm, with high salt and sodium content, was used for energy willow irrigation. The aim of our research is to evaluate the applicability of this wastewater for irrigation. For the assessment, in a lysimeter experiment the salinity processes was examined, measuring the exchangeable sodium content in the soil, the biomass yield of the energy willow, and the element uptake of the willow.
2. MATERIALS AND METHODS 2.1. Experiment site
The experiments were conducted at the National Agricultural Research and Innovation Centre (NAIK), Research Department of Irrigation and Water Management (OVKI) in Szarvas, Hungary. The experiment was set up in the NAIK ÖVKI Lysimeter Station in 2014 in 64 pieces of 1 m3 vessels with energy willow. Two willow clones (no. 77, 82) were selected by the NAIK Forest Research Institute of Püspökladány Experimental Station. In this paper, we present the results of clone no. 82. The mean temperature during the irrigation season (June-September) in 2015 was 22.3°C and the precipitation was 137.2 mm. The 1 m3 lysimeter vessels were filled with disturbed meadow topsoil.
The soil was characterised by high clay content
(~70-80%), low humus (~2%), lime content less than 0.5%, total dissolved salt content less than 0.08%, and pHKCl values between 5.88-6.97, before the start of the experiment.
2.2. Irrigation treatments and water quality
Three different irrigation waters were applied in the experiment. First one originated from the Oxbow Lake of Körös River (K15, K30, K60 – numbers mean one-time irrigation doses in mm) with excellent water quality according to Filep‘s classification (Filep, 1999; Stefanovits, 2010), while the other one was a wastewater (W15, W30, W60) from an intensive African catfish farm in Szarvas (Table 1). The wastewater can be characterized by high specific electrical conductivity, high total salt and sodium content (Table 1). Beside the non- irrigated treatment (Control), one wastewater based irrigation water type (HG60) was used for irrigation (only 60 mm doses), which was diluted with Körös River water and gypsum-added to improve sodium- calcium rate (Table 1). Irrigation occurred 12 times, between 19 June 2015 and 18 September 2015, with 3 doses (15, 30 and 60 mm).
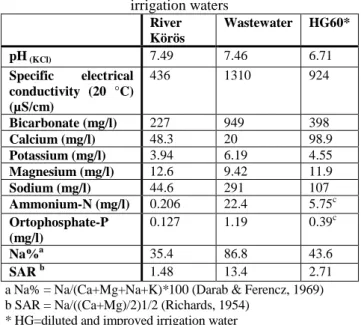
Table 1. The main chemical parameters of the applied irrigation waters
River Körös
Wastewater HG60*
pH (KCl) 7.49 7.46 6.71
Specific electrical conductivity (20 °C) (µS/cm)
436 1310 924
Bicarbonate (mg/l) 227 949 398
Calcium (mg/l) 48.3 20 98.9
Potassium (mg/l) 3.94 6.19 4.55 Magnesium (mg/l) 12.6 9.42 11.9
Sodium (mg/l) 44.6 291 107
Ammonium-N (mg/l) 0.206 22.4 5.75c Ortophosphate-P
(mg/l)
0.127 1.19 0.39c
Na%a 35.4 86.8 43.6
SAR b 1.48 13.4 2.71
a Na% = Na/(Ca+Mg+Na+K)*100 (Darab & Ferencz, 1969) b SAR = Na/((Ca+Mg)/2)1/2 (Richards, 1954)
* HG=diluted and improved irrigation water
2.3. Sampling methods and data analyses
The soil samples were collected in the spring of 2015 before the irrigation season, in autumn after the irrigation season, then in 2016 spring after the winter time. The disturbed soil samples are from three layers 0-20 cm, 20-40 cm and 40-60 cm. Sampling occurred in 24 vessels in three replications per treatment. The plant sampling was in 2015 autumn after the
irrigation season. The willow shoots were collected for analyses. Water sampling occurred three times during the irrigation season in 2015, and the mean values are in Table 1. The soil, plant and water analyses were conducted in the NAIK OVKI Laboratory for Environmental Analytics.
The statistical calculation was performed in SPSS 22.0 Statistics Software. Paired Sample T-test was used to determine the significant changes in the amount of the exchangeable cations between the sampling times. ANOVA and Tukey’s Test was used to determine the impact of the irrigation on the element concentration in the stems and the adsorbed cations on the soil surface; the homogenous subset means no significant difference between the treatments.
The following calculation were made (1), for all elements, to compare the accumulated element content in the willow’s stem to the total applied element amount added to the plant-soil system by irrigation, reflecting the utilized elements from the irrigation water:
Ca, K, Mg, Na% = Output/Input *100 (1) where output is the element concentration in dried stem (mg/kg)*dry yield (kg) and input is the total element content (mg) of the applied irrigation water in 2015.
This simple calculation shows the percentage of the elements removed from the irrigation water by the plant-soil system with the harvest of the willow.
Accumulation of an element in the soil is observable, if the result is less than 100%.
Accumulation of an element in the soil is undoubted, if the result is less than 100%. When this ratio is higher than 100%, a higher quantity of that certain element was removed by the plant-soil system than the input was, during the irrigation season.
3. RESULTS AND DISCUSSION
The initial properties of the soils in the vessels were favourable, because of the prosperous rates of the different main exchangeable cations (Ca, K, Mg and Na). The initial mean exchangeable calcium values were between 70-80%, the potassium values were 2%
in all vessels, the magnesium values were approximately 20% and the sodium was between 1-2%
in all cases.
3.1. The wastewater impact on the soil exchangeable cations during irrigation period
According to the results, the highest exchangeable sodium percentage increase occurred in the treatments irrigated with wastewater. Except
two layers (W15 40-60 cm and W60 0-20 cm), the increases were significant in the layers. In the Control treatment, the increase was also significant in all layers but the growth was below 1%. In the soil column leaching experiment described by Jalali et al. (2008) the NaS% increased with +12%, because of the irrigation water with high specific electrical conductivity (6040 µS/cm). In the treatments irrigated with Körös River water the increase was negligible (<0.5 NaS%), and, in some layers, decrease occurred (Table 2.). As well, there was no significant increase in NaS% values in treatment HG60.
Besides the sodium accumulation the other main process was the CaS% decrease. The highest reduction of the CaS% was in the Control and W60 treatment (Table 2). Only in treatments K30, K60 we did not observe significant calcium decrease, in any layer.
Potassium did not change significantly during the irrigation season. Only in two soil layers (in K60 treatment) the KS% was more than 1%. A significant exchangeable magnesium increase occurred in Control treatment in all layers.
In the non-irrigated Control treatment, the magnesium cations could be adsorbed on the soil colloid surface while the exchangeable calcium content significantly decreased during the irrigation season of 2015 (Table 2). According to Arany (1956) if a soil solution contains magnesium and calcium in the same amount, it will primarily accumulate the magnesium than the calcium, because the soil has major affinity to adsorb the magnesium. The Pearson’s correlation coefficient between these two elements was high after the irrigation season, in autumn (R = -0.787) and in spring in 2016 (R = - 0.472) as well (at p<0.01 significant level). According to Wang et al. (2017) the correlation between the CaS% and MgS% was also high (R = 0.6; p<0.001) in the examined soil aggregates.
3.2. The wastewater impact on the soil exchangeable cations during winter
Between the two sampling moments - in autumn 2015 and in spring 2016 - the impact of the winter precipitation on the soil properties, through the alteration of the exchangeable cation percentages, was examined (Table 2). Despite of the accumulated exchangeable sodium content of the soil during the irrigation season, we assumed that leaching processes in winter may have been occurred. However, according to our results a significant alteration occurred only in 8 layers in case of sodium cation (Table 2). Decrease did not reach 2%, in any layer.
The smallest change was in the treatment HG in all
layers. In the treatments with Körös River water and Control the sodium reduction took place in all layers, however only in six cases was significant. According to Tzanakakis et al. (2011) winter precipitation decreased ECsp, Na, and SAR, but it was not sufficient to restore soil background levels and a progressive build up was observed between seasons.
In most layers, the potassium and magnesium content decreased (Table 2). The change of CaS%
was significant only in four layers, where the increase was between 0.34-3.06%. However, the concentration of the adsorbed calcium was significant in all layers in the W30 and W60 treatment. The average value of the exchangeable calcium in H60 was 569 mg/kg and 653 mg/kg in the treatment W60. Despite of the calcium increase in these treatments, there was no significant change in the exchangeable calcium percentage.
Table 2. Alteration of the exchangeable cations of the soil during irrigation time (A) and winter time (B) in %
K15 K30 K60 Control
Ca ΔS% A B A B A B A B
0-20 cm -1.93* 1.02 -0.92 2.97 -1.45 1.83 -7.79* 0.34**
20-40 cm -1.39 1.81* 0.19 2.58 -0.26 1.86 -7.19** 0.82
40-60 cm 0.43 1.19 0.91 0.76 -1.32 3.06* -6.78* 0.48
K15 K30 K60 Control
KΔS% A B A B A B A B
0-20 cm 0.24 -0.46 0.54 0.02 1.04 -1.24 0.63 -0.80*
20-40 cm 0.17 -0.16 0.63 -0.17 1.01** -0.70* 0.59 -0.50
40-60 cm 0.8 -0.66 1.01 -0.84 0.52 -0.32 0.15 -0.58*
K15 K30 K60 Control
MgΔS% A B A B A B A B
0-20 cm 1.35 -0.03 -0.1 -2.45 0.51 0.36 6.6* 1.01*
20-40 cm 0.99 -1.26* -0.96 -1.89 -0.51 -0.30 6.01** 0.45
40-60 cm -1.19 -0.21 -2.04 0.45 0.08 -0.96 6.08* 0.38
K15 K30 K60 Control
NaΔS% A B A B A B A B
0-20 cm 0.34* -0.53* 0.49 -0.54 -0.1 -0.95** 0.57** -0.55*
20-40 cm 0.24 -0.40 0.14 -0.52** -0.24 -0.86* 0.58** -0.76*
40-60 cm -0.03 -0.33 0.11 -0.37 0.72 -1.78 0.54* -0.29
W15 W30 W60 HG
Ca ΔS% A B A B A B A B
0-20 cm -3.03* 0.68 -3.81** 2.55 -6.51* 0.45 -1.03* 1.51 20-40 cm -1.97 0.16 -2.87* 2.63 -5.6* -0.17 -1.34 1.73*
40-60 cm -1.36 -1.24 -1.36 1.66 -4.8 -0.79 -1.91 3.16
W15 W30 W60 HG
KΔS% A B A B A B A B
0-20 cm 0.32 -0.61* -0.03 -0.22* 0.43 -0.81 0.32 -0.35
20-40 cm 0.19 -0.35 -0.23 -0.13 0.35 -0.83 0.31 -0.35
40-60 cm 0.15 -0.56 0.1 -0.30 0.54 -0.81 0.47 -0.25
W15 W30 W60 HG
MgΔS% A B A B A B A B
0-20 cm -0.01 -0.19 -0.49 -0.73 2.37 -0.31 0.57 -1.17
20-40 cm 1.34 -1.33 0.19 -1.62 2.46 -0.20 1.27 -1.60
40-60 cm 1.06 0.41 -0.21 -1.05 2.71 -0.11 1.28 -2.73
W15 W30 W60 HG
NaΔS% A B A B A B A B
0-20 cm 2.7* 0.11 4.34** -1.60** 3.72 0.67 0.13 0.01
20-40 cm 0.43* 1.52 2.92** -0.87 2.77** 1.20* -0.24 0.21
40-60 cm 0.14 1.39 1.47* -0.32 1.54* 1.70 0.16 -0.19
ΔCa S%, ΔKS%, ΔMgS%, ΔNaS%: values represent the alteration of the exchangeable cations during irrigation season (A) and winter time (B) according to the paired sampled T-Test, (%) (*p<0.05 **: p<0.01 ***: p<0.001)
Table 3. The values of exchangeable cations in the soil after the first experiment year
CaS% KS% MgS% NaS%
Treatment 0-20 cm
20-40 cm
40-60 cm
0-20 cm
20-40 cm
40-60 cm
0-20 cm
20-40 cm
40-60 cm
0-20 cm
20-40 cm
40-60 cm W15 73.07 73.95 73.33 2.13 2.34 2.13 20.46 20.41 21.66 4.34c 3.30c 2.88b W30 71.86 72.35 72.56 2.10 2.05 2.00 21.43 21.90 22.71 4.61c 3.71c 2.73b W60 71.96 72.42 72.73 2.08 1.98 2.11 20.06 20.30 20.69 5.90d 5.30d 4.47c HG 74.16 73.96 74.51 2.33 2.38 2.45 21.08 21.47 20.86 2.43b 2.19b 2.17ab K15 74.32 74.31 73.90 2.44 2.46 2.26 22.02 21.98 22.63 1.21a 1.25a 1.21a K30 75.20 74.57 73.65 2.67 2.50 2.19 20.72 21.57 22.77 1.41a 1.36ab 1.39a K60 73.94 74.18 74.37 2.27 2.35 2.37 22.38 22.01 21.82 1.40a 1.46ab 1.43a Control 73.37 73.26 72.86 1.97 2.09 2.08 23.24 23.26 23.31 1.43a 1.38ab 1.75ab
a, b, c, d, e indexes: The Homogenous Subset of the Tukey’s Test (ANOVA)
3.3. The wastewater impact on the soil exchangeable cations after the first year of the experiment
After the first year of the experiment there were no significant difference between the treatments for of exchangeable calcium, potassium and magnesium. The calcium minimum value was 71.9% and maximum was 75.2% (Table 3). One year before the maximum value was the highest 80.8% in the Control treatment.
This was the greatest change in calcium between the irrigation times (Table 2). The potassium minimum value was 2.0% and maximum was 2.7%. Before the experiment, the range was the same. The magnesium minimum value was 20.1% and maximum was 23.3%.
The lowest value (15.6%) and the highest one (24.4%) were measured in the control treatment before the experiment. The magnesium increase occurred in the Control treatment beside the calcium decrease. The minimum value for sodium was 1.2% and maximum was 5.9% after the first experiment year. The significant differences in NaS% content of the soils was due to the irrigation water quality (Table 3). In the HG treatment, the NaS% values were above 2% also before the experiment, and significant differences due to irrigation did not occurred.
According to Szabó et al., (2012) beside the increase in salinization the development of the tree’s roots is blocked and the time to achieve the soil water became longer hence the measured sodium accumulation in this experiment after long time irrigation can hinder the growth of the energy willow plantation. According to ‘Sigmond (1923) the willow and the poplar can better tolerate the salts, in case of enough available water, then the arable crops, they can live on soils which have 0.1-0.3% salt content.
According to Lenti & Kondor (2008) the willow can grow in soils with weak properties also because of its deep roots.
3.4. The wastewater and irrigation impact on the willow yield and element uptake
According to the measurements of wet and dry biomass production of the willow, the highest productivity was achieved in the treatments with 60 mm irrigation doses. There were no significant differences between these three treatments despite of the distinct irrigation water quality (K60: 4433 g/m2; HG60: 4443 g/m2; W60: 4568 g/m2 wet yield). The highest dry matter contents were also measured in these treatments (51.0-51.6%), but it was not significant. In the case of wastewater irrigation (W15:
2745 g/m2; W30: 3573 g/m2) the wet biomass yield was greater than in Körös River treatments (K15: 2418 g/m2; K30: 2975 g/m2). This difference was not significant; nonetheless there was strong correlation between the biomass yield and the irrigation water amount (Kun et al. 2017). In case of treatment irrigated with Körös River water the Pearson’s correlation coefficient was 0.920 (p=0.01) and in the treatment with wastewater was 0.928 (p=0,01) (Fig. 1).
Figure 1. Correlation between the willow yield and the applied irrigation water amount (the Control wet biomass yield can be seen in case of both irrigation water qualities).
The lowest yield was measured in the non- irrigated Control treatment (1445 g/m2). According to
Obraska & Kolecka (2007) the energy willow plantation can be used to wastewater and sewage sludge processing, in their experiment the willow dry yield was 0.37 t/ha. According to Lazdina et al., (2007) 0.2-0.6 t/ha dry yield willow biomass was measured, without fertilization, and after the second year, with while applying sewage sludge, 4.6-5.5 t/ha yield was achieved.
Table 4: Element concentrations (mg/kg) of the willow’s stem according to the treatments
Ca K Mg Na
Control 6837 4647 607a 53a
K15 9937 6037 1530b 67a
W15 6803 4803 1310b 100abc
K30 7243 4740 1513b 117bc
W30 7817 5740 737a 84abc
K60 7940 4517 1310b 128c
HG 7420 4173 674a 69ab
W60 10057 4807 843a 83abc
a, b, c indexes: The Homogenous Subset of the Tukey’s Test (ANOVA)
According to our results, there were no significant differences between the calcium and potassium concentrations in the willow stem due to the different treatments (Table 4). The highest calcium concentration was measured in the W60 treatment and the highest potassium concentration was measured in the W30 treatment. In the case of magnesium, the values were significantly higher in the treatments with
Körös and the W30 than the others. The highest mean sodium concentration was in the K60 and the lowest in the non-irrigated Control treatment. There were no significant differences in the measured sodium concentrations in the treatments irrigated with wastewater (Table 4). According to Jama-Rodzenska et al., (2016) the accumulated sodium concentration was between 200-300 mg/kg in their experiment with applied municipal sewage sludge.
The utilized elements amount from the irrigation water was calculated (1) for all cations. In case of the calcium, in three treatments more calcium was removed from the plantations by the stems than it was in the irrigation water (W15:
227%; K15: 137%; W30: 131%) (Fig. 2).
In the other treatments, the calcium was accumulated from the irrigation water in the soil. In case of the potassium, in all treatments more potassium was accumulated in the stems than it was in the irrigation water (153%-518%). In the treatment K15 the calculated value was 1023%, which means that ten times more potassium was accumulated in the stems than the potassium content of the irrigation water (Figure 2). Obviously, this potassium has to be originated from the soil.
However, in case of the magnesium in all treatments more magnesium was in the irrigation water than that the willow could accumulate, the values were between 9-93%.
Figure 2. The utilized elements from the irrigation water by element uptake of the willow stem (calculation method see Equation (1))
In all treatments, the sodium percentage was below 1% (it was between 0.096-0.998%) what means that the sodium from the irrigation water accumulated in the soil (Fig. 2). For all cations is true that there are high correlations between the irrigation water doses and the utilized element percentages because of the mentioned high linear correlation between the yield and irrigation water amount.
5. CONCLUSIONS
According to our results after one year wastewater irrigation season, there were no significant changes of the exchangeable cations in the treatment irrigated with diluted and improved irrigation water (HG). In spring of 2016 the NaS% in HG treatment had significantly higher values (2.43%) only just in the surface layer, compared to with Körös River water (Table 3). However, before the experiment, the soils of the lyisimeter vessels belonging to the HG and K60 treatment had NaS% above 2% compared to the others.
According to Arany (1956) in a leached soil the exchangeable potassium is always higher than the sodium. In spring of 2016 Arany’s observations were fully satisfied by the values of Körös River water irrigated soils; in the HG60 the two values were approximately equal (2.3 NaS% ~ 2.4 NaS%), while in the soils irrigated with wastewater the NaS% was two times higher than that of the treatments with Körös River water. Consequently, it can be assumed that this irrigation water quality (HG) can be applicable for long time irrigation while avoiding salinization.
The most remarkable exchangeable sodium accumulation (highest +4.34%) occurred in the treatments irrigated with wastewater where the exchangeable calcium decreased simultaneously in the soils. Thereby the most vulnerable layers to salinization (where these processes occurred together) (Table 2) can be found in the treatments irrigated with wastewater. The sodium accumulation obviously occurred due to the irrigation, because the sodium content decreased with depth; so, the sodium originated from the surface with irrigation water.
According to our expectations the NaS% values of the soils decrease in winter time due to the winter precipitations (increased soil moisture and induced leaching) however it had significance only for a few layers, and it occurred only in the treatments with Körös River water, Control and in only one treatment with wastewater (H30) (Table 2). Furthermore, the decrease was not able to reduce the sodium accumulation from the irrigation water as well.
In the non-irrigated Control treatment, the magnesium cations could be adsorbed on the soil
colloid surface, while the exchangeable calcium content significantly decreased during the irrigation season of 2015 (Table 2).
The threshold values for exchangeable sodium content increased from 5% to 20% (according to different authors, see in the Introduction chapter) which may bring about negative and unfavourable physical properties in the soil. The NaS% was above 5% only in two layers of the W60 treatment, in our experiments, after one year (Table 3). At the same time, according to Sione et al., (2017) the exchangeable sodium content above 322 mg/kg is considered to be harmful. In the treatment irrigated with wastewater during the experiment, in all surface layers, higher sodium concentrations than the limit values (331-520 mg/kg) were measured. In the soil layer of 20-40 cm and 40-60 cm the sodium was higher than the above-mentioned values only in the W60, 472 mg/kg and 383 mg/kg, respectively. In the treatment with diluted and improved wastewater the soil sodium content did not increased above 200 mg/kg suggesting that long time irrigation can be sustainable with this water quality.
In our experiment, the willow can tolerate the salt content of the wastewater, but cannot accumulate the sodium in its tissues. The sodium concentration in the willow stem was between 53-117 mg/kg. Based on the sodium measurement of the willow stem, sodium (which accumulated in the soil from the irrigation water) could not be removed by the willow harvest. The accumulated sodium in the willow stem was less than 1% of the irrigation water sodium content.
According to our conclusion, the biomass yield depends on the available irrigation water, and the salt content of the wastewater did not influence adversely the biomass yield. Beside the harmful salt and sodium content, the applied wastewater can be characterized by high nutrition content as well. Based on wastewater parameters (Table 1), 12 times irrigation with 60 mm wastewater means approximately 160-162 kg/ha nitrogen application in form of solution of ammonia- nitrogen during the vegetation period. The irrigation with Körös River means only 8.6 kg/ha nitrogen compared to the wastewater. Despite of this great variation in the nitrogen, the results of the willow yield did not reflect this difference. However, in the treatments with wastewater the yields were always greater than those which were irrigated with Körös River water, but the differences were not significant.
Acknowledgement
Our work was funded by the Ministry of Agriculture in Hungary (OD001 project).
REFERENCES
Arany S. 1955. Irrigation water in the Irrigation System of Tiszalök. (in Hungarian) Agrokémia és Talajtan, 1, 2, 97-118.
Arany S. 1956. The sodic soils and its improvement. (in Hungarian). Mezőgazdasági Kiadó. Budapest.
Darab K. & Ferencz K. 1969. Soil mapping of the irrigation areas. (in Hungarian) Országos Mezőgazdasági Minőségvizsgáló Intézet.
Budapest.
Elgallal M., Fletcher L. & Ewans B. 2016. Assessment of potential risks associated with chemicals in wastewater used for irrigation in arid and semiarid zones: A review. Agricultural Water Management 177: 419-431.
Filep Gy. 1999. Quality and qualification of irrigation waters. (in Hungarian) Agrokémia és Talajtan, 48, 1-2, 49-65.
Francés G.E., Quevauviller P., González E.S.M. &
Amelin E.V. 2017. Climate change policy and water resources in the EU and Spain. A closer look into the Water Framework Directive.
Environmental Science and Policy, 69, 1-12.
Herke S. 1983. Melioration and utilization of alkali and sodic soils in the Duna-völgy. (in Hungarian).
Akadémiai Kiadó. Budapest.
Jalali M., Merikhpour H., Kaledhonkar M.J., & S.
Van Der Zee. 2008. Effects of wastewater irrigation on soil sodicity and nutrient leaching in calcareous soils. Agricultural Water Management, 95, 143-153.
Jama-Rodzenska A., Bocianowski J., Nowak W., Ciszek D. & Nowosad K. 2016. The influence of communal sewage sludge on the content of macroelements in the stem of selected clones of willow (Salix viminalis L.). Ecological Engineering, 87, 212-217.
Kreybig L. 1938. Explanation for the geological and soil genetic maps of Hungary. (in Hungarian) Magyar Királyi Földtani Intézet. Budapest.
Kreybig L. 1946. Agricultural natural resources and its enforcement of crop production. (in Hungarian) Magyar Mezőgazdasági Művelődési Társaság Kiadása. Budapest.
Kun Á., Bozán Cs., Barta K. & Oncsik B. M. 2017. The effects of wastewater irrigation on the yield of energy willow and soil sodicity. Columella, 4, 1 Suppl, 11-14.
Lazdina D., Lazins A., Karnis Z. & Kaposts V. 2007.
Effect of sewage sludge fertilization in short- rotation willow plantation. Journal of Environmental Engineering and Landscape
Management, 15, 2, 105-111.
Lenti I. & Kondor A. 2008. The soil demand of the energy willow (Salix viminalisL.). (in Hungarian) Talajvédelem Különszám, 447-454.
Mados L. 1939. Irrigation and water management studies in the irrigation system of Tiszafüred. (in Hungarian) Királyi Magyar Egyetemi Nyomda.
(Különlenyomat az „Öntözésügyi Közlemények”
1939. évi 1. számából.) Budapest.
Obarska-Pempkowiak H. & Kolecka K. 2007.
Experiences of Salix Viminalis application to water and sewage treatment. Wastewater treatment in wetlands: Theoretical and practical aspects, 7, 3- 4, 235-241.
Quadir M. & Scott C.A. 2010. Non-pathogenic trade- offs of wastewater irrigation. In: Drechsel P. et al.:
Wastewater Irrigation and Health: Assessing and Mitigating Risk in Low Income Countries, Earthscan, London.
Richards L.A. 1954. Diagnosis and improvement of saline and alkali soils. Agriculture Handbook No.60. USDA
’Sigmond E. 1923. The salt soils and its improvement in Hungary. (in Hungarian) Magyar Tudományos Akadémia Kiadása. Budapest.
Szabó A., Kiss K., Gribovszki Z. & Tóth T. 2012.
Forest impact on soil and subsoil salt regim and groundwater. (in Hungarian) Agrokémia és Talajtan, 61, 1, 195-209.
Stefanovits P. 2010. Soil science. (in Hungarian) Mezőgazdasági Kiadó. Budapest.
Sione S.M.J., Wilson G.M., Lado M. & González A.P.
2017. Evaluation of soil degradation produced by rice crop systems in a Vertisol, using a soil quality index. Catena, 150, 79-86.
Singh A. 2015. Poor quality water utilization for agricultural production: An environmental perspective. Land use policy, 43, 259-262.
Tzanakakis V.A., Paranychianakis N.V., Londra P.A.
& Angelakis A.N. 2011. Effluent application to the land: changes in soil properties and treatment potential. Ecological Engineering, 37, 1757-1764.
Urbaniak M., Wyrwicka A., Toloczko W., Serwecinska L. & Zielinski M. 2017. The effect of sewage sludge application on soil properties and willow (Salix sp.) cultivation. Science of the Total Environment, 586, 66-75.
Wang R., Dungait A.J.J., Buss L. H., Yang S., Zhang Y., Xu Z. & Jiang Y. 2017. Base cations and micronutrients in soil aggregates as affected by enhanced nitrogen and water input in a semi-arid steppe grassland. Science of total Environment, 575, 564-572.
Received at: 28. 04. 2017 Revised at: 05. 06. 2017
Accepted for publication at: 13. 06. 2017 Published online at: 27. 07. 2017