Carpathian Journal of Earth and Environmental Sciences, August 2021, Vol. 16, No. 2, p. 469 – 482; DOI:10.26471/cjees/2021/016/192
RAINWATER HARVESTING POTENTIAL AND VEGETATION IRRIGATION ASSESSMENT DERIVED FROM BUILDING DATA-BASED
HYDROLOGICAL MODELING THROUGH THE CASE STUDY OF SZEGED, HUNGARY
Ákos Kristóf CSETE
1, Ronald András KOLCSÁR
2& Ágnes GULYÁS
11Department of Climatology and Landscape Ecology, University of Szeged, H-6722 Szeged, Egyetem u. 2. Hungary.
2Department of Geoinformatics, Physical and Environmental Geography, University of Szeged, H-6722 Szeged, Egyetem u. 2. Hungary.
Email address: cseteakos@geo.u-szeged.hu
Abstract: Cities and urban areas face new challenges in the near future. Growing urban population and the climate change related uncertainties will likely have an effect both the urban hydrological cycle and water management. Extreme weather conditions, such as high volume precipitation caused urban flooding, or the prolonged drought periods are the problems for which urban water management needs to prepare. Within the sustainable water management systems, there are many tools with the ability to mitigate the undesired effects. In urban areas, excess water can be a good source to replace the potable or ground water which is used for vegetation irrigation. Urban vegetation is artificially maintained, and requires irrigation in dry summer periods. Rainwater harvesting systems (RWHS) are used in the sustainable water management systems to reduce the water usage of drinking water and the water import into the cities. This work aimed to devise a simple method for estimating the maximal collectable rainwater for irrigation use in Szeged, Hungary. Hydrological modelling (EPA SWMM) was used to calculate maximal runoff from rooftops, which was the base of the simple irrigation water (IW) demand estimation. The maximal potential rainwater volumes that can be used for rainwater harvesting and irrigation were calculated. For the IW demand calculation, buffer zones around the rooftops of the buildings were created in different distances (10 m, 20 m, and 50 m). The land cover within these zones was categorized by vegetation and artificial surfaces.
Results indicated that there are notable differences among the urban districts, some of which having high available volume of collectable rainwater, but low vegetation proportion for efficient irrigation (e.g., in the innermost part of the city center). The housing-estate district of the city – which is widespread in post- socialist and Central-European countries – can be a good choice for RHWS installation, due to the high vegetation proportion and high collectable rainwater volume. The simple methods and the comparatively easy-to-access data is expected to facilitate the rainwater harvesting estimation in urban areas.
Keywords: rainwater harvesting, sustainability, hydrological modeling, EPA SWMM, green infrastructure.
1. INTRODUCTION
In the time of climate change, the weather extremes and climate uncertainties can cause several difficulties and problems for cities and urban dwellers.
In the 21st century, more and more people move to cities further increasing the growth of urban areas in the near future (Jaramillo & Nazemi, 2018; Seto et al., 2010). Problems caused by the climate change can be more extreme in urban regions, because these areas are under strong artificial pressure. The hydrological
system also changed in contrast with natural watersheds and catchments (Fletcher et al., 2013;
Semadeni-Davies et al., 2008). Urban planners will face with new challenges and difficulties: one side of the problem is the heavy rainfalls and consequently the urban flooding, which can cause serious damage within a short time (Jha et al., 2012; Kjeldsen et al., 2013). On the other hand, dry periods also impact the water cycles of cities, especially in droughts exposed areas, when less water is available from natural sources (Chang & Bonnette, 2016).
Urban catchments significantly changed in contrast with natural catchments: in urban areas the use of impervious surfaces, sewer and drainage systems modify the hydrological cycle (Fletcher et al., 2013).
Buildings and other artificial surface elements modify the local microclimate conditions like temperature, wind speed and insolation. One of the most important problem is the surface runoff in the densely paved city centers. The high proportion of impervious surfaces (roads, pedestrian areas, drainage systems) contribute to a higher surface runoff, higher peak flow and a shorter residence time than in the case of natural areas (Jacobson, 2011; Shuster et al., 2005; Van de Ven, 1990). In general, urban areas have lower vegetation and bare soil cover than natural watersheds.
Consequently, of these land cover ratios the evaporation, evapotranspiration and the infiltration are decreased in these areas. The soils in urban catchments are compacted and degraded owing to the everyday usage and the environmental stress caused by intensive urban traffic, which affects the health of urban vegetation (Salvadore et al., 2015).
The vegetation in urban areas is mostly artificially installed and maintained. These reasons often result in the necessity of artificial help for the vegetation to survive the harsh environmental conditions within urban areas. One of the most important need of vegetation is the surplus irrigation especially in the vegetation period (Nouri et al., 2013).
Particularly in dry and drought exposed climates, the irrigation is a key element of the urban water management. The irrigation of the vegetation is an important task, nevertheless it imposes a significant burden on the urban planning and water system (Lowry et al., 2011). In case the precipitation is not enough to meet the water demand of the vegetation, cities are compelled to look for other sources of water.
Usually drinking (potable) water and groundwater are both available sources of irrigation, but neither of them provide sustainable solutions. The needed irrigation water (IW) can be supplemented by collected rainwater from roofs or other suitable surfaces (Campisano et al., 2017). As a part of sustainable water management, rainwater harvesting systems (RWHS) are proper ways to make the cities more sustainable (Torres et al., 2020).
Sustainable water management systems have a long history of methodological development and application. LID (Low Impact Development), WSUD (Water Sensitive Urban Design) and SUDS (Sustainable Urban Drainage Systems) have great reference and literature with implemented applications (Dietz, 2007; Fletcher et al., 2013; Mak et al., 2017;
Palla & Gnecco, 2015). These applications are mostly widespread in Anglo-Saxon countries, because the
concepts of the systems originated in the United States, the United Kingdom and Australia, however many other countries have adapted these frameworks. In addition to these systems, there are various new attempts with a complex approach for solving water- related challenges (Sponge cities and other initiatives) (Liu, et al., 2015).
In connection to the sustainable urban water management and the rainwater harvesting systems, the concept of the green and blue infrastructure should also be mentioned. Green and blue infrastructures are different categories of management elements, but in urban and natural areas they should be treated as a whole. Blue infrastructure includes all of the surface and subsurface elements of water which is used and treated in the water management system, including open channels, lakes, ponds and other water surfaces.
Urban green infrastructure includes the vegetation in urban areas and all of the combination of vegetation and artificial infrastructure elements. These combinations can improve the ecosystem services of urban vegetation, because they are more applicable in artificial environments. Green infrastructure elements have varied shapes and sizes and different purpose of application. Some examples for urban green infrastructure elements: green roofs, green walls, rain gardens, swales, RWHS combined with irrigation systems, textured soils, etc. (Brears, 2018; Haase, 2015; Jayasooriya et al., 2014).
In the green infrastructure system vegetation plays a key role to make the cities more sustainable and has an important role on the mitigation of urban microclimate. Parks and other public green areas can provide opportunities for relaxation, either in the main part of the city or around the local residential area (Ayala-Azcárraga et al., 2019; Cheng et al., 2021;
Kolcsár et al., 2021; Niţă & Ioja, 2020; Razak et al., 2016). Urban vegetation has air pollutant reducing effect, especially the trees, which contributes significantly to the carbon-dioxide and other pollutant sequestration, like sulfur-dioxide. Trees also have remarkable dust removal effect, which is a major problem in dry and drought-prone areas (McDonald et al., 2007; Nowak et al., 2006). Vegetation has also major impacts on the hydrological cycle, which depends on its quality and quantity. Interception, evaporation and transpiration are the main processes which contribute to the surface runoff reduction.
Vegetation also facilitates the process of infiltration via its root system. These diverse effects and contributions to a better urban life demonstrate the outstanding role of urban vegetation (Berland et al., 2017; Kuehler et al., 2017). These mean the urban planning systems need to pay special attention on the irrigation and water demand of the vegetation. Especially in dry, drought
period the vegetation may requires surplus water, which need an advanced irrigation infrastructure and source. These sources can be potable drinking water, groundwater and collected rainwater. The most sustainable approach is to supplement traditional irrigation water sources with collected rainwater (Leong et al., 2018; Velasco-Muñoz et al., 2019)
This study estimated the maximal available rainwater, which can be used for irrigating vegetation.
The main assumption of our work was that, in urban areas each roof of buildings can be the source of RWHS. A high percentage of the total surface is covered by buildings within a city, thus a considerable volume of rainwater is expected to be gathered on rooftops. This volume of precipitation generally drains onto the ground surface (pervious or impervious) or directly into the sewer system. This ‘wasted’ resource could potentially be used for RWHS and the irrigation of surrounding urban vegetation. Several approaches exist to estimate rainwater harvesting potential from roof catchments (Adugna et al., 2018; Aladenola &
Adeboye, 2010; Gwenzi & Nyamadzawo, 2014;
Roman et al., 2017), and in many research in addition to the building data, statistical data about population formed also the basis of the study (e.g., Ghisi et al., 2006, Villar-Navascués et al., 2020). One of the most important part of some research in connection with RWH is to define the appropriate site. Various GIS approaches can help to solve these problems (Sayl et al., 2020). Stormwater management models also can help to estimate the benefits of rainwater harvesting (Steffen et al., 2013). Stormwater runoff control and flood mitigation are also key benefits of rainwater harvesting, which examined in several studies (Huang et al., 2015; Jamali et al., 2020; Petrucci et al., 2012).
The researches on RHW also tend to involve two different approaches, depending on the aim of the research. The pond harvesting systems (PHS) tend to be used in larger-scale contexts, while the roof harvesting systems (RHS) tend to be used in smaller- scale contexts (a building and its environment) (Karim et al., 2021; Liaw & Chiang, 2014; Zabidi et al., 2020).
Other assessments use slightly different, but still similar methodologies for different examination level (Belmeziti et al., 2013). In our work as well as the roofs were the basis of the examinations, for which the RHS approach was used. The runoff from the roofs represents the maximal potential volume that can be collectable within a specific site. Considering the sheer quantity of roofs that were included in the assessment, estimation of the net usable IW volume (volume that installed RWHS could gather from the runoff) was beyond the scope of present study. Therefore, the results do not highlight the quantity that can be collected with a real RWHS, but the maximal volumes
of runoff which can be collected from roofs. This volume of runoff formed the basis of the IW demand investigation.
In this part of the examination buffer zones was used to delimit the area of vegetation around roofs. The information of vegetation within any given buffer zone was calculated from a normalized difference vegetation index (NDVI) map. Based on these data, the quantity and quality of the vegetation and the IW demand could be calculated within a buffer zone. The EPA SWMM 5.1 model was used for the runoff calculation part of the examination. The goal of this work was to create a simple method to calculate the maximal collectable rainwater from roofs in urban areas, and to determine the quantity of vegetation that can be irrigated with this volume. The used geometrical and meteorological database are comparatively easy-to-access in larger Central- European cities, which means the examinations could be adaptable in this region. In this assessment the aim was to answer the following questions:
• Which city part is the most vegetated around buildings?
• Which part of the city can provide enough collectable rainwater for irrigation utilization?
• Is the buffer zone approach acceptable for the examination of the vegetation water demand?
2. STUDY AREA
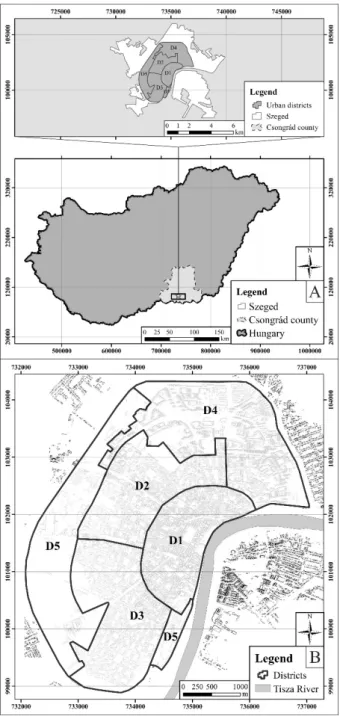
The study area is located in Szeged, which is one of the largest cities in Hungary and the center of the Southern Great Plain Region (approx. 168 000 inhabitants) (KSH, 2013). This region is exposed to uncertainties caused by climate change because especially in summer drought are common in the continental climate. (Bartholy et al., 2014; Sábitz et al., 2014). Furthermore, the city’s annual precipitation (approx. 497 mm) is one of the lowest in Hungary and is also affected by high sunshine duration (Balázs et al., 2009; Mezősi et al., 2016). These facts alongside the trends of the climate change in this region highlight the importance of the sustainable urban water management and the RWH based solutions.
The examination was carried out in the main, central area of Szeged (this part of the city is located west from the Tisza River). The reason for selecting this study area, was that this is the most artificially modified part of the city, where a sustainable solution could help the most to reduce the pressure on the water management system. The radio-centric rebuild has largely determined the land cover and the geometrical characteristics of Szeged following the “Great Flood”
of 1897. In this examination the study site was divided into five urban districts (D1-D5) (Fig. 1). The base of
this division was the Local Climate Zone (LCZ) system, which was implemented for the area of Szeged by researchers of the department (Unger et al., 2014).
The LCZ system uses meteorological, geometrical and land cover data for classification, therefore it can already be estimated the hydrological processes in different zones. The divided districts represent every urban fabric type within Szeged.
Figure 1. The spatial location of Szeged within Hungary (A), the examined urban districts (B) (D1 = city center,
D2 = mixed stricture, D3 = family-house area, D4 = housing-estate area, D5 = industrial area
D1 has the highest proportion of built-up areas within the city. It includes the downtown which is characterized by compact mid-rise and low-rise buildings and less vegetation coverage than other parts
of the city. Here, the buildings are comparatively old and have large roof area. D2 and D3 are similar in many ways, but in D2 building types are more diverse, and there are more shopping malls with large roof areas. The D3 district is a typical regular structured single-family home district, where there are numerous relatively small buildings with smaller roofs. The D4 is a housing-estate area with open high-rise structure and large open green areas. The buildings were mostly built between the 1960s and 1980s. These types of buildings are characterized generally large roofs.
Districts like D4 are typical in many cities within the post-socialist countries of Central-Europe. D5 is the industrial and semi-industrial part of the city, which contains numerous factories, railway buildings, and other industrial structures, with a high variety of roof sizes.
Based on an available building database, the roofs were designated within the whole study site of Szeged. Each roof represents a separate “system” and a subcatchment in the modelling environment. In total, 13 980 subcatchments were designated (the total surface area of roofs is 264 ha). All of the examination used the area of these roofs (hereafter subcatchments).
3. MATERIALS AND METHODS
The EPA SWMM is a complex dynamic rainfall-runoff simulation model which uses subcatchments as the base of the modeling. This model handles land cover proportion within the subcatchments and various LID solutions (e.g., rain barrels, and storage systems) (Rossman, 2010). Present study is aimed to determine the maximum potential rainwater volumes which are collectable from the surface of subcatchments. A specific building database provided an appropriate basis for the modeling (Gál et al., 2009). The subcatchments contain information regarding the geometrical parameters of the roofs. The SWMM model required exact geometrical information of the subcatchment. Many researches model the roofs as a subcatchment in EPA SWMM (Burszta-Adamiak
& Mrowiec, 2013; Cipolla et al., 2018; Hamouz &
Muthanna, 2019; Iffland et al., 2021) and in our examination all the roofs were also modeled as a subcatchment. Each subcatchment’s result contains information regarding the volume of precipitation, evaporation, and the runoff with the latter forming the basis of the subsequent examinations. The modeling also required meteorological data (daily maximum and minimum of the air temperature (°C), hourly precipitation sum (mm)), which provided by the Department of Climatology and Landscape Ecology of Szeged (Unger & Gál, 2011).
Following the model run, the data post- processed in Esri ArcMap to visualize the result of the subcatchments. Natural neighborhood interpolation method was used to visualize city parts with highest runoff and rainfall volumes. These maps can indicate the areas within the urban districts, where are the highest potential of runoff for RWH. The interpolation was based on the volumes of the subcatchment and showed the distribution of precipitation and runoff on roofs within the city.
The quality and the quantity of the vegetation are major parameters of the irrigation potential (designation of the area of “worth to be irrigated”), but the distance of vegetation from the subcatchment (roof) is also a key parameter, therefore buffer zones were the base of this parameter.
Figure 2. The conception of buffer zones
In this examination, three buffer zones were generated around every subcatchment with varying distances: 10 m, 20 m, and 50 m. These buffer zones did not contain the buildings themselves, which (in order to prevent distortion) were removed from the buffers (Fig. 2). To quantify and qualify the vegetation within the buffer zones, an NDVI map and an NDVI grid database were used. The NDVI map had 5 m resolution derived from a four-band UltraCam X (RGB-NIR) orthophoto (2015) which provided by the Department of Climatology and Landscape Ecology of Szeged.
Table 1. The boundaries of NDVI categories NDVI categories Description
-1–0 Non-vegetation surfaces 0–0.2 Lower quality vegetation 0.2–1 Higher quality vegetation
The first method to specify the vegetation in a buffer zone is the average of NDVI values within the zones. This solution provides general information
about vegetation, but does not specify the quality of it and its proportion within a zone. NDVI value of each grid point was used to separate the vegetation from the other land cover categories. The grid points represent the NDVI value of a 25 m2 area and each point were classified to the NDVI categories (Table 1).
Based on this classification, the points of the NDVI categories were counted and summarized within each buffer zones. The area of the categories was calculated, and two indicators were created based on these data.
G1 =A0.2−1A ∗100 (1) where:
G1 is the dense vegetation (proportion of higher quality vegetation within buffer zone) (%),
A is the total area of a buffer zone (m2),
A0.2-1 is the area of NDVI values (m2) in the range of 0.2-1.
G2 =A0−1A ∗100 (2) where:
G2 is the total vegetation (the proportion of all vegetation within the buffer zone) (%),
A0.0-1 is the area of NDVI values (m2) in the range of 0-1.
These indicators show the proportion (%) of the categories. G1represents the higher quality of vegetation, in contrast with G2, which represents all the vegetation within the buffer zones. These percentage values had been divided into three classes (Table 2), which represent the proportion of the G1 and G2 indicators within buffer the zones.
Table 2. The classification of G1and G2indicator (Glow = low proportionof vegetation, Gmed =medium proportionof
vegetation,Ghigh = high proportionof vegetation) Classes
Glow Gmed Ghigh
Calculated proportion values for G1 and G2
15–34% 35–50% 51%–
The indicators and the classification together characterize the vegetation and the available rainwater for irrigation. The potentially available IW can be calculated with information on the vegetation water demand. We made our calculations using a 450 mm (0.45m3/m2) IW demand per vegetation period for the vegetation of Szeged based on Jószainé Párkányi (2007). This value can be changed by different geographical location, regional climate and if there are more accurate data available for the different types of vegetation. The value represents an
average for all types of vegetation (based on lawn vegetation). The 0.45m3/m2 is the maximum value of the irrigation which covers the 100% of the buffer zone’s water demand. Following the equations help to facilitate the evaluation of the water demand of buffer zones.
Vtotal= V� ∗A (3) where:
Vtotal is the total IW demand (volume of IW which needed to apply to the buffer area, if the vegetation proportion is 100%) (m3),
V� is the IW demand (m3) (0.45m3 in this research), A is the area of buffer zone (m2).
Ptotal =VVroof
total∗100 (4) where:
Ptotal is the total feasible water demand (which means how much percentage of Vtotal can be covered by the runoff of the subcatchment) (m3),
Vroof is the volume of runoff from roofs (m3).
VG1= 0.01Vtotal∗G1 (5) where:
VG1 is the IW demand of dense vegetation (volume of IW which needed to apply to the buffer, if only the vegetation area taken into account based on G1) (m3).
VG2= 0.01Vtotal∗G2 (6) where:
VG2 is the IW demand of the total vegetation (volume of IW which needed to apply to the buffer, if the total vegetation area taken into account based on G2) (m3).
PG1 =VVroof
G1 ∗100 (7)
where:
PG1 is the feasible water demand of dense vegetation (how much percentage of VG1 can be covered by the runoff of the subcatchment).
PG2 =VVroof
G2 ∗100 (8)
where:
PG2 is feasible water demand of the total vegetation (how much percentage of VG2 can be covered by the runoff of the subcatchment).
These indicators were calculated for all the buffer distances (10 m, 20 m, and 50 m). Based on these, the areas which can be irrigated by collectable rainwater can be identified. The three indicators (total feasible water demand, feasible water demand of the dense and total vegetation) show the irrigation possibilities if the buffer zone fully covered by vegetation, or the buffer zone covered by the real proportion of vegetation (based on the NDVI categories).
4. RESULTS AND DISCUSSION 4.1 Hydrological processes
The SWMM model provides data about the precipitation, the runoff, and the evaporation. The base year of the meteorological data was 2016, when the amount of precipitation was higher than the annual average (above 600 mm).
With the exception of spring, at least one month with higher runoff and evaporation volumes is observable in the data in the case of each season.
Overall, the volumes were the lowest in spring and toward the end of the year (November, December).
The temperature in this year was close to the annual average, which means the winter months are the coldest, the summer months are the warmest and between these spring and autumn have transitional temperature values (Fig. 3).
Figure 3. The runoff, evaporation, and air temperature by months
Figure 4. The distribution of the runoff on subcatchments within the study site
The spatial distribution of the processes (runoff, evaporation) shows differences among the different districts of the city. In the downtown and the outer part of the city (D1, D4, D5) the precipitation and runoff on the roofs were higher, than in the middle part of the city (D2, D3) (Fig. 4) These results mostly derived from the difference of subcatchments.
In general, in the D2 and D3 the areas of buildings are mostly smaller than the other districts which means the volume of the runoff also lower (Table 3.). Some larger roofs in these districts are an exception to this and the water on these larger roofs also mean more available rainwater for the surrounding vegetation.
Table 3. Average roof area by district Districts Average area of roofs (m2)
D1 265
D2 175
D3 101
D4 247
D5 438
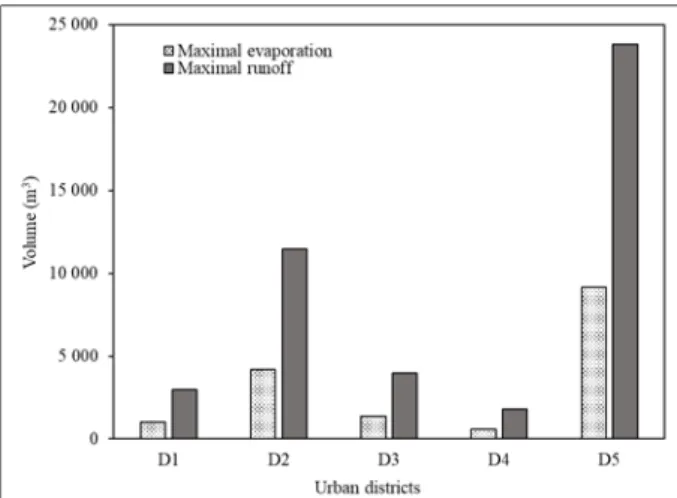
The maximal evaporation and runoff of districts show the most outstanding values of subcatchments (the maximal evaporation and runoff represent the subcatchment with the highest value within a district). In D2 and D5 there are some industrial buildings and warehouses, which surfaces are the largest in the database. Figure 5 shows these outstanding values in connection with the evaporation and the runoff.
Figure 5. The maximal evaporation and runoff by urban districts
The average runoff of subcatchment by districts shows a slight difference: D1, D4 and D5 are high, while D2 and D3 are the lowest. D5 is the highest, because of warehouses with extensive roofs within its area (Fig. 6).
The peak runoff shows the differences between
the districts. The maximum peak runoff is the highest values in each district, where D5 is the highest regarding both indicators (Fig. 7). In D3 the relatively small roofs result in the lowest mean values. The D2 district has some larger roofs (e.g., malls, shopping centers), which means these roofs contribute to the high maximum value, but due to the average roof size the average values relatively low. In the case of D1 district there are not outstanding roof sizes, but the average size of roofs contributes to the higher average values.
Figure 6. The average evaporation and runoff by urban districts
Figure 7. The average and maximal of peak runoff by urban districts
These data and maps provide a comprehensive and general information about the hydrological processes in the study site by urban districts. These values and calculated volumes are the base of the irrigation potential maps and the indicators in connection with the vegetation.
4.2. Vegetation related results
The vegetation data is one of the most important data in this research. The information about
Figure 8. The average NDVI values of buffer zones, 10 m (A), 20 m (B), 50 m (C)
the quantity and quality of vegetation are essential to determine the IW demand.
In this research three distance of buffer zones were used (10 m, 20 m, and 50 m). The runoff of each subcatchments means the potentially available water for the vegetation within the buffer zones. Larger buffer zones do not mean higher quality vegetation cover and NDVI values, because in the city there are roads, walkways and other artificial surface elements which reduce the ratio of vegetation within a buffer zone. The average NDVI values provide general information about the vegetation cover within the buffer zones, but these average values do not precisely highlight the quality and quantity of the vegetation and its water demand (Fig. 8).
Based on the average NDVI, the northeastern and the southwestern parts of Szeged are the
„greenest” within the buffer zones while the innermost downtown and the northwestern industrial part of the city have the lowest average NDVI values.
As the figure shows, within the 50 m buffer zone distance there are fewer buffer zones with high average NDVI value compared to the other two buffer zone distances (10 m, and 20 m). The northeastern part of the city in all three cases has the highest average NDVI values (Fig. 8). In contrast with the average NDVI the categorized NDVI data can provide more accurate information about the vegetation quality within subcatchments.
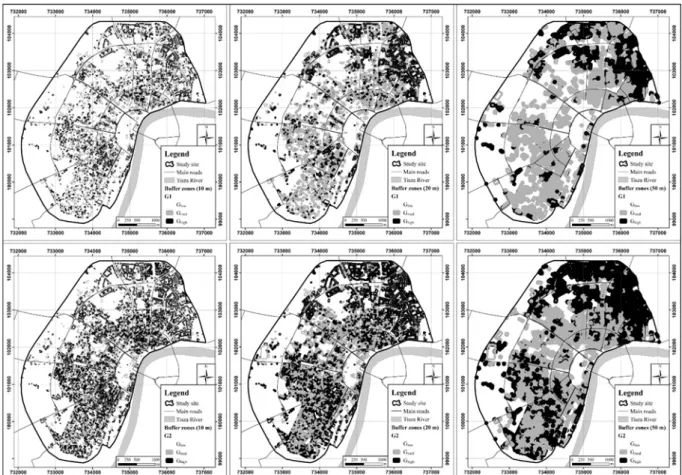
Categorization of the vegetation into two main categories is the first step of these processes. Within the dense vegetation (which represents the high- quality vegetation) and the total vegetation (which represents mostly of the entire vegetation) there are three classes (Glow, Gmed, Ghigh) which represent the ratio of the vegetation within buffer zones. Higher proportion (within buffer zones) of dense vegetation appears in the northeastern and the southwestern part of the city. More buffer zones of 10 m and 20 m have Ghigh class of the dense vegetation than the 50 m
buffer zones. The main reason for this is because the 50 m buffer zones are larger, and thus contain more low quality vegetation patches and artificial elements around their buildings. The results are similar in the case of the total vegetation, since this category contains all the vegetation, more buffer zones had higher vegetation proportions. The three buffer distances have nearly similar counts of Ghigh class.
The quantity of buffer zones with Ghigh class of the total vegetation are higher especially at the southwestern part of the city (which is a residential area) where the average area of subcatchment is small.
The ”greenest” buffer zones are in the northeastern part of the city which is a housing estate area with open green spaces and subcatchments with relatively large roof area (Fig. 9).
In order to identify which subcatchments have the ability to cover the IW demand of the vegetation within the buffer zones, further indicators were calculated. The following figures show these indicators’ average values by urban districts and buffer zones (Fig. 10-13). Figure 10 shows the indicators of the total IW demand (Vtotal) and total feasible water demand (Ptotal). It is visible on the data that the 50 m buffer zones are too large for single subcatchments (rooftop) to cover the whole buffer zone water demand based on the volume of runoff.
Total IW demand and total feasible water demand do not consider the quantity and quality of vegetation within a buffer zone (Fig. 10).
IW demand and feasible water demand of the dense and the total vegetation have already taken into account the proportion of the vegetation. In these cases, the water demand is lower than the total IW demand and total feasible water demand, because they are operated only with the vegetation covered areas within the buffer zones. Figure 11 shows the indicators of IW demand (VG1) and feasible water demand of the dense vegetation (PG1), which take into account only the higher NDVI values.
Figure 9. The vegetation proportion within buffer zones, by vegetation categories (Glow = low proportion of vegetation, Gmed = medium proportion of vegetation, Ghigh = high proportion of vegetation)
Figure 10. The average of total IW demand (Vtotal) and total feasible water demand (Ptotal) by urban districts and
buffer zones
This fact means the IW demand values are lower and the feasible water demand values are higher, since the proportion of vegetation which needed irrigation is lower within each buffer zones.
On the figure (Fig. 11) only the buffer zones with medium and high proportion of vegetation (classes Gmed and, Ghigh) are included, subcatchments where roofs were estimated to have high runoff volumes, but insufficient vegetation where gathered water can be effectively used for irrigation were excluded from the
analysis. In the D3 district the average roof area is small, but the vegetation coverage is high within the buffer zones, which caused the relatively low feasible water demand values of dense vegetation. A notable change appeared in the D5 district. D5 is one of the industrial districts of the city. During the vegetation classification (Gmed, Ghigh), a large number of buffer zones were excluded. The non-excluded buffers in the examination have high IW demand values of dense vegetation, but the remaining roofs are relatively small, thus it can not cover the zone’s water demand.
Figure 11. The average of the IW demand of the dense vegetation (VG1) and the feasible water demand (PG1) of the dense vegetation by urban districts and buffer zones.
In the case of the IW demand (VG2) and feasible water demand of the total vegetation (PG2), the same results are expected with lower feasible water demand values. Due to the usage of total vegetation category, the vegetation area is higher within the buffer zones, which means that with the water collected from roofs, only a lower percentage of vegetation can be irrigated (Fig. 12).
Figure 12. The average of the IW demand of the total vegetation (VG2) and feasible water demand (PG2) of the
total vegetation by urban districts and buffer zones
Buffer zones within D4 (one of the "greenest"
districts among the study sites have high water demand. Considering the 10 m buffer zones, 60% of VG1, and 50% of VG2 can be covered by the gathered rainwater. In the case of D1, the water demand is not high, as in D4, but the feasible water demand of dense (PG1) and total vegetation (PG2) are approximately the same (Fig. 11, 12).
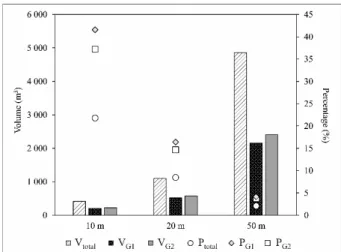
Figure 13. The average of the indicators of IW by the size of buffer zones (total IW demand (Vtotal), total feasible water demand (Ptotal), IW demand of the dense vegetation
(VG1), feasible water demand of the dense vegetation (PG1), IW demand of the total vegetation (VG2), feasible
water demand of the total vegetation (PG2))
In the summary figure it is noticeable, that the 50 m buffer zone category is too large for irrigation
purposes. The 10 and 20 m buffer zones can be irrigated based on the volume of runoff especially, if only the higher quality vegetation is considered (PG1).
The irrigation percentage in the case of 10 m buffer zones are the highest, and there is no notable difference between feasible water demand values of the dense (PG1) and the total vegetation (PG2). In contrast these, there is a major difference between the total feasible water demand (Ptotal) and the feasible water demand of the vegetation (PG1, PG2). In the other two buffer zones (20 m, 50 m) the differences between these indicators are similar to the 10 m buffer zones, but the values are lower. The cause of this, the subcatchments’ sizes do not grow with the buffer distances, which means, that the runoff from the subcatchment covers less and less of the buffers’ IW demand as the distance increases (Fig. 13).
There are many approaches to estimate the potential RWH solutions in cities. These approaches use building database or delineate the roof of buildings based on orthophoto or satellite image. In many cases residential databases are used to estimate the required water demand for domestic or community utilization. In present work a building database was also used to estimate the maximal value of the runoff from rooftop. In contrast to some examination, this work calculates the collectable rainwater for irrigation use, and does not take into account the population data (Liaw & Chiang, 2014;
Villar-Navascués et al., 2020). These studies examine the RWH in the terms of grey water usage like toilet flushing and its financial implications. The vegetation’s water demand is independent from the population and its density, but from a certain point of view, the vegetation has connection with the area of buildings and artificial elements in urban areas. Other assessments examine the RWHS in terms of urban flood mitigation (Huang et al., 2015). The vegetation is highly valuable in urban areas, therefore the irrigation is a key elements in a sustainable urban water management. The irrigation of vegetation has high water, energy and financial demand. There are two approaches of the RWH: the larger scale pond harvesting system and the smaller scale roof harvesting systems, of which the latter was used in present study as well, in order to determine the IW demand of the buffer zones (Zabidi et al., 2020).
5. CONCLUSION
Climate change can cause serious problems in the near future, especially in cities and drought exposed areas. The water scarcity will be a major a problem for urban water management, and water usage will require serious restrictions. In dry and
drought exposed areas urban vegetation requires irrigation to maintain a healthy condition, but the source of used IW is a key element in a sustainable water management system. Rainwater harvesting systems can reduce the pressure on the potable and groundwater sources by storing it for future usage.
The RWHS can be connected to rooftop, but for irrigation in urban areas, the vegetation proximity to the roofs is also important. In our assessment, a simple method was created to delineate buildings and their environment, which have the potential for a future RWHS installation. In the first part of the assessment the runoff of roofs was calculated using the EPA SWMM model based on a building database.
The runoff volume of each rooftop represented the basis of the irrigation potential calculation. Buffer zones were created around each roof as a potential area of irrigation. Within each buffer zones the vegetation was delineated based on average NDVI values and NDVI based categories.
The results outline the areas, where the most vegetated buffer zones are located, and where the irrigation can be most effective. The proportion of the vegetation is high in the northeastern housing estate part of Szeged and also in the southwestern part of the city. In the innermost city center the vegetation within the buffer distances does not appear in a high proportion. In the examinations, the the subcatchments where the vegetation proportion was low, were filtered out (there are no sufficient vegetation for effective irrigation). The subcatchments, where the runoff from roofs were also filtered out, because the reason of effective irrigation.
The methodology introduced in this work can be applied for urban areas in general, if required data is available. These results might be the most useful for urban planners in Central-Europe, especially in post- socialist countries, where there are urban districts and urban fabric types similar to Szeged (e.g., housing estate areas from the 1960s to 1980s).
Acknowledgment
This research was supported by the Blue Planet Foundation. Supported by the ÚNKP-20-3 - New National Excellence Program of the Ministry for Innovation and Technology from the source of the National Research, Development and Innovation Fund.
Many thanks to the Department of Climatology and Landscape Ecology of the University of Szeged for providing the spatial and meteorological database.
REFERENCES
Adugna, D., Jensen, M. B., Lemma, B. & Gebrie, G. S., 2018. Assessing the Potential for Rooftop
Rainwater Harvesting from Large Public Institutions. International Journal of Environmental Research and Public Health, 15(2).
Doi:10.3390/ijerph15020336
Aladenola, O. O. & Adeboye, O. B., 2010. Assessing the Potential for Rainwater Harvesting. Water Resources Management, 24(10), 2129–2137.
Doi:10.1007/s11269-009-9542-y
Ayala-Azcárraga, C., Diaz, D. & Zambrano, L., 2019.
Characteristics of urban parks and their relation to user well-being. Landscape and Urban Planning,
189, 27–35. Doi:
10.1016/j.landurbplan.2019.04.005
Balázs, B., Unger, J., Gál, T., Sümeghy, Z., Geiger, J. &
Szegedi, S., 2009. Simulation of the mean urban heat island using 2D surface parameters: empirical modeling, verification and extension.
Meteorological Applications, 16. (3): 275-287. Doi:
10.1002/met.116
Bartholy, J., Pongrácz, R. & Pieczka, I., 2014. How the climate will change in this century?. Hungarian Geographical Bulletin, 63. (1): 55-67.
Doi:10.15201/hungeobull.63.1.5
Belmeziti, A., Coutard, O. & De Gouvello, B., 2013. A New Methodology for Evaluating Potential for Potable Water Savings (PPWS) by Using Rainwater Harvesting at the Urban Level: The Case of the Municipality of Colombes (Paris Region). Water, 5(1), 312–326. Doi:10.3390/w5010312
Berland, A., Shiflett, S.A., Shuster, W.D., Garmestani, A.S., Goddard, H.C., Herrmann, D.L. &
Hoptonc, M.E., 2017. The role of trees in urban stormwater management. Landscape and Urban
Planning, 162. 167–177. Doi:
10.1016/j.landurbplan.2017.02.017
Brears, R.C., 2018. Blue and Green Cities: The Role of Blue-green Infrastructure in managing Urban Water Resources. London, Palgrave Macmillan.
Doi: 10.1057%2F978-1-137-59258-3
Burszta-Adamiak, E. & Mrowiec, M., 2013. Modelling of Green roofs’ hydrologic performance using EPA’s SWMM. Water Science and Technology, 68(1), 36–42. Doi:10.2166/wst.2013.219
Campisano, A., Butler, D., Ward, S., Burns, M. J., Friedler, E., DeBusk, K., Fisher-Jeffes, L.N., Ghisi, E., Rahman A., Furumai, H. & Han, M., 2017. Urban rainwater harvesting systems:
Research, implementation and future perspectives.
Water Research, 115, 195–209. Doi:
10.1016/j.watres.2017.02.056
Chang, H. & Bonnette, M.R., 2016. Climate change and water-related ecosystem services: impacts of drought in California, USA. Ecosystem Health and Sustainability, 2(12), e01254. Doi:
10.1002/ehs2.1254
Cheng, Y., Zhang, J., Wei, W. & Zhao, B., 2021. Effects of urban parks on residents’ expressed happiness before and during the COVID-19 pandemic.
Landscape and Urban Planning, 212, 104118. Doi:
10.1016/j.landurbplan.2021.104118
Cipolla, S.S., Altobelli, M. & Maglionico, M., 2018.
Decentralized Water Management: Rainwater Harvesting, Greywater Reuse and Green Roofs within the GST4Water Project. Proceedings, 2(11).
Doi: 10.3390/proceedings2110673
Dietz, M.E., 2007. Low Impact Development Practices: A Review of Current Research and Recommendations for Future Directions. Water, Air, and Soil Pollution, 186. 351–363. Doi: 10.1007/s11270-007- 9484-z
Fletcher, T.D., Andrieu, H. & Hamel P., 2013.
Understanding, management and modelling of urban hydrology and its consequences for receiving waters: A state of the art. Advances in Water
Resources, 51. 261-279. Doi:
10.1016/j.advwatres.2012.09.001
Gál, T., Lindberg, F. & Unger, J., 2009. Computing continuous sky view factors using 3D urban raster and vector databases: comparison and application to urban climate. Theoretical and Applied Climatology, 95(1), 111–123. Doi:
10.1007/s00704-007-0362-9
Ghisi, E., Montibeller, A. & Schmidt, R.W., 2006.
Potential for potable water savings by using rainwater: An analysis over 62 cities in southern Brazil. Building and Environment, 41(2), 204–210.
Doi: 10.1016/j.buildenv.2005.01.014
Gwenzi, W. & Nyamadzawo, G., 2014. Hydrological Impacts of Urbanization and Urban Roof Water Harvesting in Water-limited Catchments: A Review.
Environmental Processes, 1(4), 573–593. Doi:
10.1007/s40710-014-0037-3
Haase, D., 2015. Reflections about blue ecosystem services in cities. Sustainability of Water Quality and
Ecology, 5. 77–83. Doi:
10.1016/j.swaqe.2015.02.003
Hamouz, V. & Muthanna, T.M., 2019. Hydrological modelling of green and grey roofs in cold climate with the SWMM model. Journal of Environmental Management, 249, 109350. Doi:
10.1016/j.jenvman.2019.109350
Huang, C.-L., Hsu, N.-S., Wei, C.-C. & Luo, W.-J., 2015.
Optimal Spatial Design of Capacity and Quantity of Rainwater Harvesting Systems for Urban Flood Mitigation. Water, 7(9), 5173–5202. Doi:
10.3390/w7095173
Iffland, R., Förster, K., Westerholt, D., Pesci, M. H. &
Lösken, G., 2021. Robust Vegetation Parameterization for Green Roofs in the EPA Stormwater Management Model (SWMM).
Hydrology, 8(1). Doi: 10.3390/hydrology8010012 Jacobson, C.R., 2011. Identification and quantification of
the hydrological impacts of imperviousness in urban catchments: A review. Journal of Environmental Management, 92. (6): 1438–1448.
Doi: 10.1016/j.jenvman.2011.01.018
Jamali, B., Bach, P. M. & Deletic, A., 2020. Rainwater harvesting for urban flood management – An integrated modelling framework. Water Research, 171, 115372. Doi: 10.1016/j.watres.2019.115372
Jaramillo, P. & Nazemi, A., 2018. Assessing urban water security under changing climate: Challenges and ways forward. Sustainable Cities and Society, 41, 907–918. Doi: 10.1016/j.scs.2017.04.005
Jayasooriya, V.M. & Ng, A.W.M., 2014. Tools for Modeling of Stormwater Management and Economics of Green Infrastructure Practices: A Review. Water, Air, and Soil Pollution, 225. 2055.
Doi: 10.1007/s11270-014-2055-1
Jha, A.K., Bloch, R. & Lamond, J., 2012. Cities and Flooding: A Guide to Integrated Urban Flood Risk Management for the 21st Century. Washington D.C., World Bank.
Jószainé Párkányi, I., 2007. Zöldfelület-gazdálkodás, parkfenntartás (Green space management, park maintenance). Budapest, Mezőgazda Kiadó.
Karim, M. R., Sakib, B. M. S., Sakib, S. S. & Imteaz, M.
A., 2021. Rainwater Harvesting Potentials in Commercial Buildings in Dhaka: Reliability and Economic Analysis. Hydrology, 8(1). Doi:
10.3390/hydrology8010009
Kjeldsen, T.R., Miller, J.D. & Packman, J.C., 2013.
Modelling design flood hydrographs in catchments with mixed urban and rural land cover. Hydrology Research, 44. (6): 1040–1057. Doi:
10.2166/nh.2013.158
Kolcsár, R.A., Csikós, N. & Szilassi, P., 2021. Testing the limitations of buffer zones and Urban atlas population data in urban green space provision analyses through the case study of Szeged, Hungary.
Urban Forestry and Urban Greening, 57. 126942.
Doi: 10.1016/j.ufug.2020.126942
KSH, 2013. 2011. évi népszámlálás (Census 2011).
Központi Statisztikai Hivatal, Budapest, Magyarország.
Kuehler, E., Hathaway, J. & Tirpak, A., 2017.
Quantifying the benefits of urban forest systems as a component of the green infrastructure stormwater treatment network. Ecohydrology, 10:e1813. Doi:
10.1002/eco.1813
Leong, J.Y.C., Chong, M.N., Poh, P.E., Vieritz, A., Talei, A. & Chow, M.F., 2018. Quantification of mains water savings from decentralised rainwater, greywater, and hybrid rainwater-greywater systems in tropical climatic conditions. Journal of Cleaner Production, 176, 946–958. Doi:
10.1016/j.jclepro.2017.12.020
Liaw, C.-H. & Chiang, Y.-C., 2014. Framework for Assessing the Rainwater Harvesting Potential of Residential Buildings at a National Level as an Alternative Water Resource for Domestic Water Supply in Taiwan. Water, 6(10), 3224–3246. Doi:
10.3390/w6103224
Liu, C.M., Chen, J.W., Hsieh, Y.S., Liou, M.L. & Chen, T.H., 2015. Build Sponge Eco-cities to Adapt Hydroclimatic Hazards. In Handbook of Climate Change Adaptation. Ed.: Leal Filho, W., Berlin, Heidelberg, Springer, 1997-2009. Doi:
10.1007/978-3-642-38670-1_69
Lowry, J.H., Ramsey, R.D. & Kjelgren, R. K., 2011.
Predicting urban forest growth and its impact on residential landscape water demand in a semiarid urban environment. Urban Forestry & Urban Greening, 10(3), 193–204. Doi:
10.1016/j.ufug.2011.05.004
Mak, C., Scholz, M. & James, P., 2017. Sustainable drainage system site assessment method using urban ecosystem services. Urban Ecosystem, 20.
293-307. Doi: 10.1007/s11252-016-0593-6
McDonald, A.G., Bealey, W.J., Fowler, D., Dragosits, U., Skiba, U., Smith, R.I. & Nemitz, E., 2007.
Quantifying the effect of urban tree planting on concentrations and depositions of PM10 in two UK conurbations. Atmospheric Environment, 41(38), 8455–8467. Doi: 10.1016/j.atmosenv.2007.07.025 Mezősi, G., Blanka, V., Ladányi, Zs., Bata, T., Urdea,
T., Frank, A. & Meyer, B.C., 2016. Expected mid- and long-term changes in drought hazard for the south-eastern Carpathian Basin. Carpathian Journal of Earth and Environmental Sciences, 11.
(2): 355-366.
Niţă, M.R. & Ioja, C.I., 2020. Environmental conflicts in the context of the challenging urban nature.
Carpathian Journal of Earth and Environmental Sciences, 15(2), 471–479. Doi:
10.26471/CJEES/2020/015/146
Nouri, H., Beecham, S., Kazemi, F. & Hassanli, A.M., 2013. A review of ET measurement techniques for estimating the water requirements of urban landscape vegetation. Urban Water Journal, 10(4), 247–259. Doi: 10.1080/1573062X.2012.726360 Nowak, D.J., Crane, D.E. & Stevens, J.C., 2006. Air
pollution removal by urban trees and shrubs in the United States. Urban Forestry and Urban Greening, 4(3–4), 115–123. Doi: 10.1016/j.ufug.2006.01.007 Palla, A. & Gnecco, I., 2015. Hydrologic modeling of Low
Impact Development systems at the urban catchment scale. Journal of Hydrology, 528, 361- 368. Doi: 10.1016/j.jhydrol.2015.06.050
Petrucci, G., Deroubaix, J.-F., de Gouvello, B., Deutsch, J.-C., Bompard, P. & Tassin, B., 2012. Rainwater harvesting to control stormwater runoff in suburban areas. An experimental case-study. Urban
Water Journal, 9(1), 45–55.
Doi:10.1080/1573062X.2011.633610
Razak, M.A.W.A., Othman, N. & Nazir, N.N.M., 2016 Connecting People with Nature: Urban Park and Human Well-being. Procedia - Social and Behavioral Sciences, 222, 476–484. Doi:
10.1016/j.sbspro.2016.05.138
Roman, D., Braga, A., Shetty, N. & Culligan, P., 2017.
Design and Modeling of an Adaptively Controlled Rainwater Harvesting System. Water, 9(12).
Doi:10.3390/w9120974
Rossman, L.A., 2010. Storm Water Management Model User’s Manual; Version 5.0. National Risk Management Research Laboratory, Office of Research and Development, Environmental Protection Agency: Cincinnati, OH, USA.
Salvadore, E., Bronders, J. & Batelaan, O., 2015.
Hydrological modelling of urbanized catchments: A review and future directions. Journal of Hydrology,
529. Part 1, 62-81. Doi:
10.1016/j.jhydrol.2015.06.028
Sayl, K., Adham, A. & Ritsema, C. J., 2020. A GIS-Based Multicriteria Analysis in Modeling Optimum Sites for Rainwater Harvesting. Hydrology, 7(3). Doi:
10.3390/hydrology7030051
Sábitz, J., Pongrácz, R. & Bartholy, J., 2014. Estimated changes of drought tendency in the Carpathian Basin. Hungarian Geographical Bulletin, 63. (4):
365-378. Doi: 10.15201/hungeobull.63.4.1 Semadeni-Davies, A., Hernebring, C., Svensson, G. &
Gustafsson, L.-G., 2008. The impacts of climate change and urbanisation on drainage in Helsingborg, Sweden: Suburban stormwater.
Journal of Hydrology, 350(1), 114–125. Doi:
10.1016/j.jhydrol.2007.11.006
Seto, K. C., Sánchez-Rodríguez, R. & Fragkias, M., 2010. The New Geography of Contemporary Urbanization and the Environment. Annual Review of Environment and Resources, 35(1), 167–194.
Doi:10.1146/annurev-environ-100809-125336 Shuster, W.D., Bonta, J., Thurston, H., Warnemuende
E. & Smith, D.R., 2005. Impacts of impervious surface on watershed hydrology: A review. Urban Water Journal, 2. (4): 263-275. Doi:
10.1080/15730620500386529
Steffen, J., Jensen, M., Pomeroy, C. A. & Burian, S. J., 2013. Water Supply and Stormwater Management Benefits of Residential Rainwater Harvesting in U.S.
Cities. JAWRA Journal of the American Water Resources Association, 49(4), 810–824. Doi:
10.1111/jawr.12038
Torres, M.N., Fontecha, J.E., Zhu, Z., Walteros, J.L. &
Rodríguez, J.P., 2020. A participatory approach based on stochastic optimization for the spatial allocation of Sustainable Urban Drainage Systems for rainwater harvesting. Environmental Modelling
& Software, 123, 104532. Doi:
10.1016/j.envsoft.2019.104532
Unger, J., Lelovics, E. & Gál, T., 2014. Local Climate Zone mapping using GIS methods in Szeged.
Hungarian Geographical Bulletin, 63. (1): 29-41.
Doi: 10.15201/hungeobull.63.1.3
Unger, J. & Gál, T., 2011. Automata állomáspár Szegeden – A városi klímamódosító hatás online megjelenítése (Automatic station pair in Szeged – Online display of the urban climate change effect).
Légkör, 56: 93-96.
Van De Ven, F.H.M., 1990. Water Balances of Urban Areas. Hydrological Processes and Water Management in Urban Areas. International Association of Hydrological Sciences Publication, 198. 21–32.
Velasco-Muñoz, J.F., Aznar-Sánchez, J.A., Batlles- delaFuente, A. & Fidelibus, M. D., 2019.
Rainwater Harvesting for Agricultural Irrigation:
An Analysis of Global Research. Water, 11(7). Doi:
10.3390/w11071320
Villar-Navascués, R., Pérez-Morales, A. & Gil-Guirado, S., 2020. Assessment of Rainwater Harvesting Potential from Roof Catchments through Clustering Analysis. Water, 12(9):2623. Doi:
10.3390/w12092623
Zabidi, H.A., Goh, H.W., Chang, C.K., Chan, N.W. &
Zakaria, N.A., 2020. N.A., A Review of Roof and Pond Rainwater Harvesting Systems for Water Security: The Design, Performance and Way Forward. Water, 12(11):3163. Doi:
10.3390/w12113163
Received at: 12. 07. 2021 Revised at: 02. 08. 2021
Accepted for publication at: 06. 08. 2021 Published online at: 07. 08. 2021