KATONAI- KÖZLÖNY
Gábor Katona
1Changes in the Quality and Rating of Surface Waters to Our Days on a Selected Section of River Tisza
A felszíni vizek minőségének és minősítésének változása napjainkig a Tisza-folyó egy kijelölt szakaszán
The purpose of this study is to present the changes of the water quality of River Tisza over the past decades and the results of the efforts made in order to improve the unfavorable conditions.
In order to compare the different water quality examination methods and results, I will overview the previous and present rating methodologies, and will also discuss the deficiencies of rating and their potential impact on safety.
Keywords: water quality change, Water Framework Directive, rating, industry, pollution
Jelen tanulmány célja annak bemutatása, hogy milyen változásokon ment át a felszíni vizek vízminősége az elmúlt évtizedekben, illetve hogy a kedvezőtlen állapot javítása érdekében tett lépések milyen eredményhez vezettek. A vízminőségi állapotvizsgálat eltérő módszereinek és eredményeinek összehasonlítása érdekében bemutatom a korábbi és a napjainkban használt minősítési metodikákat, továbbá kitérek a minősítés esetleges hiányosságaira és ezeknek a biztonságra gyakorolt hatására.
Kulcsszavak: vízminőség-változás, Víz Keretirányelv, minősítés, ipar, szennyezés
Introduction
As population boom and industrial development resulted in polluted groundwater and disturbed oxygen balance, a demand for a better understanding and analysis of water quality has appeared,
1 National University of Public Service, Doctoral School of Military Engineering, e-mail: katona.gabor@kotivizig.hu, ORCID: https://orcid.org/0000-0003-2780-9937
as early as the 19th century. The fight against contaminated drinking water in larger towns and incidences like the “Great Stink” in London have first drawn attention to the risk of polluted waters on human health, as well as to the damage on water bodies caused by everyday human activity. After recognising these problems the working out of technical solutions has followed, besides the inspection and analysis of water quality. But what can we do about water pollution if we are only enduring it and the source is located outside our boundaries? The water quality of River Tisza, taking its rise in Ukraine and reaching Hungary through Romania, is already affected by the neighboring countries. These effects are manifested in communal sewage burden, which in case of sufficient runoff and a certain dilution are not traceable or are negligible. Also in case of solid waste pollution, although its removal takes significant extra effort, it is not affecting water quality in a measurable extent. Industrial contaminants can also occur occasionally, which may result in serious water quality deterioration or even ecological disaster. The need to avoid of the extreme effects of climate change, those of complex utilisation, and several other effects, makes it more important than ever to understand and supervise the water quality of this river, which has gone through significant changes in the last decades.
Quality and Rating of Surface Waters
Several definitions have been created for water quality. Lajos Felföldy had said in a publication in 1974: “Water quality is the complex of all the properties of waters.”2 According to László Som- lyódy,“the general definition of water quality is the complex of physical, chemical and biological features.”3 Half a century separates the publications of these two experts, still, the essence of their statements have not changed at all, in spite of our fast developing world.
Not like water quality itself, and its judgement and rating. The majority of rivers and under- ground waters in Hungary were potable until the beginning of the last century. As a consequence of urbanisation and industrial development after World War I, this property of the water has gradually disappeared and the process resulted in really low water quality by the 1950-60’s.
The quality of surface water depends on several factors, including biotic or abiotic factors and also anthropogenic effects. Environmental factors rarely cause long term water quality deterio- ration – for instance, the diluted oxygen content of frozen lakes decreases, but it restores after the ice melts –, and on human timescale they are not sensible or influenceable. Human influence, however, may cause long term water quality alterations, especially while the polluting activity lasts. The human factors with the greatest effect on water quality are the following:
• industrial and agricultural activity in the catchment area;
• collection and purification of sewage and the quality of purified water.
In order to be able to understand and compare the status of our waters they need to be rated in a uniform system. After determining the limit values of water components, the classification and
2 Felföldi 1974, 5.
3 Somlyódy 2018, 94.
rating is done in a standardised system, based on standards and conventions. “The determination of water quality consists of professional sampling and on-site physical, chemical, biological and bacteriological examinations. We also need to know how much pollution the water can bear, just as its quantity and the runoff. Classification of these analytical data will lead to the rating of water, which in scientific systems can be done based on:
• extent and quality of salt content;
• contamination (e. g. oxygen consumption, self-cleaning ability);
• toxic content (e. g. heavy metals, cyanides);
• health issues (e. g. contamination, radioactivity);
• other aspects.
Waters should be classified based on the quality requirements concerning their different practical uses:
• drinking water;
• industrial water;
• irrigation;
• other usage.”4
Regular water quality monitoring of surface waters in Hungary was started based on the sug- gestions of COMECON in the 1960’s. Surface waters were rated according to the instructions of the document called “Uniform Water Quality Criteria, Standards and Classification Principles”, published by the National Office of Water Management (OVH) in 1964. Based on this document, waters were distributed into four classes.
Built on this, but synchronised with the European standards, a national standard, the MSZ 10-172/1-83, Surface water quality – Evaluating and qualifying system (MSZ = Hungar- ian Standard), was born in 1983, and it integrated the technical directives of OVH called MI 10-172/2-84. Surface water quality – Water Quality Core Network and MI 10-172/3-85. Surface water quality – Determination of limit values, sampling frequency and investigated components at the sampling points of the core network. These were in effect until 1993. This standard determined the location of core network stations, the sampling frequencies, the components that should be investigated and the limit values.
The following rating systems had been introduced:
• rating of surface waters based on biological stability;
• rating of surface waters for supplying drinking water;
• rating of surface waters for supplying industrial water;
• rating of surface waters for supplying irrigation water;
• rating of surface waters regarding aquaculture related requirements;
• integrated requirements of surface water quality;
• water quality requirements of open water bathing areas.
4 Halász–Földi 2014, 53.
For the above listed systems there was a three-grade classification: clean, acceptable and un- favorable.
Water Quality Status in the 20
thCentury
In the 1980’s the water quality regarding different uses of water in the Middle-Tisza district was poor. This is confirmed by the water quality monitoring of Kisköre Reservoir made between 1980–1984.5 Examinations were made in accordance with the actual requirements of that era, by the above listed standards, focusing on drinking and irrigation water supply and also on industrial and aquaculture usage. Among these results I will analyse only the nowadays more relevant drinking, irrigation and aquaculture water supply, since the body of water kept in the reservoir supplies water rather for irrigation and fish culture than industrial use, and on a lower section of Middle-Tisza district the water quality is still a crucial issue due to surface water abstraction at Szolnok. Although the water intake structure is located 70 kilometers downstream from Kisköre Reservoir, the water quality – with the exception of occasional large flood waves – does not change considerably, since there are no significant water or sewage connections on this section that would affect water quality.
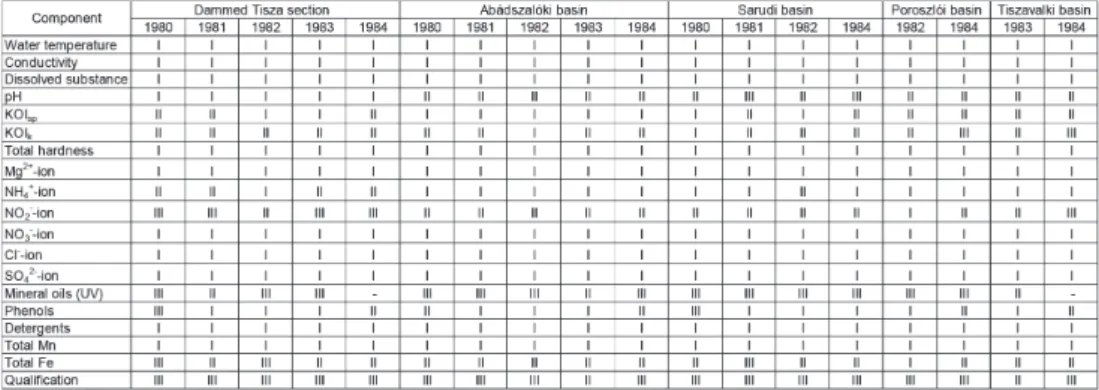
The classification of Kisköre Reservoir regarding drinking, irrigation and aquaculture water supply is shown in tables 1, 2 and 3, where class I refers to clean, class II to slightly polluted, while class III to polluted water quality status.
Table 1. Classification of different water bodies of Kisköre Reservoir in terms of drinking water between 1980–1984.
Source: Waijandt–Végvári 1987
5 Waijandt–Végvári 1987.
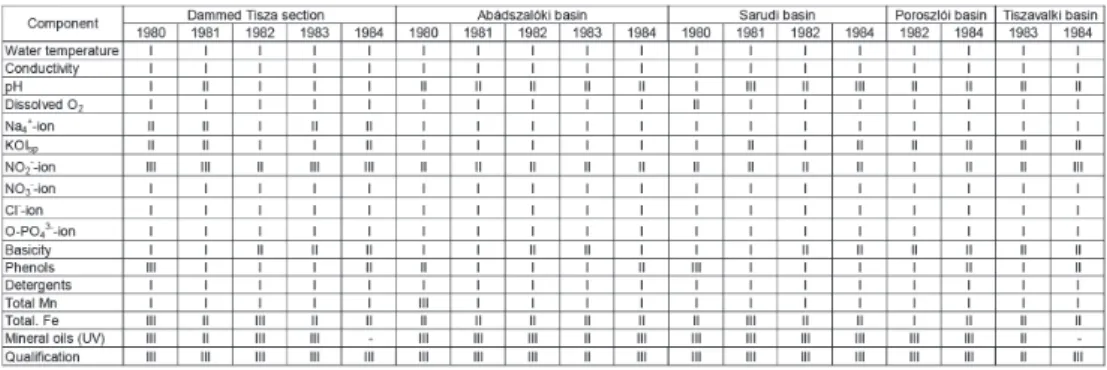
Table 2. Classification of different water bodies of Kisköre Reservoir in terms of irrigation water between 1980–1984
Source: Waijandt–Végvári 1987
Table 3. Classification of different water bodies of Kisköre Reservoir in terms of aquaculture water between 1980–1984
Source: Waijandt–Végvári 1987
Based on today’s “one bad all bad” rating principle, it is clear that the water quality of drinking and aquaculture water was almost entirely of grade III (polluted), while irrigation water was of grade II, slightly polluted. Among the examined water bodies the raised Tisza section was of the worst quality. In 1980 the water quality in terms of nitrite-ion (NO2-), mineral oils, phenols and total iron (Fe) was classified as of grade III. Typically, nitrite-ion, mineral oils and iron showed extraordinary poor values in the following years as well, which were the symptoms of typical industrial pollutions those days.
The determining components of the annual rating of certain water bodies of the reservoir were nitrite-ion, mineral oils, phenols and total iron. Due to unfavourable biological processes, the pH value and chemical oxygen demand – mainly KOIk – have shown IInd and IIIrd grade quality status. The similarity with the river’s water quality is not surprising, since the annual refilling and draining was made from and into the river. However, while on the raised Tisza section this data resulted in IIIrd grade classification, the water quality of other water bodies rose to IInd
grade – with the exception of mineral oils –, which can be explained with sedimentation and decay during the longer residence time. The adverse results of biological processes typically eventuated decreasing tendencies in shallow water bodies in terms of pH, KOIk and KOIps as years have passed. In order to considerably improve these conditions, the technical reconsid- eration of the operation of the reservoir and the construction of flushing canals were needed.
Based on the above we can state that the quality of water retained in the reservoir – after sorting out the technical deficiencies causing biological problems – has improved, however, this involved that sedimented components have accumulated in the sludge. This may be subjected to further investigations.
Water Framework Directive and River Basin Management Plan
By 1993 the rating system based on the former COMECON methodology became out-of-date, and the political changes as well as the strengthening of environment protection also demanded the introduction of a new one. Between 1994–2006 waters were rated based on a Hungarian Standard called MSZ-12749:1993. Quality, quality features and rating of surface waters quality.
This standard determined the locations of sampling points in the core network, the annual sampling frequency for each sampling point and also the group of elements to be examined, which has been largely expanded compared to former years. The examined variables were distributed in five main groups and four subgroups:
• Group A: oxygen balance characteristics;
• Group B: nitrogen- and phosphorus balance characteristics;
• Group C: microbiological characteristics;
• Group D: micro-pollutants and toxicity;
– Subgroup D1: inorganic micro-pollutants;
– Subgroup D2: organic micro-pollutants;
– Subgroup D3: toxicity;
– Subgroup D4: radioactive substances;
• Group E: other characteristics.
The standard distinguishes five water quality grades:
• Grade I: excellent water;
• Grade II: good water;
• Grade III: acceptable water;
• Grade IV: polluted water;
• Grade V: highly polluted water.
Nevertheless, water quality has not changed significantly in the following years in the examined area, where, after all, the changes were rather the consequences of decreasing industrial impact than a conscious environment protecting activity.
Similar tendencies took place in other European countries, so in the 1990’s a new, common Water Policy of the European Union was created and the elaboration of its implementation had been started by way of the 2000/60/EC Directive of the European Parliament and Council (23 October 2000), which determined the framework of the common intervention in issues regarding water policy (Water Framework Directive – WFD;6 it came into effect on 22 December 2000). It set out the ambitious objective of reaching good ecological and chemical status in the case of natural water bodies in all the member states by the end of 2015, while good ecological and chemical potential in the case of highly modified and artificial water bodies. “Good status”
refers not only to the cleanness of water but also the undisturbed state of water related habitats as well as the sufficient amount of water. Hungary – mainly due to its geographic location – is fundamentally interested in the soonest achievement of the WFD goals, so it was ratified right after Hungary joined EU. The most important document of its implementation is Government Regulation 221/2004 (VII. 21.) about the rules of water basin management.
Based on the regulations of WFD and this Government Regulation, a “River Basin Manage- ment Plan of the Hungarian Part of Danube Catchment Area” was made on 22 December 2009 and published in 2010.7 This document determines and describes the catchment areas and water bodies, sets out goals and implementation actions, moreover, it specifies the evaluation of water conditions; for continuous tracing of the achieved results, it lays down monitoring tasks. With Government Regulation 1155/2016 (III. 31)8 Hungary has strengthened the content of the document published on the 22nd of December, 2015, called Hungarian Part of Danube Catchment Area, River Basin Management Plan – 2015 (VGT-1),9 issuing a revised river basin management plan (VGT-2).
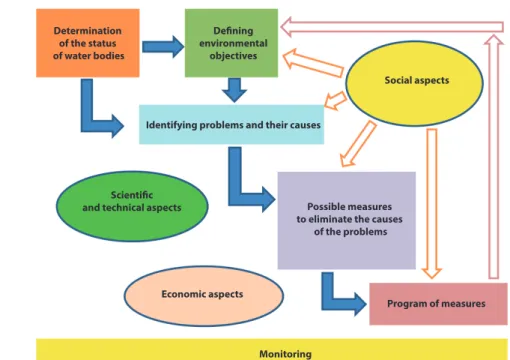
River basin management has fundamentally changed water management and water quality rating.10 In our days the rating of the status of certain water bodies gives a solid base for actions aiming at good ecological status. As a result of continuous monitoring, the impact of these actions can be measured directly, they can be traced, so if any measure fails to achieve its goal, the action can be modified. WFD has a multi-step, iterative planning process, during which ecological, technical, social and economic aspects need to be synchronised. The most important steps of planning are shown in Figure 1.
6 Directive 2000/60/EC of the European Parliament and of the Council of 23 October 2000 establishing a frame- work for Community action in the field of water policy.
7 A Duna-vízgyűjtő magyarországi része: Vízgyűjtő-Gazdálkodási Terv 2010.
8 Government Regulation 1155/2016 (III. 31) on Hungary’s revised river basin management plan 2015.
9 A Duna-vízgyűjtő magyarországi része: Vízgyűjtő-Gazdálkodási Terv, 2015. The related documents are available at: www.vizugy.hu/index.php?module=vizstrat&programelemid=149 (Downloaded: 18 May 2020.)
10 Kling 2017, 256.
Determination of the status of water bodies
Defining environmental
objectives
Social aspects
Program of measures
Monitoring Economic aspects
Identifying problems and their causes
Scientific
and technical aspects Possible measures
to eliminate the causes of the problems
Figure 1. Most important steps of WFD planning
Source: based on A vízgyűjtő-gazdálkodás tervezés módszertani elemei 2011
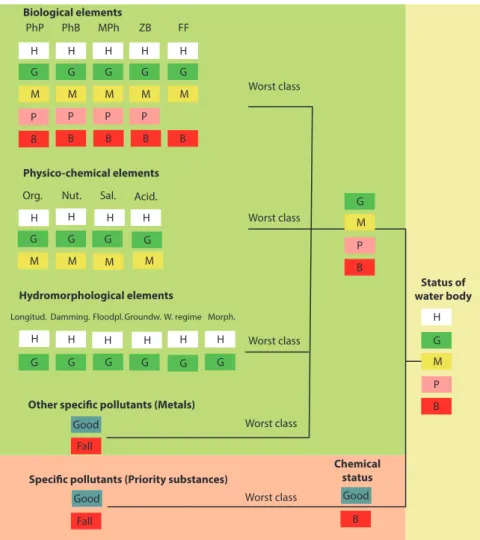
Hungarian river basin management planning comprises 4 sub-basins, 17 design units and 42 design subunits, containing a total of 869 flowing and 213 still water bodies. The determi- nation of the ecological status of a water body is done by the examination of the biological and supportive physical-chemical parameters, as shown in Figure 2.
PhP
Org.
Longitud. Damming. Floodpl.Groundw. W. regime Morph.
Nut. Sal. Acid.
PhB MPh ZB FF
Worst class
Worst class
Worst class
Worst class
Worst class H
H H H H
H H H H
H H H H H H
G
G
G G G G G G
G G G
G G G G
M
M M M M
M M M M
P P P P
B B B B B
Fall
Fall Good
Good Good
B
H G M P B Biological elements
Physico-chemical elements
Hydromorphological elements
Other specific pollutants (Metals)
Specific pollutants (Priority substances)
Chemical status
Status of water body G
M P B
Figure 2. Schematic figure of rating system of surface waters
Source: based on the figure in Vízgyűjtő-gazdálkodási terv – Tisza részvízgyűjtő, 2010, 75.
Rating, similarly to previous standard MSZ 12749:1993, has five grades. The first step of the rating procedure is to determine the annual average of the examined component; then – taking into consideration the quality related limit values – the component gets a rating code number, which will than be marked in VGT-1 as follows:
• 5 high status/potential;
• 4 good status/potential;
• 3 medium status/potential;
• 2 poor status/potential;
• 1 bad status/potential.
In VGT-2, component rating is scaled the other way around (1–excellent, 5–bad status/poten- tial). As it is an integrated physical-chemical rating, the examined water body gets the rating of the worst component (“one bad all bad” principle).
WFD Rating of Lake Tisza
According to WFD, the sampling, analysis and rating is made by governmental laboratories, however, in the case of Kisköre Reservoir, it is the Middle-Tisza District Water Directorate (KÖTIVIZIG) who acts, due to the unique status of the reservoir. The evaluation of the status of water bodies is based on the modified water body rating included in VGT-2. Lake Tisza is referred to as a highly modified water body (type LW5), the separate parts of which form a hydraulic complex in the following distribution:
• AIW389, Lake Tisza – Tisza main riverbed, from Tiszabábolna to Kisköre (RW8N);
• ANS560, Lake Tisza – Abádszalók-basin (LW5);
• ANS560, Lake Tisza – Sarud-basin (LW5);
• ANS560, Lake Tisza – Poroszló-basin (LW5);
• ANS560, Lake Tisza – Tiszavalk-basin (LW5).
This group of water bodies can be considered as one intact water body, since – while maintain- ing the raised water level – the adverse hydro-morphological alterations cannot be dissolved individually in any of the elements of the group. However, in terms of rating, it forms a group of five separate water bodies, since the maximum ecological potentials of the highly modified status are very different. River Tisza flowing through the Kisköre Reservoir can be classified as RW8N (flatland – low gradient – calcareous – moderately fine riverbed material – extremely large catchment area). Abádszalók-, Sarud-, Poroszló- and Tiszavalk-basins are highly modified still water types, the maximum ecological potential of which is LW5 (flatland – calcareous or organic – with small, medium or large surface, shallow or very shallow – constantly flooded still water). Being categorised as highly modified is justified based on the fact that, as a result of the raised water level both in the main river bed and in the basins, there are significant and persistent hydro-morphological changes compared to the reference values of type 2 water flows from flatland 20 group. With artificial raising the water levels became higher, flowing velocity in the main river bed became slower and the water cover of basins became persistent.
Due to the significant amount of organic substance in the reservoir and the fast warming of the shallow water, the water quality status became different from the one in the main river.
The reservoir also functions as the main receiver of excess waters and minor water flows.
Consequently, the water quality status differs even more. It does not automatically mean worse water quality, but this delicate balance demands continuous monitoring and occasional interference. The quality of water arriving to the reservoir from River Tisza is already known thanks to the sampling points on the upper sections, and only acceptable quality water is let into the reservoir. If there is an event in the upper river sections causing unfavorable water quality status, the flushing canals of Kisköre Reservoir are kept closed.
133
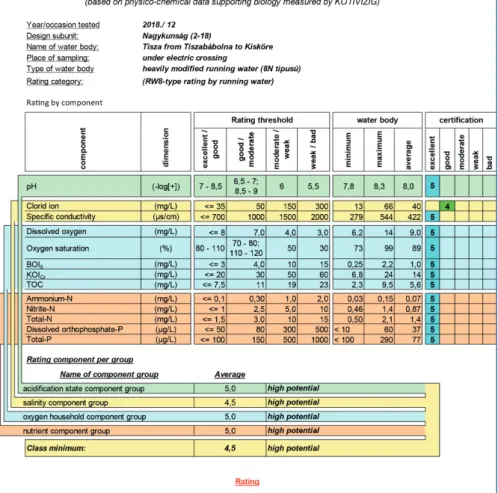
The rating made by the Regional Laboratory of KÖTIVIZIG based on the samples of year 2018 and the results of twelve analyses is shown by Figure 3.
Figure 3. Rating of the Tisza river section of Kisköre Reservoir in the year 2018
Source: based on Laczi et al. 2018, 68.
Rating was done according to the scale of VGT-1 (despite the fact that VGT-2 has been in- troduced) in order to make comparison with previous data possible. The basic data of the examination are provided by a monthly sampling covering the vegetation period between spring and autumn, twelve times in the river bed and eight times in the reservoir. In the winter period between November and February the reservoir is drained, so the sampling points in the
basin are not accessible and there is no water to sample; therefore, there was no sampling in this period. In 2018, as a result of the March-April flood waves, the number of samplings was reduced to six. At the event of a flood wave the measured values can strongly deviate from the average values of normal or low water-level periods because of the large amount of drifting material and alluvium, so there was no sampling in this period. Rating was done based on the averages of the samples. In the tables the maximum and minimum values are also shown.
We can state that even the extreme values have shown difference from excellent quality only once. Consequently, the Tiszabábolna–Kisköre section of River Tisza has excellent potential.
According to the results, all the other above mentioned water bodies of the reservoir show similar values. Abádszalók-basin was rated excellent, Sarud-basin good, Poroszló-basin excellent and Tiszavalk-basin also excellent. It is also important to mention that the partial results show an improving tendency. In the last five years the water quality was rated good in all the basins:
between 2015–2017 improvement within the given rating limits was observed, while in 2018 the water quality of three basins have improved from good to excellent potential.
According to the rating of WFD, the chemical quality of the river has improved. The ratings from 1985 have shown continuous burdens, because of which the water was slightly polluted or occasionally even polluted. So the provisions of VGT-1 and VGT-2 proved to be effective.
However, these results would deserve examinations from different aspects as well.
Other Factors Affecting Safety
In the case of surface waters safety is top priority. If water quality in general is good, we have to do our best to preserve that, especially in the case of retained waters. There are only a very few rivers originating inside Hungary, the majority of Hungarian rivers comes from abroad.
Consequently, we are not able to influence water quality, only to monitor it. The catchment area of River Tisza is shared by five countries as follows:
• Romania 46.2%;
• Hungary 29.4%;
• Slovakia 9.7%;
• Ukraine 8.1%;
• Serbia 6.6%.
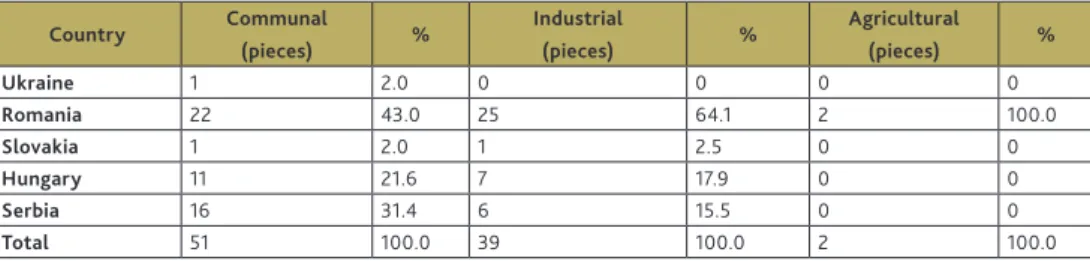
According to its geographical location downstream, Serbia has no effect on the water quality of upstream river sections. Slovakia has access to Tisza – its boundary river – only on a few thousand meters stretch, but the catchment areas of the tributary rivers Bodrog and Sajó are located there with 13 600 and 12 700 km2; these together reach a little less than 10% of the Tisza catchment area in total. Ukraine’s share is even smaller. The Romanian share, however, is much larger than any other country’s, reaching almost half of the total area. Consequently, its effect is also significant; according to the report in VGT-1 made by the International Com- mission for the Protection of the Danube River, the share of significant burdens (source points) in the catchment area is as follows:
Table 4. Significant burdens in the catchment area of River Tisza
Country Communal
(pieces) % Industrial
(pieces) % Agricultural
(pieces) %
Ukraine 1 2.0 0 0 0 0
Romania 22 43.0 25 64.1 2 100.0
Slovakia 1 2.0 1 2.5 0 0
Hungary 11 21.6 7 17.9 0 0
Serbia 16 31.4 6 15.5 0 0
Total 51 100.0 39 100.0 2 100.0
Source: A Tisza vízgyűjtő helyzetértékelése 2007, 21.
Based on the above numbers Romania with its largest share of the catchment area has a larger number of communal and industrial facilities meaning potential burden. Among communal burdens Romania gives 43.0% of the total 64.1% of the industrial burdens. If we don’t take Serbia into consideration being a downstream country this share goes up to 62.8% for the communal and 75.8% for the industrial burdens, which highly exceeds the proportion of the other countries considering the 46.2% share of the total area. The extreme high value of in- dustrial burdens comes mainly from mining activity.
Mining is a well-grown industry in the Tisza catchment area. Among the countries along the river, Romania has the largest mining and ore processing industry with significant copper, lead, zinc, gold, silver, bauxite, manganese and iron ore supplies. The environmental effect of abandoned mines is a massive burden, which can dramatically increase after closing the mine.
It often happens that the unfavorable effects of mining can be felt right after closing the mine and finishing mining activity. It is very difficult to control these effects, because it depends on the storage of large amounts of water. Mining produces more waste than any other industry.
In certain mines there are several hundred million or even billion tons of waste produced, the processing of which is not solved, and the costs of decontamination are frightening. The greatest environmental risk of mining activity is mining water. The quantity and chemical compound of these waters, especially the heavy metal content and the low pH value, can largely differ from the hydrogeological and hydrochemical conditions of the given region. In many cases the measurement of the quantity, quality and the diffuse emission is not possible.11
A particular example is the cyanide pollution that happened in Romania on 30 January 2000 and the heavy metal pollution following it in March. Cyanide pollution originating from gold mining got into Lápos stream mainly in the form of cyanide-complexes of water soluble metals, then via River Szamos to River Tisza. The maximum value of cyanide content in Szamos was between 20–30 mg/l, in River Tisza downstream from Szamos it was 10–15 mg/l, and it continuously dropped thanks to the tributaries and also the clean water stored in Kisköre res- ervoir, which was gradually drained when the pollution arrived. The maximum cyanide content of the water leaving the country was 1.49 mg/l. Besides the cyanide content the dissolved (in complex) heavy metal content was also measured, and these measurements proved that
11 A Tisza vízgyűjtő helyzetértékelése 2007, 24.
copper was the element in the largest concentration, but besides that, zinc, lead and silver were also present to an extent exceeding the content of natural origin.
After the above mentioned incident the dams of the settling pond of a mine near Borsabánya (Băile Borșa, Romania) collapsed because of the heavy rainfall on 10 March 2000, and about twenty thousand tons of heavy metal polluted slurry got into Vasér stream, then via Visó to river Tisza. The flood wave polluted with lead, copper and zinc reached Hungary on 11 March at Tiszabecs. The maximum of the total lead and zinc concentration in Tiszabecs section on 12 March was 2.9 mg/l, while copper was 0.86 mg/l (before the pollution reached Hungary, the concentration of the above listed elements were typically under 0.1 mg/l). The duration of the first flood wave was about one and a half day. The amount of lead flowing through this river section in this period was estimated around 50 tons, while copper around 20 and zinc around 70 tons. The majority of heavy metal burden (more than 90%) was attached to floating material transport. In the evening of 15 March the second flood wave has reached the same river section at Tiszabecs; it was smaller than the previous pollution both in terms of duration and concentration.
The result of these pollutions was an ecological disaster, where hundreds of tons of fish and other animals died, and it took a very long time for the river to recover. The financial and economic damage were invaluable and were never compensated by anyone. These events also helped to trigger the efforts to establish an automatic monitoring network on the Upper-Tisza catchment area, but it has not been realised ever since. However, these pollutions should be taken seriously, not only at the occasion of a spectacular accident causing huge damage. In Japan, mass contagion was caused by eating vegetables polluted with cadmium of mine-water origin (Itai-itai disease) and also by methyl-mercury accumulated as a result of industrial activity (Minamata disease). These events squarely show that the uncontrolled pollution of natural waters with toxic metals have serious consequences.12 Today there is no continuous water quality monitoring in Hungary. Even daily measurements are made only in two locations, at Pusztataksony by KÖTIVIZIG and at Szolnok next to the drinking water abstraction facility by the water work’s own laboratory. However, these are only general or drinking-water specific examinations. Thus, in case of an accident or intentional pollution the slurry collected in mining facilities on the upper catchment area may continuously contaminate the effluent waters to an extent lower than the permitted limit.
Conclusions and Suggestions
The water quality of river Tisza has seriously improved in the last decades despite of significant pollutions. However, the determination of water quality status is becoming a more complex task. After the introduction of WFD, rating is made by different standards, based on which the status of our waters is rated not only with regard to the physical, chemical and biological
12 Rácz 2011.
conditions but also ecological aspects got into focus. As a result of the introduced measures water quality is continuously improving.
However, even though many measures were taken, and treaties and organisations were established throughout Europe inside and outside the member state boundaries, there is still no uniform rating, monitoring or alarm system between countries sharing the catchment area with different economic and social background. Therefore the threat of a disaster similar to those of the year 2000 still exists.
In order to make the results achieved in water quality improvement sustainable, the widening of international treaties should definitely be encouraged and we have to set up a common monitoring and alarm system as soon as possible. Furthermore, the suitability of the given threshold limit values should be revised so that the water quality changes indicating contaminations can be reflected in the rating system.
References
Felföldy Lajos (1974): A biológiai vízminősítés. Budapest, Vízügyi dokumentációs és Továbbképző Intézet.
Halász László – FÖLDI László (2014): Környezetbiztonság. Budapest, Nemzeti Közszolgálati Egyetem.
Kling István (2017): A vízvédelem a víz ügyeinek intézményi rendjében. Védelem Tudomány, 2. évf. 2.
sz. 256–303.
Laczi Zoltán et al. szerk. (2018): Negyvenéves a Tisza-tó. Szolnok, Közép-Tisza-vidéki Vízügyi Igazgatóság, Somlyódy László (2018): Felszíni vizek minősége. Modellezés és szabályozás. Budapest, Typotex.
Waijandt János – Végvári Péter (1987): A Kiskörei-tározó vízminőségének vízhasználatok szerinti értékelése és a vízminőség szabályozásának lehetősége. In Karcagi Gábor – Bancsi István szerk.:
Album a Kiskörei-tározó térségéről. Szolnok, Középtiszavidéki Vízügyi Igazgatóság. 215–224.
Legal References
EU:
Directive 2000/60/EC of the European Parliament and of the Council of 23 October 2000 establishing a framework for Community action in the field of water policy
Hungary:
Government Regulation 221/2004 (VII.21.) about the rules of water basin management.
Government Regulation 1155/2016 (III.31) on Hungary’s revised river basin management plan 2015.
Internet References
A Duna-vízgyűjtő magyarországi része: Vízgyűjtő-Gazdálkodási Terv. April 2010. Vízügyi és Környezet- védelmi Központi Igazgatóság. Available: https://vgtszolnok.files.wordpress.com/2011/04/ma- gyarorszag_vizgyujto_gazdalkodasi_terve.pdf d. (Downloaded: 03. 12. 2019.)
A Duna-vízgyűjtő magyarországi része: Vízgyűjtő-Gazdálkodási Terv, 2015. OVH. Available: www.vizugy.
hu/vizstrategia/documents/E3E737A3-3EBC-4B6F-973C-5DD9B8A6DBAB/OVGT_foanyag_veg- leges.pdf (Downloaded: 30. 11. 2019.)
A Tisza vízgyűjtő helyzetértékelése 2007 – Szakmai összefoglaló. IPCDR. Available: www.terport.hu/
webfm_send/79 (Downloaded: 18. 11. 2019.)
A vízgyűjtő-gazdálkodás tervezés módszertani elemei. Közép-Tisza-vidéki Vízügyi Igazgatóság.
18 01 2011. Available: www.kotivizig.hu/index.php?option=com_content&view=artic le&id=129:
a-vizgyjt-gazdalkodas-tervezes-modszertani-elemei&catid=14:vizgyjt-gazdalkodas-tervezes&Ite- mid=68 (Downloaded: 18. 11. 2019.)
Rácz Istvánné (2011): Vízkémia II. Available: www.tankonyvtar.hu/hu/tartalom/tamop412A/2010-0019_
Vizkemia_II/ch08.html (Downloaded: 30. 11. 2019.)
Vízgyűjtő-gazdálkodási terv – Tisza részvízgyűjtő. April 2010. Vízügyi és Környezetvédelmi Központi Igazgatóság. Available: https://vgtszolnok.files.wordpress.com/2011/04/tisza_reszvizgyujto_viz- gazdalkodasi_terv.pdf (Downloaded: 18. 05. 2020.)