Integrative epigenomics
in Sjögren´s syndrome reveals novel pathways and a strong interaction between the HLA,
autoantibodies and the interferon signature
María Teruel
1, Guillermo Barturen
1, Manuel Martínez‑Bueno
1, Olivia Castellini‑Pérez
1, Miguel Barroso‑Gil
1, Elena Povedano
1, Martin Kerick
2, Francesc Català‑Moll
3,4, Zuzanna Makowska
5, Anne Buttgereit
5, PRECISESADS Clinical Consortium
*,
PRECISESADS Flow Cytometry Study Group
*, Jacques‑Olivier Pers
6, Concepción Marañón
1, Esteban Ballestar
3,4, Javier Martin
2, Elena Carnero‑Montoro
1,42*&
Marta E. Alarcón‑Riquelme
1,7,42*Primary Sjögren’s syndrome (SS) is a systemic autoimmune disease characterized by lymphocytic infiltration and damage of exocrine salivary and lacrimal glands. The etiology of SS is complex with environmental triggers and genetic factors involved. By conducting an integrated multi‑omics study, we confirmed a vast coordinated hypomethylation and overexpression effects in IFN‑related genes, what is known as the IFN signature. Stratified and conditional analyses suggest a strong interaction between SS‑associated HLA genetic variation and the presence of Anti‑Ro/SSA autoantibodies in driving the IFN epigenetic signature and determining SS. We report a novel epigenetic signature characterized by increased DNA methylation levels in a large number of genes enriched in pathways such as collagen metabolism and extracellular matrix organization. We identified potential new genetic variants associated with SS that might mediate their risk by altering DNA methylation or gene expression patterns, as well as disease‑interacting genetic variants that exhibit regulatory function only in the SS population. Our study sheds new light on the interaction between genetics, autoantibody profiles, DNA methylation and gene expression in SS, and contributes to elucidate the genetic architecture of gene regulation in an autoimmune population.
Primary Sjögren’s syndrome (SS) [MIM 270150] is a systemic autoimmune disease characterized by lymphoid infiltration and tissue damage of the exocrine glands, mainly the salivary and lacrimal glands1. The prevalence of SS is about 1% of the World population being the main risk group middle-aged women. SS patients show great clinical heterogeneity that is manifested at the serological, genetic, and cellular level and in their capacity to respond to treatment. SS patients with anti-Ro/SSA or anti-La/SSB autoantibodies usually develop a more severe disease with systemic manifestations and the appearance of lymphomas in a percentage of them2.
OPEN
1GENYO, Center for Genomics and Oncological Research Pfizer/University of Granada/Andalusian Regional Government, 18016 Granada, Spain. 2IPBLN-CSIC, Instituto de Parasitología y Biomedicina López-Neyra, Consejo Superior de Investigaciones Científicas, 18016 Granada, Spain. 3Epigenetics and Immune Disease Group, Josep Carreras Research Institute (IJC), 08916 Badalona, Barcelona, Spain. 4IDIBELL, Bellvitge Biomedical Research Institute 08907 L’Hospitalet de Llobregat, Barcelona, Spain. 5Pharmaceuticals Division, Bayer Pharma Aktiengesellschaft, Berlin, Germany. 6Université de Brest, INSERM, Labex IGO, CHU de Brest, Brest, France. 7Institute for Environmental Medicine, Karolinska Institutet, 171 67 Solna, Sweden. 42These authors contributed equally: Elena Carnero-Montoro and Marta E. Alarcón-Riquelme. *List of authors and their affiliations appears at the end of the paper.*email: elena.carnero@genyo.es; marta.alarcon@genyo.es
The etiology of SS is complex and not completely understood; environmental, genetic and epigenetic factors are known to be involved in its development1,3–5. Genome-wide association studies (GWAS) have signified an important advance for understanding the mechanisms involved in the pathogenesis of SS. There are currently around 10 well-known risk loci implicated in SS susceptibility that have been revealed by GWAS studies3–5. The loci identified suggest the importance of the adaptive and innate immune responses in SS pathology, especially the interferon (IFN) signaling pathway. Other important pathways include B cells signaling and autoantibody pro- duction, the NF-kB signaling pathway and the T cell activation through the major histocompatibility complex6. Many of the variants detected in GWAS studies are located in non-coding intron or intergenic regions, suggesting that they have a regulatory role that is fairly unexplored7,8. Moreover, the identified SS-associated genetic variants can only explain a small proportion of the heritability observed in SS9, suggesting the possible contribution of many gene variants at the low-frequency spectrum, with lower effect sizes, and/or the implication of gene-by- environment interactions.
Functional approaches based on genome-wide data of the epigenome or the transcriptome are allowing to dive depth into the genetics of transcriptional regulation by detecting variants with potential regulatory effect, i.e., expression quantitative trait loci (eQTLs)8 or methylation quantitative trait loci (meQTLs) discovery10,11. An increasing number of studies are showing widespread regulatory effects of disease associated genetic variants and are helping to mechanistically explain the genetic risk of disease. Functional genomics approaches have been applied very successfully in cancer research, and to some extent to autoimmune diseases as well, especially in rheumatoid arthritis (RA)12,13 and systemic lupus erythematosus (SLE)14,15 , but only recently in SS16.
Epigenetic alterations can be integrators of the complex interaction between genes and the environment and are known to play a relevant role in autoimmunity by altering gene expression profiles in response to genetic factors, changing environment and immunological conditions17,18. Recently, a few epigenome-wide association studies (EWAS) have been performed in different cell types and have consistently found a pervasive hypometh- ylation in CpG sites within genes related with the type I IFN signaling, confirming this pathway as key in SS pathology19–21. Likewise, gene expression profiling of minor salivary glands or peripheral blood showed a consist- ent upregulation of IFN-inducible genes associated with SS, which was found more pronounced in the subset of cases serologically defined by increased titers of anti-Ro/SSA and anti-La/SSB autoantibodies22,23.
Despite an increasing number of studies interrogating different layers of molecular information, the exist- ing integrative approach for SS mainly focuses on deciphering the regulatory roles of previously known disease associated genetic variants discovered by GWAS16,24. Therefore, these studies have not contributed to the iden- tification of new risk variants associated with SS with regulatory function that could explain further the miss- ing heritability of this complex disease20. Furthermore, the vast majority of large-scale QTL studies have been performed in healthy populations, and do not directly compare the genetic regulatory effects between cases and controls, which could very much be different as the pathological condition imposes a different environmental and cellular context in affected individuals, especially in immune-related conditions, as we have recently described in scleroderma patients25. In this regard, several experimental studies have shown that eQTL and meQTL effects are highly context-specific, as for example cell-type specific effects have been found when studying different blood cell types26–28, and experimental studies of ex-vivo activation of immune cells have shown that eQTLs profiles are altered upon different stimuli29,30.
This work represents the first epigenome- and transcriptional-wide integrative study that combines high throughput data on genetics, DNA methylation and gene expression coupled with serological and clinical profiles in a large group of SS patients and healthy subjects. It contributes, on the one hand, to identify new molecular pathways involved in SS. On the other hand, this work identifies putative novel genetic variants implicated in the disease through changes in DNA methylation or gene expression variants with regulatory effects exhibiting disease-specificity, therefore contributing to elucidate the genetic architecture of gene regulation in an autoim- mune population. Finally, this work dissects the relationships between HLA variation, autoantibody profiles and the interferon signature in SS.
Results
Differentially methylated positions associated with SS.
We explored the DNA methylation patterns associated with SS comparing the whole blood DNA methylation level between 189 SS patients and 220 heathy subjects (Supplementary Table 1) using the Infinium MethylationEPIC BeadChip with which we could interro- gate 776,284 autosomic CpG sites. In total, we observed 118 differential methylated positions (DMPs) associated with SS at a Bonferroni-corrected threshold of P < 6.4 × 10–08 (Supplementary Table 2). The majority of SS-asso- ciated DMPs exhibited decreased methylation levels in SS patients compared with controls (91.5%), supporting the overall hypomethylation previously described in SS patients (Fig. 1a)19,20. The 118 SS-associated DMPs were annotated to 52 unique genes and 7 intergenic regions. The majority of them fell within promoters (49.2%) and gene bodies (40.7%), and only 4.2% were located in the 3’UTR. SS-associated DMPs were mainly distributed in open sea and shore CpGs and only 5 DMPs fell in CpG islands (Supplementary Fig. 1). We included an independent cohort formed by 60 SS patients and 89 healthy individuals (Supplementary Table 1) from whom we had DNA methylation data available from the 450 K array which contained half of the SS-associated DMPs detected in our discovery cohort. At a P < 0.05 we could successfully replicate 84.7% (Supplementary Table 2).The top 10 SS-associated DMPs with an average methylation difference |Δβ|> 0.1 were located within IFI44L, MX1, PARP9-DTX3L, NLRC5, IFIT1, IFIT3, IFITM1, PLSCR1, PDE7A and DDX60 genes, all of them known to be regulated by type I IFN. The most significant DMPs was the cg05696877 probe in the IFI44L gene for which an average methylation difference |Δβ|= 0.36 was observed (P = 3.5 × 10⁻²⁷; FDR = 2.7 × 10⁻²¹) between SS and controls. Functional analyses for genes underlying SS-DMPs confirmed an enrichment of GO terms related with IFN signaling (GO:0060337; P = 3.5 × 10⁻³¹; GO:0034340; P = 31.37 × 10⁻³⁰) as well as with defense response
to virus (GO:0051607; P = 2.3 × 10⁻²³) and cytokine-mediated signaling (GO:0019221; P = 1.63 × 10⁻¹⁹) (Supple- mentary Table 4).
We searched for CpGs that exhibit differences in DNA methylation variability between SS patients and con- trols and named these variable methylated positions (VMPs) (Supplementary Table 2). We observed that 80% of SS-associated DMPs also exhibited evidence of increased DNA methylation variability at a significance level of P < 0.05 in SS patients compared with healthy controls. In our replication cohort, we could replicate 83.3% of the VMPs observed. The increased DNA methylation variability associated with SS is especially pronounced for MX1 and PARP9-DXT3L genes for which we observed the largest variability differences. Increases in variabiltity might reflect epigenetic plasticity in immune-related cells and/or reflect that DNA methylation is regulated by diverse transcription factors involved in different inflammatory and immune signaling during disease progression31–35.
DNA methylation is an epigenetic mark that changes with environmental triggers as for example drugs. We investigated whether our SS-associated signatures were driven by the most common treatments in our SS patients by adjusting the linear model for treatments such as antimalarial, steroids, and immunosuppressive therapy (see details of the treatment applied to the individuals in each cohort in Supplementary Table 1). Our results show that most of the SS-DMPs (80.5%) remained significantly associated at our threshold P < 6.4 × 10–08 while the reminder showed suggestive associations, of P < 1 × 10–04, indicating that therapy applied to the SS patients does influence the DNA methylation patterns associated with SS only in a minority of sites, with modest effects (Supplementary Table 3). In fact, a comparison of the effect size of the 118 significant SS-DMPs obtained in these 2 analyses, when including or not the therapy as covariate in the linear regression, showed high correlation (Pearson’s correlation R = 0.99, P = 2.2 × 10⁻⁶). Similar results were also observed in the replication cohort, for which we observed a high replication rate (81.0%) (Supplementary Table 3). Differences in DNA methylation levels and variability of CpGs located in the X-chromosome were also evaluated in females of the discovery cohort, we could not find any significant differences in females at a significance level corrected for multiple testing (data not shown).
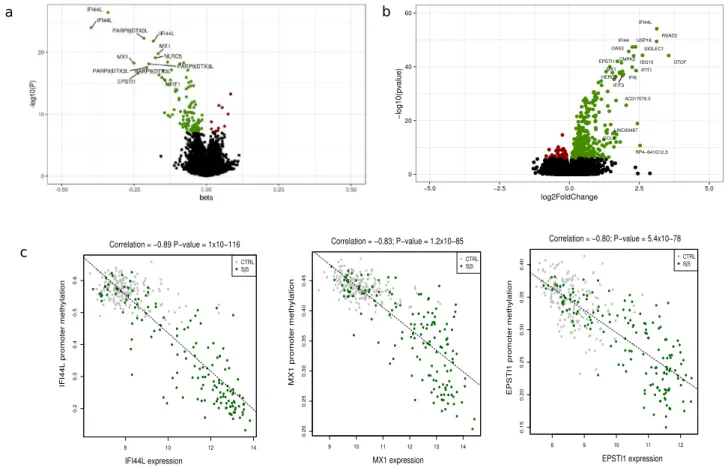
Figure 1. DNA methylation and gene expression patterns associated with SS. Volcano plot for the differential DNA methylation association study in the discovery cohort. P-values are represented on the –log10 scale in the y-axis. The effect size and direction obtained for each CpG site is depicted in the x-axis. Green dots represent significant associations with negative sign (hypomethylation). Red dots represent significant associations with positive signs. The top associations are labeled with gene names. (b) Volcano plot for the differential expression analysis in the discovery cohort. The effect size and direction obtained for each gene is depicted in the x-axis. Green dots represent significant associations with positive sign (overexpression). Red dots represent significant associations with negative signs. The top associations are labeled with gene names. (c) Plots showing high correlation between an average of DNA methylation quantified as β-values at the promoters of the most significant SS-associated DMRs and gene expression at the logarithmic scale. R software73 and Adobe Illustrator (https:// www. adobe. com/) was used to create figures.
The IFN epigenetic signature in SS is shaped by Anti‑La/SSA and associated with classII HLA genetic variation.
Hypomethylation at IFN-regulated genes has been strongly associated with the pres- ence of anti-Ro/SSA and/or anti-La/SSB autoantibodies previously 36. Stratified analyses based on anti-La/SSB and anti-Ro/SSA autoantibodies positivity show in our data that the epigenetic signature is observed only when positive anti-Ro/SSA patients were compared with healthy subjects (Supplementary Table 3, Fig. 2a-b). Indeed, all associations became far from genome-wide significant (P > 0.006) when the model that includes positive and negative SS patients was adjusted by anti-Ro/SSA presence or when only patients negative for SSA were con- trasted with controls (P > 0.05). Hierarchal clustering shows that DNA methylation profiles in anti-Ro/SSA nega- tive patients resembles that observed in healthy controls rather than to anti-Ro/SSA positive patients (Fig. 2b).While stratifying analyses based anti-La/SSB patients also yielded stronger associations in the positive group, all associations found could be explained by the presence of anti-Ro/SSA autoantibodies and nothing remained significant after adjustment for anti-Ro/SSA (Supplementary Table 3, Fig. 2b). Patients positive for both anti-Ro/
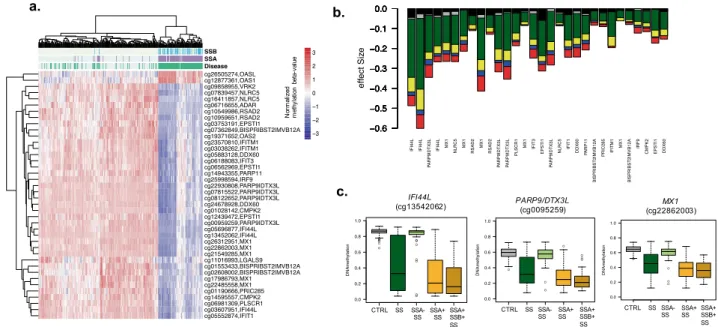
SSA and anti-La/SSA exhibited the strongest DNA methylation differences. See for example, in Fig. 2c, the DNA methylation difference at IFI44L gene (cg13452062) in all SS patients (|Δβ|= 0.40) goes up to |Δβ|= 0.53 when only SSA + patients are analysed, and is increased up to |Δβ|= 0.60 in the SSA + /SSB + group, and goes down to
|Δβ|= 0.03 in the negative-group. This trend is conserved across all SS-associated CpGs (Fig. 2b, d, e).
Previous studies have recently shown that genetic association between HLA and SS is dependent on autoan- tibody profiles36. In order to further explore the possible link between HLA and the epigenetic IFN signature, we imputed classical HLA alleles and performed a series of logistic and linear regression models based on stratifica- tion and conditional analyses. At a significance level corrected for multiple testing we identified 2 class II HLA alleles (HLA-DQB1-0201 and HLA-DRB1-0301) associated with increased risk for SS (P < 3 × 10–07) which also are associated with the Anti-La/SSA presence (P < 2 × 10–04) and with the IFN epigenetic signature (P < 1 × 10–04) measured as the decreased in DNAm at IFN-related genes (Table 1). Conditional analyses revealed that the relationship between HLA-DQB1-0201 and HLA-DRB1-0301 and the epigenetic IFN signature is lost when the presence of Anti-Ro/SSA is included in the model. We also categorized SS patients as positive or negative for the epigenetic IFN signature (see method) and observed that the association between HLA and SS is only seen in positive IFN signature SS patients (P < 8 × 10–04), and not present in negative IFN signature patients (P > 0.4).
In the absence of autoantibodies, we cannot observe the HLA genetic associations with SS, and all the epi- genetic signals associated with SS disappear, at least when analyzing single CpG-sites (Supplementary Table 3).
Altogether, our results suggest that there is a complex and a strong interaction between genetic variation in the HLA region, the presence of anti-Ro/SSA antibodies and the IFN-epigenetic signature observed in SS.
Differentially methylated regions associated with SS.
We sought to identify differentially methyl- ated regions (DMRs) associated with SS with the purpose of finding subtle, but consistent, methylation changes within a region that could not be detected when analyzing CpG sites by themselves. At FDR 5% threshold, we identified DMRs within 135 gene bodies, 335 promoters and 219 in CpG islands (CGI) (Supplementary Table 5).We found that many of the SS-associated DMPs (55.6%) were SS-associated DMRs, as for examples differentially methylated promoters for IFI44L, OAS2, RSAD2, BST2, PARP9-DTX3L, IFITM1, MX1, EPSTI1 or LY6E, and differentially methylated gene bodies of AGRN, IRF7, B2M, HERC5, ADAR and SP100, among others.
Importantly, we identified 442 novel differentially methylated genes exhibiting DMRs but for which we did not find DMPs. We could not perform a strict replication of these signatures because DNA methylation was measured in a different array (450 K) in the replication sample, and this implies having lower coverage in the pre-defined regions analyzed. However, we found out that up to 45% novel DMRs, lying within 199 genes, showed robust signals in the independent sample (P < 0.05) (Supplementary Table 5). Among the novel genes impli- cated in SS we found new interferon-regulated genes, such as SAMHD1, ISG15 and XAF1; and other proteins related with the immune system such the Tumor Necrosis Factor, TNF, the TNF-receptor CD27, the chemokine receptor like protein 2, CCRL2, and the tyrosine kinase LCK. We also discovered a group of genes belonging to the HOX family, such as HOXB2, HOXD8, HOXA9, HOXA10 or HOXA4, that is implicated in transcrip- tional processes, as well as other transcription factors such CEBPD and GATA2. Interestingly, we discovered a large group of genes with differential methylated regions implicated in collagen metabolism such as COL11A2, COL18A1, COL27A1, COL13A1, COL23A1 and COL5A1 that were not previously identified. In addition, many DMRs, especially those that fell in CGI, were located within long non-coding RNAs (LncRNAs), as for example RP11-723C11.2, RP11-326C3.7, RP11-480D4.2 or RP11-89K21.1 (see Supplementary Table 5). We performed functional enrichment analyses for the set of genes showing lower DNA methylation in the SS group (64%) and separately those with increased DNA methylation (34%). On one hand, DMRs with negative signs showed an enrichment in well known pathways implicated in SS such as interferon and cytokine signaling (R-HSA-913531 and R-HSA-1280215, respectively, from Reactome database), as well as in NOD-like receptor signaling pathway (KEGG path:hsa04621), viral carcinogenesis (KEGG path:hsa05203), transcriptional misregulation in cancer (path:hsa05202), necroptosis (KEEF path:hsa04217). On the other hand, those genes showing DMRs with positive effects were found to be enriched in pathways such as Collagen biosynthesis and modifying enzymes (Reactome, R-HSA-1650814) and extracellular matrix organization (Reactome R-HSA-1474244) (Fig. 2, Supplementary Table 6), which represent novel molecular pathways implicated in SS, and might indicate that the hypermethyla- tion of these genes can be implicated in SS pathogenesis by down-regulating these molecules.
Differential expression around SS‑associated epigenetic signals.
In order to detect coordinated epigenetic and transcriptional changes associated with SS, we explored the possibility that the DNA methyla- tion observed at the majority of SS-associated DMRs correlates with the expression of genes in the proximity.We identified 422 differentially expressed genes (DEGs) associated with SS when comparing RNA-seq gene
expression data available for 174 SS patients and 135 healthy subjects in our discovery cohort (P < 1.6 × 10⁻⁶), the majority of them show increased expression in SS patients and were successfully replicated in our independent sample (85.5% and 88.2%, respectively) (Fig. 1b and Supplementary Table 7). IFI44L was observed as the most significant differentially expressed gene (Log2FC = 3.12; P = 7.6 × 10–55; FDR = 3.3 × 10–50). Not surprisingly, many overexpressed genes were related with the IFN signaling (65/422), such as EPSTI1, RSDA2, USP18 or CMPK2 (Table 2), but a large proportion of SS-DEGs belong to other functional categories, being enriched in pathways such as response to external biotic stimulus (GO:0043207), response to stress (GO:0006950), interspecies inter- action between organisms (GO:0044419), protein binding (GO:0005515), RNA binding (GO:0003723) or nega- tive regulation of biological processes (GO:0048519) (Supplementary Table 8).
Next, we investigated whether DNA methylation at DMRs and gene expression at DEGs are correlated and if this correlation is associated with SS status and could, therefore, represent coordinated effects on SS, by expression Figure 2. Effect of Autoantibody profile in SS-associated epigenetic signals. (a) Hierarchical clustering representation from SS patients and healthy individuals (in columns) accordingly to DNA methylation levels (in rows) at the top SS-associated CpG sites. Subjects are classified according to disease status (green) and the presence of Anti-Ro/SSA (purple) and Anti-La/SSB (light blue) autoantibodies. (b) Barplot representing the effect sizes obtained in different models where DNA methylation was contrasting between different SS patients (according to autoantibody profiles). Black bar is a model that contrasted SSA- SS patients with CTRLs. Grey bar is a model that included all SS patients and was adjusted by SSA. Green bar is a model that included all SS patients and was unadjusted by SSA. Yellow line is a model that compared SSA + SS patients and CTRL. Blue line is a model that contrasted SSA + patients with CTRLs adjusted by SSB. Red bar is a model that contrasted SSA + SSB + patients and CTRLs. (c) Boxplots representing DNA methylation differences across different groups in three selected genes. R software73 and Adobe Illustrator (https:// www. adobe. com/) was used to create figures.
Table 1. Genetic associations between HLA variation, presence of Anti-La/SSA autoantibodies and epigenetic IFN signature. β reflects the additive effect of allele dosage for different HLA alleles and P is the associated significance level. The association between HLA genetic variation, SS and SSA was determined by means of logistic regression adjusted by sex and age. The association between HLA genetic variation and epigIFN was determined by linear regression models adjusted by sex, age, cell proportions and batch effects. epigIFN refers to the epigenetic IFN signature. DNA methylation at IFI44L gene (cg13452062) was used as a proxy for epigIFN. Patients exhibiting DNAm > 0.8 were classified as negative epigIFN. Patients exhibiting DNAm < 0.8 were classified as positive epigIFN.
HLA Alleles
SS ~ HLA SSA ~ HLA epigIFN ~ HLA epigIFN ~ HLA + SSA SS ~ HLA (positive
epigIFN) SS ~ HLA (negative epigIFN)
beta.HLA P.HLA beta.HLA P.HLA beta.HLA P.HLA beta.HLA P.HLA beta.HLA P.HLA beta.HLA P.HLA DRB1_0301 1.14 2.07E-07 0.27 1.02 x 10–04 − 0.17 9.16 x 10–05 − 0.06 0.142 1.40 7.14 x 10–09 − 0.30 0.470 DQB1_0201 1.16 1.39E-07 0.29 2.03 x 10–05 − 0.18 6.55 x 10–05 − 0.05 0.210 1.44 2.58 x 10–09 − 0.29 0.493
quantitative trait methylation (eQTM) analyses. We observed a total of 48 eQTMs or genes showing a strong correlation between DNA methylation levels and gene expression (Pearson’s coefficient > 0.60, P < 1.6 × 10⁻³⁴) (Supplementary Table 9). Many of the SS-eQTMs fell within the promoters of the IFN-related genes, such as IFI44L (Fig. 1c), EPSTI1, MX1, DTX3L, PAPR9, LY6E, IFITM3, DDX60, RSAD2, PLSCR1 and ADAR. For all of them we observed that decreased DNA methylation strongly correlated with increased expression levels in SS patients, while no correlation was apparent in the healthy population. Interestingly, we observed strong coor- dinated effects at other non IFN-regulated genes implicated in the immune system such as CD3D, FGR, PILRA or NLRC4, and in genes with unrecognized function in SS, such as MDGA1, PM20D1 and SIRPB2 (Pearson’s coefficient > 0.80). Genes showing correlated patterns of DNA methylation and gene expression were enriched mainly in immune-related gene ontologies being the most significant, immune response (GO:0006955), defense response (GO:0006952), activation of the immune response (GO:0002253) and response to stress (GO:0006950) (Supplementary Table 10). Our results suggest that SS-associated changes in DNA methylation can impact the transcriptional landscape in SS patients, and this could ultimately lead to alteration in the cellular function and immune response.
Genetic drivers of SS‑associated differential methylation and expression.
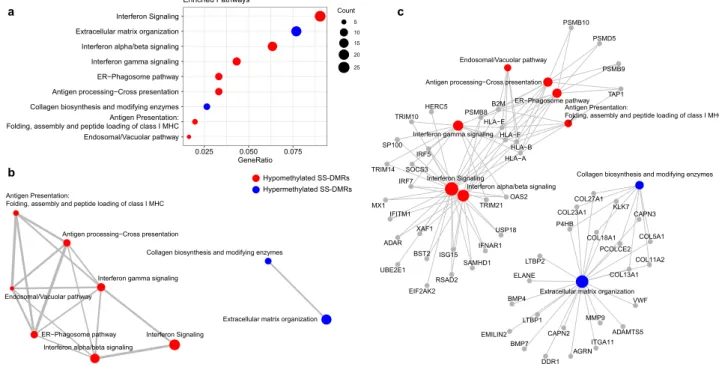
To obtain insights into the extent to which differential methylation and expression associated with SS is genetically controlled, we performed cis-meQTL and cis-eQTL analyses (see Methods). By means of linear regression models that adjust for disease conditions, we found evidence for genetic control in 52% of SS-associated DMPs and 39% of SS-asso- ciated DEGs (gene variants no farther than 1 Mb to CpG or to transcription start site—TSS). Specifically, at an FDR of 5% we found a total of 4,305 significant meQTLs that included 61 SS-DMPs and 3,508 single-nucleotide polymorphisms (SNPs). We were able to assess the replication of 1475 meQTLs that involved 31 CpGs included in the 450 K array and replicated results for 20 CpGs (64%) that were involved in 754 meQTLs (P < 0.05) (Sup- plementary Table 11). The most significant meQTLs regulate DNA methylation at the EPSTI1 gene, at an inter- genic region in chromosome 3 where CCR cluster is located, and at VRK2, ADAR, IRF7 and MX1 genes. On the other hand, we identified a total of 11,399 significant eQTLs, that included 172 SS-DEGs and 10,620 SNPs, from which we could replicate 6414 eQTLs (56%) at a significance threshold of P < 0.05 and with consistent direction of effect, implicating 81 genes (Supplementary Table 12). Genetic variants located close to the TSS of GBP3 show the strongest association with GBP3 gene expression, followed by cis-genetic variation regulating gene expres- sion of C3AR1 or MASTL, ETV7 and IFITM3.Figure 3. Functional Enrichment Results for differentially methylated regions based in Reactome database. (a) Dotplot representing Reactome functional pathways that are enriched in differentially methylated regions. Only significant pathways (adjusted P < 0.05) that are represented by more than 5 genes are illustrated. (b) Enrichment map that organizes significant enriched terms into a network with edges connecting overlapping gene sets.
(c) Genes that are involved in significant terms are connected by linkages. Pathways in red are enriched in hypomethylated genes while pathways in blue are enriched in hypermethylated genes. Dot size represents number of genes with DMRs per pathways. R software73 and Adobe Illustrator (https:// www. adobe. com/) was used to create figures.
Intermediary role of DNA methylation and gene expression in genetic risk of SS.
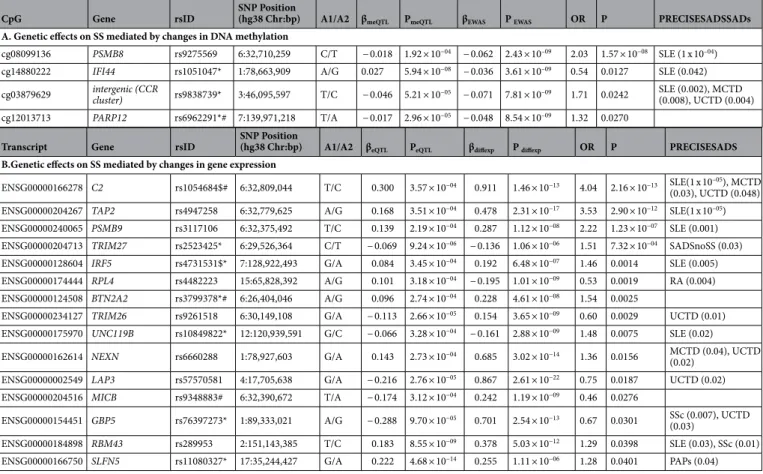
Then, we investigated the possibility that changes in DNA methylation and gene expression mediate genetic risk in SS, as it has been shown to occur for other autoimmune diseases13,33. For that, we interrogated whether SNPs involved in meQTLs and eQTLs could be linked to the disease and showed allele frequency differences in a set of 391 SS patients and 549 healthy controls in a direction that is consistent with a mediation role of DNA methylation or gene expression (Supplementary Tables 13, 14, Methods). At a Bonferroni-corrected significance of P < 0.0008, we detected risk variants in the HLA region of chromosome 6 that regulate DNA methylation at gene PSMB8 (Table 3). In this case, the minor T-allele of SNP rs7769693, at the HLA-DRB9 pseudogene, is associated with increased SS risk and with decreased methylation levels, suggesting that the variant might exert its risk by hypo- methylating the PSMB8 gene. Regarding eQTL results, at a Bonferroni-corrected significant level of P < 0.0002 we detected genetic variants associated with gene expression and SS at three differentially expressed genes C2, TAP2 and PSMB9 (Table 2).Table 2. Genetic association of SS-meQTLs and SS-eQTLs with SS and other related SADs mediated by DNA methylation or gene expression changes. Alleles represent major allele first, and then the minor allele, which is the allele tested in each analysis. β meQTL represents the DNA methylation change with the increased in dosage of the minor allele. P meQTL corresponds to the P value from the linear regression model that regresses out the number of minor alleles for a given SNP to DNA methylation levels adjusting by age, sex, batch effects, estimated cell proportions, disease status and first genetic component. βEWAS represents the DNA methylation difference between SS and healthy controls from the epigenome-wide association study together obtained by linear regression model in which DNA methylation levels are regressed out by SS status and adjusted by age, sex, batch effects and estimated cell proportions. OR represents the Odd Ratio obtained from genetic association testing based on logistic regression modeling which the SS statuts is regressed out by number of minor alleles for a given SNP adjusted by age, sex, batch effects, estimated cell proportions and first genetic component and its corresponding. P represents the P-value obtained in the genetic associations. SAD (OR, P) represents the odd ratio and P value obtained in genetic testing for other diseases. RA = Rheumatoid Arthritis, SLE = Systemic Lupus Erythemathosus, UCTD = Undifferentiated Connective Tissue Disease, SSc = Systemic Scleroderma, PAPs = Primary anti-phospholipid syndrome. SADSnoSS = All SADs patients excluding SS.
Genomic positions are based on the hg19 human reference sequence build (GRCh37). * eQTL reported in GTEx project (https:// www. gtexp ortal. org/ home/), in the case of eQTL the same SNP-gene is reported. # SNP associated with related disease phenotype in GWAS catalog (https:// www. ebi. ac. uk/ gwas/) or Open Target Genetics Portal (https:// genet ics. opent argets. org/).
CpG Gene rsID SNP Position
(hg38 Chr:bp) A1/A2 βmeQTL PmeQTL βEWAS P EWAS OR P PRECISESADSSADs A. Genetic effects on SS mediated by changes in DNA methylation
cg08099136 PSMB8 rs9275569 6:32,710,259 C/T − 0.018 1.92 × 10−04 − 0.062 2.43 × 10–09 2.03 1.57 × 10−08 SLE (1 x 10–04) cg14880222 IFI44 rs1051047* 1:78,663,909 A/G 0.027 5.94 × 10−08 − 0.036 3.61 × 10–09 0.54 0.0127 SLE (0.042) cg03879629 intergenic (CCR
cluster) rs9838739* 3:46,095,597 T/C − 0.046 5.21 × 10−05 − 0.071 7.81 × 10–09 1.71 0.0242 SLE (0.002), MCTD (0.008), UCTD (0.004) cg12013713 PARP12 rs6962291*# 7:139,971,218 T/A − 0.017 2.96 × 10−05 − 0.048 8.54 × 10–09 1.32 0.0270
Transcript Gene rsID SNP Position
(hg38 Chr:bp) A1/A2 βeQTL PeQTL βdiffexp P diffexp OR P PRECISESADS B.Genetic effects on SS mediated by changes in gene expression
ENSG00000166278 C2 rs1054684$# 6:32,809,044 T/C 0.300 3.57 × 10−04 0.911 1.46 × 10⁻¹³ 4.04 2.16 × 10⁻¹³ SLE(1 x 10–05), MCTD (0.03), UCTD (0.048) ENSG00000204267 TAP2 rs4947258 6:32,779,625 A/G 0.168 3.51 × 10−04 0.478 2.31 × 10⁻¹⁷ 3.53 2.90 × 10⁻¹² SLE(1 x 10–05) ENSG00000240065 PSMB9 rs3117106 6:32,375,492 T/C 0.139 2.19 × 10−04 0.287 1.12 × 10−08 2.22 1.23 × 10−07 SLE (0.001) ENSG00000204713 TRIM27 rs2523425* 6:29,526,364 C/T − 0.069 9.24 × 10−06 − 0.136 1.06 × 10−06 1.51 7.32 × 10−04 SADSnoSS (0.03) ENSG00000128604 IRF5 rs4731531$* 7:128,922,493 G/A 0.084 3.45 × 10−04 0.192 6.48 × 10−07 1.46 0.0014 SLE (0.005) ENSG00000174444 RPL4 rs4482223 15:65,828,392 A/G 0.101 3.18 × 10−04 − 0.195 1.01 × 10−09 0.53 0.0019 RA (0.004) ENSG00000124508 BTN2A2 rs3799378*# 6:26,404,046 A/G 0.096 2.74 × 10−04 0.228 4.61 × 10−08 1.54 0.0025
ENSG00000234127 TRIM26 rs9261518 6:30,149,108 G/A − 0.113 2.66 × 10−05 0.154 3.65 × 10−09 0.60 0.0029 UCTD (0.01) ENSG00000175970 UNC119B rs10849822* 12:120,939,591 G/C − 0.066 3.28 × 10−04 − 0.161 2.88 × 10−09 1.48 0.0075 SLE (0.02) ENSG00000162614 NEXN rs6660288 1:78,927,603 G/A 0.143 2.73 × 10−04 0.685 3.02 × 10⁻¹⁴ 1.36 0.0156 MCTD (0.04), UCTD
(0.02) ENSG00000002549 LAP3 rs57570581 4:17,705,638 G/A − 0.216 2.76 × 10−05 0.867 2.61 × 10⁻²² 0.75 0.0187 UCTD (0.02) ENSG00000204516 MICB rs9348883# 6:32,390,672 T/A − 0.174 3.12 × 10−04 0.242 1.19 × 10−09 0.46 0.0276
ENSG00000154451 GBP5 rs76397273* 1:89,333,021 A/G − 0.288 9.70 × 10−05 0.701 2.54 × 10⁻¹³ 0.67 0.0301 SSc (0.007), UCTD (0.03)
ENSG00000184898 RBM43 rs289953 2:151,143,385 T/C 0.183 8.55 × 10−09 0.378 5.03 × 10⁻¹² 1.29 0.0398 SLE (0.03), SSc (0.01) ENSG00000166750 SLFN5 rs11080327* 17:35,244,427 G/A 0.222 4.68 × 10⁻¹⁴ 0.255 1.11 × 10−06 1.28 0.0401 PAPs (0.04)
To give statistical robustness and further support to the functional and genetic link between meQTL and eQTLs with SS and with autoimmune processes, we first interrogated whether or not the novel identified SS-risk variants that reached a suggestive significance level of P < 0.05, show evidence of association with other SADs for which we had access to genotypic data: systemic lupus erythematosus (SLE), rheumatoid arthritis (RA), systemic sclerosis (SSc), mixed connective tissue disease (MCTD), undifferentiated connective tissue disease (UCTD) and primary antiphospholipid syndrome (PAPs) (Table 2, Supplementary Table 15). Moreover, we searched for additional evidence of their functional role in public databases of eQTL and GWAS studies. Importantly, genetic variants regulating DNA methylation at the intergenic region of the CCR cluster in chr3 (Fig. 4a) and DNA methylation at the downstream region of IFI44 gene (Fig. 4b) show convincing evidence of their link with other SADS and have been described as eQTL for the same genes (Supplementary Table 16). Likewise, genetic vari- ants regulating gene expression of the genes TRIM27 (Fig. 4c), BTN2A2, UNC119B, GBP5 (Fig. 4d) and SLFN5 show significant associations with other SADS and a link with gene expression has been previously observed in eQTL studies for these genes (Supplementary Table 16). Altogether, these results support the scenario in which differences in DNA methylation and gene expression are intermediates of genetic risk for SS. This study provides a framework for the discovery of new risk loci associated with SS via alteration of regulatory landscapes.
Disease‑dependent genetic effects on SS‑associated differential methylation and gene expression.
Finally, we hypothesized that there might exist genetic variants whose effect on molecular phenotypes depends on the specific environment of altered immune activation originated during the disease process. In order to identify such disease-dependent genetic effects or disease-interacting QTLs, we performed a gene-by-environment interaction meQTLs and eQTLs analyses in which we looked for gene variants that Table 3. Most significant meQTLs and eQTLs exhibiting disease-dependent genetic effects. β INT represents the interaction effect between a given SNP and SS status in DNA methylation level. P INT represents the P-value obtained for the β INT in a linear regression model that adjusts for SNP, SS status, age, sex, batch effects, estimated cell proportions and the first principal genetic component. β SS.meQTL represents the DNA methylation change with the increased in dosage of the minor allele in SS population for a given SNP. P SS.meQTLcorresponds to the P value from the linear regression model that regresses out the number of minor alleles for a given SNP to DNA methylation levels adjusting by age, sex, batch effects, estimated cell proportions, disease status and first genetic component in SS population. β CTRL.meQTL represents the DNA methylation change with the increased in dosage of the minor allele in the healthy control population for a given SNP. P CTRL.meQTL
corresponds to the P value from the linear regression model that regresses out the number of minor alleles for a given SNP to DNA methylation levels adjusting by age, sex, batch effects, estimated cell proportions, disease status and first genetic component in the healthy control population. NA represents effects that are non significant (P > 0.05).
CpG Gene SNP SNP Position (hg38
Chr:bp)
Discovery cohort Replication
cohort βINT PINT βSS.meQTL PSS.meQTL βCTRL.meQTL PCTRL.meQTL βINT PINT
A. SS-dependent meQTLs
cg08818207 TAP1 rs113547322 6:32,238,742 0.058 1.5 × 10−05 0.048 0.0004 NA > 0.05 0.059 0.0091
cg14392283 LY6E rs13273708 8:143,002,764 − 0.018 1.6 × 10−04 − 0.016 0.0006 NA > 0.05 − 0.020 0.0061 cg01309328 PSMB8 rs3134951 6:32,147,308 − 0.040 4.0 × 10−04 − 0.024 0.0124 NA > 0.05 − 0.040 0.0023 cg14951497 STAT1 rs4853645 2:191,839,218 − 0.029 5.5 × 10−04 − 0.024 0.0012 NA > 0.05 − 0.038 0.0418 cg12906975 Intergenic (LY6E) rs55937049 8:143,033,566 − 0.013 0.0018 − 0.011 0.0087 NA > 0.05 − 0.017 0.0410
cg23387863 SGK269 rs1079396 15:78,137,720 − 0.024 0.0022 − 0.017 0.0119 NA > 0.05 − 0.028 0.0141
cg10734665 ATP10A rs7169481 15:25,712,123 − 0.022 0.0031 0.018 0.0047 NA > 0.05 0.030 0.0138
cg08099136 PSMB8 rs3129943 6:32,370,868 − 0.030 0.0038 − 0.027 0.0050 NA > 0.05 − 0.035 0.0108
Gene ID Gene SNP SNP Position (hg38
Chr:bp)
Discovery cohort Replication
cohort βINT PINT βSS.eQTL PSS.eQTL βCTRL.eQTL PCTRL.eQTL βINT PINT
B.SS-dependent eQTLs
ENSG00000183486 MX2 rs9305702 21:40,755,922 − 0.300 1.8 × 10−04 − 0.302 1.8 × 10−04 NA > 0.05 − 0.315 0.0172 ENSG00000198785 GRIN3A rs2417310 9:101,964,703 0.251 4.5 × 10−04 0.235 7.0 × 10−04 NA > 0.05 0.262 0.0092
ENSG00000185885 IFITM1 rs12364973 11:1,116,140 0.386 6.9 × 10−04 0.280 0.0130 NA > 0.05 0.430 0.0476
ENSG00000013374 NUB1 rs77466830 7:151,831,985 − 0.143 7.7 × 10−04 − 0.151 3.5 × 10−04 NA > 0.05 − 0.158 0.0345 ENSG00000133106 EPSTI1 rs9525846 13:43,816,621 − 0.607 8.8 × 10−04 − 0.577 2.4 × 10−03 NA > 0.05 − 0.651 0.0199
ENSG00000188313 PLSCR1 rs56077428 3:146,981,084 0.471 0.0010 0.357 0.0208 NA > 0.05 0.600 0.0185
ENSG00000157601 MX1 rs9305702 21:40,755,922 − 0.602 0.0012 − 0.496 0.0083 NA > 0.05 − 0.779 0.0085
ENSG00000247317 LY6E − DT rs902834 8:142,111,410 0.167 0.0038 0.129 0.0149 NA > 0.05 0.149 0.0469
ENSG00000108691 CCL2 rs1490922 17:33,725,536 0.351 0.0044 0.307 0.0159 NA > 0.05 0.367 0.0252
ENSG00000187210 GCNT1 rs2377425 9:75,947,610 0.132 0.0047 0.083 0.0452 NA > 0.05 0.210 0.0068
interact with disease status on shaping DNA methylation and gene expression levels at SS-associated DMPs and DEGs. We considered relevant and robust disease interacting QTLs those that accomplish the following strict conditions: i) an interaction effect that passes a significance threshold of PINTER < 0.005 in the discovery cohort and a significance threshold of PINTER < 0.05 in the replication cohort, with consistent direction of the effect, ii) genetic variant associated with DNA methylation or gene expression only in the SS group (PSS.QTL < 0.05) and without evidence of genetic associations in the healthy population (PCTRL.QTL > 0.05), iii) genetic variants that show a minor allele frequency higher than 0.10 in the SS group.
For DNA methylation, we observed convincing evidence for disease-interacting meQTLs at 8 SS-associated DMPs within genes TAP1, LY6E, PSMB8, STAT1, SGK269 and ATP10A (Table 3 and Supplementary Table 17).
The most significant gene-environment interaction (ßINTER = -0.018, PINTER = 2.0 × 10–04) that fell outside the HLA region involved the genetic variant rs13273708 at chromosome 8 and DNA methylation at LY6E (cg14392283) (Fig. 4a, Table 3). For this variant, the minor C-allele is associated with a decrease in LY6E-DNA methylation only in SS patients, but this association is not observed in the healthy population (Table 4). A similar scenario is observed for the STAT1 gene for which we found the second most significant disease-dependent meQTLs effect (ßINTER = −0.029, PINTER = 5.47 × 10–04) outside the HLA region (Fig. 5b). Another convincing example implicates the interaction between SS status and rs1079396 in shaping DNA methylation levels at SGK269 gene (ßINTER = −0.024, PINTER = 0.003, Fig. 5c), and the interaction with rs7169481 in shaping DNA methylation at ATP10A (cg10734665 , ßINTER = 0.022, PINTER = 0.003, Fig. 5d). For gene expression, some IFN-inducible genes such as MX2, IFITM1, EPST1, MX1 and LY6E-DT show convincing evidence that their expression is genetically regulated in a disease-specific manner (Table 3 and Supplementary Table 18). The most significant disease- dependent effect was observed for MX1 gene expression (ßINTER = −0.300, PINTER = 1.8 × 10–0, Fig. 5e), which is overexpressed in SS patients, and only genetically regulated within the disease population. In this case, the minor T-allele of rs9305702 is associated with decreased MX1 gene expression in SS patients, without evidence of association in the healthy population (Fig. 5e). Other genes such as IFITM1 (Fig. 5f), CCL2 (Fig. 4g), NUB1 (Fig. 5h), PLSCR1, GRIN3A and GCNT1 also show disease-specific eQTLs that regulate their SS-associated dif- ferential expression (Table 3).
For all those disease-interacting meQTLs and eQTLs, the same trend is observed in the replication sample (Supplementary Table 17 and 18) and we found no evidence for them to be genetic regulators of DNA meth- ylation and/or gene expression in a model that corrects for disease status and includes the whole population (Supplementary Table 17 and 18), or in other studies that have interrogated healthy populations (Supplementary Table 19)8,10,37. Our findings reveal a differential genetic architecture of gene regulation between SS patients and the healthy population, and suggest that the specific immunological and pathological conditions in autoimmunity Figure 4. Intermediary role of DNA methylation and gene expression in SS genetic risk. (a) The minor G-allele of SNP rs1051047 exerts a protective role on SS susceptibility by increasing DNA methylation levels at the upstream region of gene IFI44 (cg1488022). (b) The minor C-allele of SNP rs9838739 exerts risk on SS susceptibility by decreasing DNA methylation levels at the intergenic region within the CCR cluster in chromosome 3 (cg03879629). (c) The minor T-allele of SNP rs2523425 exerts risk on SS by decreasing TRIM27 gene expression. (d) The minor G-allele of SNP rs76397273 exerts a protective effect on SS by decreasing GBP5 gene expression. Green boxplots and barplots represent SS population, while grey plots represent the healthy control population. DNA methylation is quantified with β-values, gene expression is at the logarithmic scale. R software73 and Adobe Illustrator (https:// www. adobe. com/) was used to create figures.
modify how genes regulate the transcriptional landscapes of immune cells, which likely has an impact in the function and fate of cells.
Discussion
Here, we present a comprehensive integrative large-scale analysis that serves to discovery new loci and pathways involved in SS, to recognize the importance of hypermethylation events in SS pathogenesis, and to unravel the genetic architecture of blood gene regulation in a systemic autoimmune disease.
We could confirm the activation of the IFN system in SS38 by recognizing blood hypomethylation and over- expression of a large number of genes involved in IFN signaling or specially of type I IFN-inducible genes. Type I IFNs are key immune mediators involve in viral response and in activation of immune responses39. Previous large-scale studies have extensively characterized the interferon signature in SS with large scale gene expression data and recently, with DNA methylation as well, in different tissues and cell types19,20,22,23,40–43. Our stratified analyses reveal that the IFN epigenetic signature is restricted to only those SS patients that exhibit Anti-Ro/SSA autoantibodies positivity and enhanced in those that also exhibit Anti-La/SSB. It has been reported that patients positive for these autoantibodies44 and that exhibit the IFN signature45 are at higher risk for worse diagnosis some disease manifestations such as hypergammaglobulinemia and ongoing lymphomas. Several authors have recognized the important contribution to clinical management that stratifying patients based on gene expression based biomarkers of IFN signature38. Recently, a study has shown than an epigenetic-based IFN signature could be even a more suitable biomarker for patient classification45.
The tight relationship between autoantibodies and IFN signaling has been reported by multiple population- based studies and experimental works in in blood, salivary glands and other target cells22,36,40. However, the mechanisms behind this close relationship are still unclear. Whether the IFN signaling have an effect on autoan- tibodies production or vice versa, is unresolved. On one hand, IFN signaling stimulated upon viral infection Figure 5. Disease interacting QTLs (a) The minor C-allele of SNP rs13273708 is associated with a decrease in DNA methylation levels at LY6E gene only in SS patients (ßSS.meQTL = − 0.018, PSS.meQTL = 6 × 10–04), but not in the healthy population (PSS.meQTL > 0.05). (b) The minor A-allele of SNP rs902834 decreases the DNA methylation level at STAT1 only in SS patients (ßSS.meQTL = − 0.024, PSS.meQTL = 0.0012), and not the healthy population (PCTRL.meQTL > 0.05). (c) The minor T-allele of rs1079396 is associated with SGK269-methylation in SS patients (ßSS.meQTL = -0.017, PSS.meQTL = 0.0119), but not in the healthy population (PCTRL.meQTL > 0.05). (d) The minor G-allele of rs7169481 in ATP10A is associated with increased DNA methylation at ATP10A in SS patients (ßSS.meQTL = 0.018, PSS.meQTL = 0.0047). However, in the healthy population this allele has no significant effect (PCTRL.meQTL > 0.05). (e) The minor T-allele of the rs9305702 genetic variant is associated with a decreased MX2 gene expression in SS patients (ßSS.eQTL = − 0.302, PSS.eQTL = 1.8 × 10–04), and shows no evidence of association in the healthy population (PCTRL.eQTL > 0.05). (f) The minor C-allele of rs12364973 is associated with an increased IFITM1 gene expression in SS patients (ßSS.eQTL = 0.28, PSS.eQTL = 0.012) and shows no evidence of association in the healthy population (PCTRL.eQTL > 0.05). (g) In SS patients, NUBI expression decreases with the dose of the minor A-allele of rs77466830 (ßSS.eQTL = − 0.15, PSS.eQTL = 3.5 × 10–04); however, in the healthy population it remains stable (PCTRL.eQTL > 0.05). (h) In SS patients, PLSCR1 expression increased with the dose of the minor A-allele of rs56077428 (ßSS.eQTL = 0.357, PSS.eQTL = 0.0208); however, in the healthy population it remains stable (PCTRL.eQTL > 0.05). Green boxplots represent SS population, while grey boxplots represent the healthy control population. DNA methylation is quantified with β-values, gene expression is at the logarithmic scale. R software73 and Adobe Illustrator (https:// www. adobe. com/) was used to create figures.
could generate antibodies that cross-react with autoantigens, such as Anti-Ro/SSA and Anti-La/SSB, by molecular mimicry46. On the other hand, it is known that the deposition of immuno-complexes formed by autoanti- bodies, RNA-binding proteins and material releases from apoptotic cells stimulate type I IFN production and subsequently activate IFN-regulated genes47. Nevertheless, autoantibodies production seems not to be enough to trigger dysregulating IFN-signaling as this is not observed in healthy subjects that exhibit autoantibodies48. In our study we could investigate further the genetic drivers of this strong relationship. Genetics studies have revealed that in SS there is a strong relationship between autoantibody production and class II HLA variation.
Indeed, some studies have clearly show that class II HLA is only a risk factor for patients that are positive for Anti-La and/or Anti-Ro49,50.In a recent SADs molecular stratification51, we recognized a strong relationship between class II HLA variation and a molecular cluster characterized by the IFN signature enriched in Anti-La and Anti-Ro positive patients. Beyond this previously gathered knowledge, here we have discovered that, specifi- cally, the SS-associated class II HLA-DRB1-0301 and HLA-DQB1-0201 alleles are strongly associated with the IFN signature and with Anti-Ro/SSA and Anti-La/SSB production. Indeed, our stratified analyses revealed that class II HLA is only associated with SS and with autoantibody production in those patients exhibiting the IFN signature. Our findings point towards a complex interaction between class II HLA variation, IFN signaling and autoantibody production Other autoimmune diseases share a common IFN signature with SjS and common HLA risk variants, such as SLE and MCTD. Whether the same HLA alleles and autoantibodies are important for the IFN signature observed in other related autoimmune diseases remains to be explored. More studies that couple observational records with experimental data are needed to disentangle mechanistic routes behind these relationships and recognize potential new drug targets.
Importantly, we also identified a high number of novel hypermethylation events in genes not related to the IFN pathways when applying a statistical method based on gene set enrichments52, a trend that was not observed when analyzing individual CpG sites. This method permits to detect associations of smaller magnitude but with consistent epigenetic patterns along pre-defined regions. Functional analyses in the group of genes exhibiting increased methylation in SS patients revealed enrichment in important pathways such as those related to the metabolism of collagen and/or implicated in extracellular matrix organization that have not been previously detected, but could explain the increased degradation of extracellular matrix structures and the significant loss of collagen observed in the lacrimal gland and other tissues in SS, and, therefore, have a key role in its pathogenesis53. We anticipate that future efforts in biomarker discovery will successfully recognize that these hypermethylated signals can also be of good utility for SS stratification. .
In this study, we discovered new loci associated with SS whose functional mechanisms could be the altera- tion of epigenetic states or gene expression profiles. The association that we have found between genetics, DNA methylation and SS in the CCR gene cluster in chromosome 3 is very interesting and represents a novel genetic risk variant. Our study shows that the minor C-allele of rs9838739, located in an active regulatory region over- lapping many transcription factor binding sites and upstream the CCR gene cluster, increases risk for SS and several related systemic autoimmune diseases (SLE, MTD and UCTD) and decreases DNA methylation levels at this dense regulatory region. Previous eQTL studies from GTEx project identified that C-allele is associated with lower CCR5 expression in whole blood37. Interestingly, the lack of CCR5 on dendritic cells of a NOD mouse, an experimental model for SS disease and diabetes, promotes a proinflammatory environment in submandibular glands, a target and affected tissue in SS patients54. Furthermore, CCR5 expression is decreased on circulating monocytes from SS patients and is correlated with increased levels of inflammatory chemokines55 . Our results, together with previous findings, suggest that genetically determined reduced methylation at CCR cluster-methyla- tion, could contribute to SS presumably via enhanced gene expression of inflammatory chemokines. Interestingly, the same region has been strongly associated with COVID19 susceptibility and severity in several international efforts56,57 indicating that common molecular players may be involved in COVID19 and autoimmunity suscepti- bility. Other than the well described regulatory role of IRF5 risk variants58, we also identified that genetic variants at TRIM27, TRIM26, RLP4, NEXN, LAP3, GBP5, RBM43 and SLNF5 genes could be implicated in SS through changes in gene expression. For example, we identified a novel risk variant that we are others have demonstrated that downregulates TRIM2737,59. TRIM27 is a molecule that inhibits the innate immune response and has been recently shown to negatively regulate NOD2 mediated signaling by physical interaction and degradation60. These data suggest that genetically determined reduced TRIM27 expression in SS patients can lead to enhanced innate responses via abnormally enhanced NOD2 activity.
Importantly, the findings of this work corroborate our hypothesis that genetic variants may only manifest genetic regulatory effects in the specific context of altered immune activity exhibited in SS patients. We identi- fied strong meQTL effects only among SS patients and that we did not observed and have not been previously described in the general population for STAT1, LY6E and ATP10A genes11. STAT1 is a signal transducer and transcriptional activator that is activated in response to several cytokines as IFN-alpha, IFN-gamma or IL-6.
Stimulation of monocytes and B-cells in SS patients leads to increased sensitivity of immune cells from SS patients to STAT1-activating signals that might partly explain the IFN signature observed in SS61 In line with these results, our transcriptional data shows overexpression of STAT1 in SS patients. On the other hand, LY6E, an IFN-regulated gene that encodes for the Lymphocyte Antigen 6E, is hypomethylated and overexpressed in SS patients. Interestingly, a previous study discovered trans-eQTL effects on LY6E gene expression that is dependent on immune activation62, supporting that its genetic regulation is context-specific. An earlier GWAS study on cytokine responses found that genetic variants at ATP10A are associated with IFN-gamma production in response to vaccinia virus in subjects who had received the smallpox vaccine63. These findings, and our results, support a scenario in which inter-individual genetic variation at this gene impacts IFN-regulated gene expression only upon immune activation and via alteration of epigenetic states.
Likewise, we also identified a group of IFN-related genes which expression is genetically regulated in a disease-specific manner, such as MX1, MX2, EPST1 and IFITM1. We also discovered context-specific eQTLS