Wetting and evaporation on a carbon cloth type gas diffusion layer for passive direct alcohol fuel cells
Krisztina Anita Nagy
a, Ildikó Y. Tóth
a,⁎ , Gerg ő Ballai
a, Ágnes Timea Varga
a, Imre Szenti
a, Dániel Seb ő k
a, Judit Kopniczky
b, Béla Hopp
b, Ákos Kukovecz
aaUniversity of Szeged, Interdisciplinary Excellence Centre, Department of Applied and Environmental Chemistry, Rerrich Béla tér 1, H-6720 Szeged, Hungary
bUniversity of Szeged, Department of Optics and Quantum Electronics, H-6720, Dóm tér 9, Szeged, Hungary
a b s t r a c t a r t i c l e i n f o
Article history:
Received 29 November 2019
Received in revised form 10 February 2020 Accepted 11 February 2020
Available online 20 February 2020
Keywords:
Wetting Evaporation
Carbon cloth type gas diffusion layer Fuel cells
Gas diffusion layers (GDL) have a crucial importance in passive air breathing direct alcohol fuel cells as they play a pivotal role in governing fuel distribution on the anode side and in preventing waterflooding on the cathode side.
We report here a rapid, cost-effective, ex-situ method to study the wettability of GDLs by processfluids. A com- mercial Teflon® treated carbon cloth featuring a single microporous layer was used, because carbon cloths are anticipated to outperform carbon paper type GDLs at high humidity and high current density. The GDL structure was characterized by SEM, 3D microCT reconstruction, and surface profilometry. Wettability by aqueous alcohol mixtures was investigated by contact angle measurement and infrared thermography. Ethanol containing fuel of- fered better spreading characteristics than methanol, especially on the microporous side of the GDL. The surface behaviour of water was studied by recording the evaporation profile of a sessile water droplet using time depen- dent contact angle measurement and simultaneous weight loss measurement and thermography. The applicabil- ity of the Teflon-containing carbon cloth as a GDL was verified by its hydrophobic behaviour and its ability to reject water. We found evidence that thefirst stage of water evaporation occurs in constant contact angle mode, then a wetting mode transition takes place at approx. 0.65 relative evaporation time and the evaporation proceeds in constant contact radius mode.
© 2020 The Authors. Published by Elsevier B.V. This is an open access article under the CC By license (http://creativecommons.org/licenses/by/4.0/).
1. Introduction
According to the International Energy Agency's World Energy Out- look in 2014 the primary energy demand of the world will be 37%
higher in 2040 [1]. Fuel cells (FCs) represent an efficient alternative to fast-depleting fossil fuels. A fuel cell is an electrochemical cell for transforming chemical energy directly into electrical energy [2,3]. Out of the many types of FCs, liquid-feed, passive, air-breathing direct alco- hol fuel cells (PAB-DAFC) are particularly promising because they can be utilized in small, portable devices [4–7]. Passive mode means that re- actant feed and product removal occur through diffusion, natural con- vection, gravitation and capillary forces, i.e. without extra balance-of- plant devices. CO2, H+and e−appear upon the alcohol oxidation reac- tion in the anode side and water is generated in the oxygen reduction reaction in the cathode side of the cell [8]. The air-breathing system has an open cathode connected to ambient air and the resulting water is eliminating through evaporation [9,10]. The optimum alcohol concen- tration in liquid-feed fuel cells is between 2 and 4 M [11–13]. One of the most often studied alcohols in fuel cells is methanol. The effect of
methanol concentration was studied by many, and 3 M methanol pro- vided the best overall cell performance [14,15] although certain cell types can use higher methanol concentration (N4 M) as well [13]. The problem is that methanol crossover (MCO) occurs from the anode to the cathode side, which reduces the performance of the FC [16]. Ethanol is also a good fuel choice because of its lower toxicity and higher energy density than methanol [17]. The operating temperature is a further ad- vantage of such FCs since they can work at as low temperatures as 50–60 °C [3,18].
Fuel cells have a sandwich structure in which the Gas Diffusion Layer (GDL) is located on both sides of the membrane. The catalyst layer is de- posited between the GDL and the membrane. One of the main tasks of the GDL is that it needs to allow theflow of reactant gases or solvents and it has a major role in the water management of the cell [19]. Fur- thermore, GDLs have a role in good reactant distribution in the anode side which has an effect of the cell performance [8,15,20,21]. GDLs usu- ally consist of a carbonfibre substrate (backing layer) and on that there is a microporous layer (MPL) [5]. The orientation of thefibres in the car- bonfibre substrate can be random like in case of non-woven carbon felt, quasi-randomly like in case of carbon paper or aligned like in case of woven materials (carbon cloths) [22–24]. The properties of the micro- porous layer (e.g. thickness [25], PTFE content [26], the carbon types
⁎ Corresponding author at: Rerrich Béla tér 1, H-6720 Szeged, Hungary.
E-mail address:ildiko.toth@chem.u-szeged.hu(I.Y. Tóth).
https://doi.org/10.1016/j.molliq.2020.112698
0167-7322/© 2020 The Authors. Published by Elsevier B.V. This is an open access article under the CC By license (http://creativecommons.org/licenses/by/4.0/).
Contents lists available atScienceDirect
Journal of Molecular Liquids
j o u r n a l h o m e p a g e :w w w . e l s e v i e r . c o m / l o c a t e / m o l l i q
[27]) and the substrate features (like thickness, PTFE content and poros- ity) all have an effect on fuel cell performance [28]. Porosity is a key pa- rameter, which affects both gas and liquid transport. The average porosity of the GDLs varies between ~50–90% [29–36]. The structure of the GDL is also a key factor to the FC performance since carbon papers and carbon cloths possess very different structure. According to Omrani's review, carbon cloth is more suitable than carbon paper at high current density and/or high humidity conditions [20]. Further- more, the microporous layer further increases the efficiency of water re- moval [37]. Due to the good reactant distribution on anode GDL and water removal from cathode side of the cell, the GDLs have to exhibit appropriate hydrophobic-hydrophilic behaviour. They need to have some kind of hydrophobic agent to help in water management and to avoidflooding [22,31], which decreases the efficiency of fuel cell, espe- cially when it operates at high current densities [11,14]. Therefore, the wettability of GDLs is a critical parameter. Water saturation in GDL pores was characterized by in-situ and in operando techniques [25,38–40]. Even though these methods can provide a detailed picture of water distribution inside GDLs, they are unfortunately costly and time-consuming. Thus, it is necessary to explore alternative ways to study GDL wettability, droplet pinning, detaching and evaporation.
Contact angle measurement is a widespread method to determine wetting properties. The importance of knowing the contact angle on the GDL was proven by Mahnama et al. who established that the cell performance was improved by higher contact angle values because of faster water removal [41]. The scale of the roughness is an important feature at a hydrophobic surface. McHale et al. have observed that the surface roughness could have an effect on contact angle but this was not discussed in full detail [42]. Gauthier et al. studied the wettability of two different types of GDLs (carbon cloth vs. carbon paper) and they observed that two-scale texturing in carbon cloth helps the drop detach easily, therefore, the texture of the GDLs is a critical parameter [43]. Hao et al. described hydrophobic materials with different scales of micropillars besides unchanged area fractions. They investigated water droplet evaporation and they reported that the contact angle values are higher with reducing the roughness scale [44].
Infrared (IR) thermography is a feasible alternative to study the wet- tability of porous materials [45]. It can provide information not only about the size of the droplet area or the spreading on/in the surface, but also about the temperature distribution in the droplet/wetted area. A few works have studied droplet pinning and spreading in case of carbonfibre materials using IR thermal imaging [46,47]. Zhang et al.
proposed a method to study the spreading area of a colourless droplet on different porous carbonfibre materials by IR thermal imaging. They could detect the spreading rim with the help of the droplet's tempera- ture gradient curve accurately [46]. Obeisun et al. investigated water droplet evaporation from a carbonfibre paper type GDL. They observed that the contact angle did not depend on the temperature of the GDL in the studied range (30–60 °C). They used IR imaging to describe the ther- mal effect of the water droplet [47]. The visualization of the droplet spreading area in a porous material is possible by IR imaging even when other optical techniques fail.
Evaporation proceeds differently rate in case of wetting (θb90°) and non-wetting (θN90°) liquids [48]. Adequate fuel spreading in the anode side of a DAFC is very important, that is why the wetting behaviour of the fuel on the GDL must be learned. Moreover, the wetting and evapo- ration behaviour of water must also be studied to avoid cathode flooding. In this work we describe a complete wetting characterization protocol based on the combination of simple and cost-effective contact angle, IR thermography and mass measurements.
2. Experimental
Commercially available woven carbonfibre cloth (FuelCell Store;
CeTech Carbon cloth with MPL-W1S1009; product code 1595000) was the GDL used in our experiments. Its nominal thickness is 410μm. The
basic weight of this carbon cloth is 200 g/m2. One side is covered by a microporous layer (MPL) made of porous carbon material mixed with polytetrafluoroethylene (PTFE (approx. 30% PTFE)). The measurements were carried out on both sides of a circular GDL sample measuring 17 mm in diameter. The side with microporous layer is marked“MPL” and the other side, the backing layer is marked“BL”.
Surface morphologies of the sides were characterized using a Hitachi S-4700 scanning electron microscope (SEM). The accelerating voltage was 10 kV, the sample measured 5 × 5 mm, it was held in place by conducting carbon adhesive tape and charging was avoided by sputtering approx. 10 nm gold on the sample surface. Further morpho- logical characterization and porosity analysis were carried out using a Bruker Skyscan 2211 X-Ray Nanotomograph. The sample was scanned using a 11 Mp cooled CCD camera with an exposure time of 300 ms ap- plying a 0.5 mm Al-filter. 40 kV voltage and 600μA current was applied to a tungsten X-Ray source. Total scan time was 83 min for recording 1801 projection images for 360° by applying a rotation step of 0.2°
and a pixel resolution of 1μm. After the reconstruction of the projected images with NRecon reconstruction software, the volume rendered 3D CT images were visualized with CtVox (Skyscan Bruker, Belgium) and the porosity was calculated using CTAn (CT Analyser) software. The sur- face topography and roughness were analysed with a Veeco, Dektak8 Advanced Development Profiler® contact profilometer. The applied sty- lus tips had ~2.5μm curvature radius and the employed force to the sur- face during scanning was ~10μN. The mapped area was 4 × 4 mm. The horizontal resolution was 0.7μm and the vertical resolution was 40 Å.
The roughness calculation and visualization of the surface was per- formed by Vision data analysis software. The specific surface area of the GDL was calculated by the 5 point Brunauer-Emmett-Teller (BET) method from N2 adsorption isotherms recorded at 77 K on a Quantachrome NOVA 3000e instrument. Samples were degassed for 1.5 h at 150 °C before measurement.
Methanol (99.8% Sigma Aldrich), ethanol (abs. Molar Chemicals) and deionized water were used as received. In every case, 5μL solvent was dropped on the surfaces of the sample with an Eppendorf Explorer automatic pipette. 3 M of alcohol is a normal used concentration in the fuel cells [12,14].
2.1. Contact angle measurements
Starting and time-dependent static contact angles of sessile droplets were observed with a digital camera (Dino-Lite Edge Digital Micro- scope; AnMo Electronics Corp.; product code AM4815ZTL) at room tem- perature (Tatm.~25 °C), the magnification was between 70× and 90×.
The pictures were evaluated by ImageJ® software.
2.2. Thermal imaging and mass measurement
The GDL sample wasfixed by a plastic sheet and strong magnet onto a custom made sample holder featuring a 1.4 cm diameter circular cen- tre hole where the droplet could be placed on the sample surface. The GDL was heated by a Peltier cell placed under the sample holder to 60 °C. Droplet and wetted area were thermally imaged by an infrared (IR) camera (FLIR A655sc) placed 10 cm above the sample holder. The thermal sensitivity of the camera is 30 mK and the accuracy of the tem- perature measurement is ±2 °C up to 650 °C at 640 × 480 resolution. It has an uncooled microbolometer with a spectral range of 7.5–14.0μm.
The IR camera is equipped with a 2.9 × (50μm) IR close-up lens offering a 32 × 24 mmfield of view and 50μm spatial resolution. The recorded pictures were evaluated with FLIR ResearchIR Max and ImageJ® soft- ware. Both sides of the GDL's emissivity was determined by calibration at 60 °C with a reference tape (ε= 0.95).
The sample holder was placed on a Sartorius Cubis MSU225S-000- DU type analytical balance to measure the droplet weight variation dur- ing evaporation. The readability of the balance is ±0.01 mg. Data was collected with the SartoCollect software. This measurement can provide
information about the rate of evaporation from mass decreasing curves.
These were processed with Origin software. This measurement setup was described in detail earlier [45].
3. Results and discussion 3.1. GDL morphology
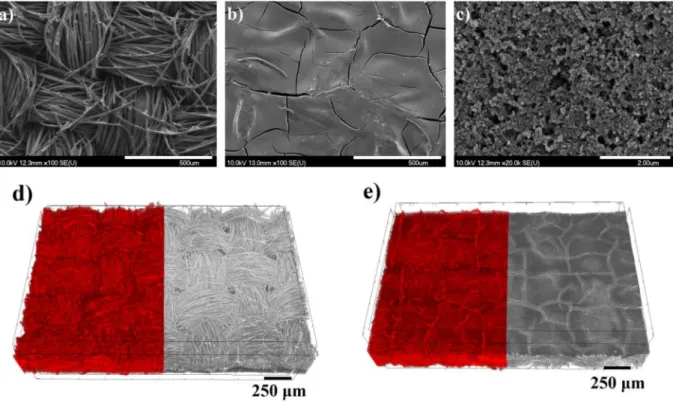
The structure and morphology of GDLs play important roles in fuel cell operation. These features can be determined by SEM or microCT analysis as shown inFig. 1.
The carbon cloth GDL is built from perpendicularly woven carbonfi- bres (Fig. 1a; d) measuring 9.7 ± 1.9μm in diameter according to SEM images. The individualfibres are formed into elliptical yarns which have a 350μm average major diameter and 185μm average minor di- ameter according to the CT images. There are 23 threads/cm in both di- rections. The microporous layer on the carbonfibre substrate (Fig. 1b–c;
e) is made of porous carbon powder. This coating is not a continuous layer as it has some mud-cracks orfissures (Fig. 1b; e) with a size be- tween 2 and 20μm [12,22,49,50]. The form of the Teflon® are particles which have a diameter 58 ± 15 nm according to the SEM image (Fig. 1c). On a smaller scale, the MPL appears uniform as illustrated by the higher magnification image inFig. 1c. MicroCT analysis (Figs. 1d– e;2) provides the opportunity to determine not only the surface but the inner morphology, too. The yarns and weaves are also discernible on these pictures. One yarn contains approximately 200fibres accord- ing to the CT images. The porosity of the sample can be determined from the CT images after the binarization of the volume rendered 3D image: by applying a proper segmentation threshold, the pores (Fig. 2c black) can be distinguished from the solid material (Fig. 2c white) on a grayscale image and the porosity can be obtained by calcu- lating the volume ratio of the two phases. The algorithm applied for bi- narization was the so-called Otsu method [51] which is built into the CTAn software.
The total porosity calculated by CT Analyser was ~54%. If the micro- porous layer was extracted from the textile by the software, the porosity
came to about 58% as expected. These data correlate well with literature wisdom. Lee et al. prepared GDLs using three different microporous layer deposition techniques, depositing a 30% Teflon content carbon powder mixture on a wet-proofed carbon cloth. The total porosity was 51, 57 or 61% depending on which deposition method was used [52].
The specific surface area of the carbon cloth is 8.3 m2/g.
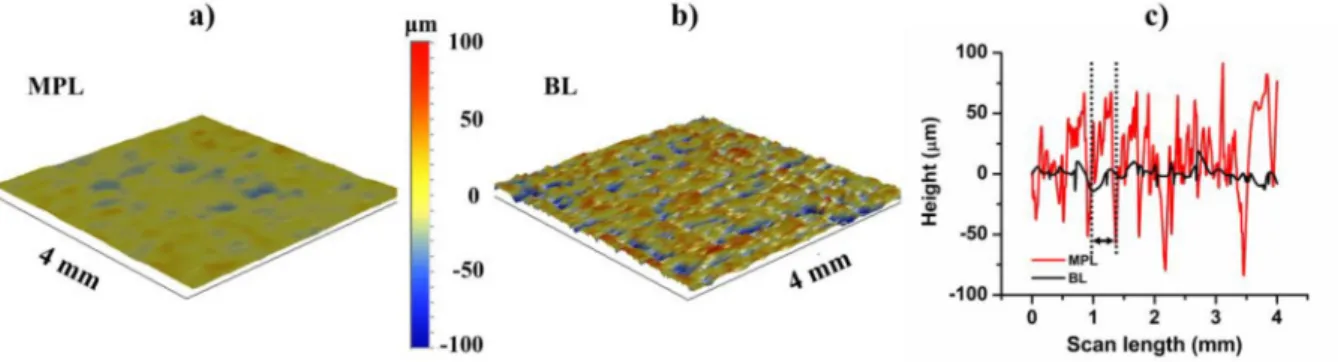
Surface roughness is an important as it affects water droplet detaching during fuel cell operation [43]. Typical GDL surface maps and line scans determined by profilometry as presented inFig. 3.
The scanned area was comparable with the droplet size, which was
~2.3 mm in diameter in the case of a water droplet. The average rough- ness (Ra) is the arithmetic average deviation from the mean line within the assessment length (L) which is given by
Ra¼1 L Z
x¼0 x¼L
j jydx ð1Þ
Herexis equal to the assessment length andyis the height of the surface features along the length. The microporous layer and the uncoated backing layer had an average surface roughness of 9.98 μm and 26.71μm, respectively. Therefore, the BL side isN2.5 times rougher than the microporous layer.
3.2. Alcohol wetting of GDL relevant for the anode side
Uniform fuel distribution at the anode side in case of liquid-feed DAFCs is particularly important [15,53]. The carbon cloth GDL used in the present work was wet-proofed by ~30 wt% Teflon®. Oliveira et al.
pointed out that using a microporous layer on the carbon cloth results in a better fuel cell performance due to the more uniform reactant dis- tribution at the anode side [15]. Contact angle measurement is a cost- effective and rapid wettability characterization method, as the contact angle is largely influenced by surface properties like roughness [23], chemical composition [47,48] and by the liquid features as well [54,55]. Our measurements were carried out by an optical method
Fig. 1.Characteristic SEM images (a–c) and typical volume rendered 3D CT images of the carbon cloth (d–e), where the left sides of the pictures show the pores with red colour and the right sides show the material. Pictures (a) and (d) depict the backing layer of the carbon cloth, while (b–c) and (e) display the microporous layer side.
contact angle determination method using a digital microscope at room temperature. Furthermore, IR thermography was utilized to determine the droplet size on the surface or the extent of liquid infiltration into the pore system. Even a small or transparent solvent droplet on/in a substrate can be detected easily by an IR camera if the solvent and sub- strate have appropriate different temperature (and/or different emis- sivity). The alcohol wetting of the GDL in PAB-DAFCs is particularly important because the fuel is transported from the backing layer to the microporous layer side only by natural driving forces [5]. Direct al- cohol fuel cells are typically fed by 2–4 M aqueous alcohol solutions [12,14], therefore, we tested the wetting behaviour for 3 M aqueous methanol and ethanol fuels.
Fig. 4presents the starting contact angles and droplet areas. Both sides of the GDL are hydrophobic because the CAs are above 90°:θ3M- EtOH_MPL= 117.9 ± 9.8°;θ3M EtOH-BL= 128.1 ± 4.8°;θ3M-MeOH_MPL=
130.3 ± 9.3°;θ3M-MeOH_BL= 131.7 ± 7°. Thisfinding agrees with the ex- pectations since the alcohol-water mixtures contain large amounts of water and the GDL is factory Teflon® treated [48]. The main reason be- hind the lower contact angles obtained for ethanol (Fig. 4) is that it has lower polarity than methanol.
Interestingly, the role of surface roughness is not negligible. Contact angles on the MPL side are lower than on the BL side in regard to both alcoholic mixtures. At theα= 0.05 significance level, this difference is statistically significant for the initial contact angles based on the paired
samplet-test (p3M EtOH= 0.00045, p3M MeOH= 0.04569). Considering the 2.5 times higher roughness value of the BL, thisfinding confirms that GDL surface roughness affects the wetting characteristics [56,57].
The initial droplet area as determined by thermography is larger in case of 3 M EtOH than for 3 M MeOH. Furthermore, the droplet area is larger on the MPL side than on the BL side in case of both solvents.
These results correlate well with the measured contact angles. The low- est contact angle and the greatest droplet size are found when 3 M EtOH contacts the MPL side, while 3 M MeOH features the greatest CA and the smallest droplet area on the BL side of the GDL. Smaller contact angles facilitate droplet spreading, thusflattening droplets before they infil- trate the pores.
3.3. Water wetting and evaporation relevant for the cathode side
Water can occur in the cathode side by three ways: (i) redundant water from the anode catalyst layer can permeate through the mem- brane (water crossover-WCO) due to electro-osmotic drag and diffusion [58]; (ii) water is produced by the electrochemical reaction on cathode catalyst layer, and (iii) water can be produced by oxidation reaction of the crossovered methanol on the cathode catalyst layer. Water can be eliminated from the cathode side in a PAB FC through natural convec- tion and evaporation. If this process is slow, then water can accumulate in the pores. This phenomenon is called cathode flooding. It is Fig. 2.Cross-sectional CT images from the carbon cloth: a representative volume rendered 3D picture (a), a slice image (b) from the 3D picture and a segmented (black and white) image (c) from the slice.
Fig. 3.Surface map digital image of the microporous layer (MPL) (a) and the uncoated backing layer (BL) of the carbon cloth (b). Line scanfigure (c) is represented for both sides. The width of one yarn on backing layer is marked by a double-headed arrow between broken lines (c). The topography (the values of depths and heights) is marked with colours on (a)–(b).
detrimental to FC performance because water in the pores blocks oxy- genflow [8]. GDL microstructure engineering and material choice can be used to prevent waterflooding. For example, a dual pore size distri- bution can improve FC performance under high current density and high humidity conditions due to the better water removal [20]. Carbon cloths typically feature a dual pore size distribution. Water accumulates in the waves offibre bundles (that is, in the larger pores), thus allowing oxygen canflow through the smaller pores created inside thefibre bun- dles, and this results in measurable FC performance improvement [59].
The role of surface roughness in this case is that water droplet detach- ment from the carbon cloth is easier than from carbon paper because of the higher surface roughness of the former, and this contributes to re- ducing mass transport losses [60]. Therefore, studying water evapora- tion from carbon cloth type GDLs is important.
Contact angle decreasing and mass decreasing curves during evapo- ration from the microporous layer (Fig. 5a) and the backing layer (Fig. 5b) are presented inFig. 5. Based on the starting contact angles the examined carbon cloth is hydrophobic because the CA is respec- tively 137° on MPL and 146° on the BL side. Again, it is obvious that the hydrophobic behaviour originates from the Teflon® treatment.
Picknett and Bexon have established [61] that droplet evaporation from a surface has two typical modes: the constant contact angle (CCA) and constant contact radius (CCR) regime. The rim of the droplet (the droplet contact area on the surface) in CCA mode is shrinking while the contact angle is constant. The droplet is pinned to the surface in CCR mode while the contact angle is decreasing. If the two modes occur to- gether and the contact angle and radius are decreasing simultaneously, it is the so-called mixed mode [61]. In our case both contact angle de- creasing curves can be separated into parts. First part is where the con- tact angles are constant or slowly decrease to 90°. After that, the CA decreases vigorously until the end of the evaporation. Therefore, it ap- pears that thefirst phase of the evaporation is in CCA mode and the sec- ond is in CCR mode.
Weight loss measurements are suitable to determine the evapora- tion rate [48]. We monitored the weight loss of a water droplet during evaporation at 60 °C simultaneously with thermal imaging and summa- rize thefindings inFig. 5. Here contact angles and masses are depicted as a function of relative time (t/ts) wheretsmarks the end of evaporation from the surface andtis the time passed since placing the droplet on the GDL. This notation is used only to maintain consistency with other Fig. 4.Average initial contact angles with errors (a) and plan view projection area (with errors) of the droplet (b) of 3 M of alcohols on both sides of the sample (MPL = microporous layer;
BL = backing layer) from IR measurements where the temperature was constant 60 °C. Room temperature was during contact angle measurements. The droplets were 5μL and minimum 4 droplets were averaged in both cases.
Fig. 5.Mass decreasing curves and contact angles changing of water droplet (black lines) with thefitted lines (red lines) in case of microporous layer-MPL (a) and backing layer-BL (b) of the sample. These are given in relative timet/tswheretthe actual time andtsthe droplet evaporation time from the surface and here thetscan be considered equal withtt(total evaporation time of the droplet). The intersection point offitted lines (tm) are marked by vertical dashed line which are guided the eyes. In every case the droplet volume was 5μL and the temperature was 60 °C during mass measurements and room temperature (T~25 °C) during contact angle measurements.
evaporation profile reports, because thermography (presented later) in- dicated that water does not actually penetrate into the GDL pores during the experiment. Therefore,tsin this particular system actually marks the end of the whole evaporation process. Even though the CA values were measured at room temperature, they are comparable with the weight loss data because CA is not affected by temperature [47]. In general, the evaporation rate is constant for wetting surfaces where the CA b90° while the contact line is constant, and non-linear evaporation oc- curs in case of non-wetting solids (where CAN90°). Here, the CA is con- stant while the contact line is receding [42,48,62]. In our case, the mass decreasing curves are non-linear (Fig. 5), which is characteristic of non- wetting liquids [48]. However, the mass decrease curves can be divided into two distinct parts based on the weight loss rate that is constant within a part. This is indicated by red linearfit lines inFig. 5. The inter- section of thefitted lines is markedtm.
The intersection points int/tsrelative time are tm-MPL= 0.61 and tm-
BL= 0.68 for the microporous and the backing layer side, respectively.
Notably, the contact angle also reaches 90° later on the backing layer (t/tsis 0.78) than on the microporous layer (t/tsis 0.6). First of all, this provides further evidence that the backing layer is more hydrophobic than the microporous layer. Moreover, the good agreement of thetm
values with the CA = 90° times provides strong evidence that a wetting mode transition takes place on both sides of the GDL.
Three stages of evaporation were identified by Chiang et al. when studying the behaviour of methanol-water mixtures on smooth and nanostructured surfaces [63]. These were the CCR, the CCA, and the shrinking modes. The rate of the evaporation could be calculated from the rate of volume decrease. The volume decreased the fastest in the first stage, then in the second stage, and the change was the slowest in the last stage. Furthermore, volume decrease rates were somewhat higher on smooth surfaces than on rougher ones [63]. In our case two stages could be identified, that were characterized by evaporation rates of 0.01701 mg/s and 0.01195 mg/s on the MPL side, and 0.01497 mg/s and 0.01203 mg/s on the BL side, respectively. Both obser- vations of Chiang et al. were reproduced: evaporation slows down with time and evaporation is faster from the MPL side than from the BL side, because the latter is more hydrophobic.
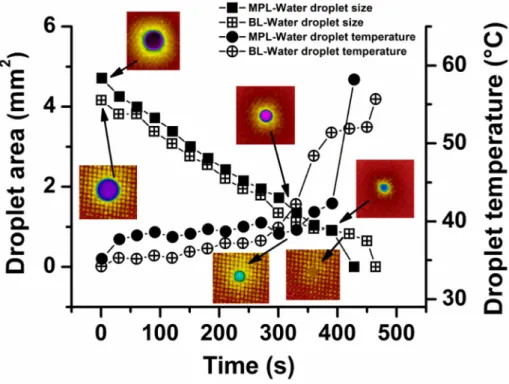
Interestingly, the wetting mode transition is also observable by IR thermography because it allows simultaneous droplet temperature and physical dimension measurements even on such an optically unfavourable material as a black GDL cloth (Fig. 6). It is worth noting that in such measurements“droplet area”corresponds to the area of the projection of the droplet to the GDL surface when the contact angle is above 90°, and to the actual contact area between the droplet and the surface when CA≤90°. The starting droplet size was bigger on the MPL side (Ad= 4.7 mm2) than on the BL side (Ad= 4.16 mm2), in good agreement with the results obtained for the aqueous solutions of alcohols discussed above. Similarly, the contact angle is again higher and the droplet area is smaller on the BL side. The droplet area decreases steadily until 271 s (which corresponds to 0.63 in relative evaporation time) on the MPL side and until 330 s (0.71 in relative time) on the BL side. Afterwards, the decrease slows down until 360 s (MPL side) or 450 s (BL side), corresponding to approx. 0.9 in relative evaporation time, thenfinally, droplet shrinkage speeds up again to conclude the evaporation. It is remarkable that the switch from the constant area de- crease stage to the slowing phase takes place when the contact angles reaches the 90° (compare withFig. 5).
The initial temperature of the water droplet touching the surface is 35.2 °C on the MPL side and 34.2 °C on the BL side. Droplet temperature variation during evaporation is governed by three factors: (i) the heat capacity of the droplet, determined by its volume, (ii) heat transfer from the GDL to the droplet, determined by the contact area, and (iii) heat loss to the atmosphere, determined by the surface of the droplet semi-ellipsoid. When the contact area between the droplet and surface is small, heat transfer is also slower, which can result in a lower evapo- ration rate [64]. We refer to Bogya et al. [45] for more exact calculations on the subject. It is enough to note here that the volume decreases with approx. the 1.5 power of the droplet area. As long as the droplet is suf- ficiently large, the dominant temperature determining factor is the heat gain–heat loss balance that keeps the droplet temperature fairly constant. When the droplet area drops below a critical value, the rapid loss of volume (and consequently, heat capacity) become dominant, resulting in the abrupt temperature increase up to that of the GDL as the evaporation is concluded. Differences between the temperature
Fig. 6.Size and temperature of water droplets as a function of evaporation time, as determined by thermography on the microporous layer (MPL) side and backing layer (BL) side. A few IR camera images illustrate the appearance of the droplets on various surfaces. In every case the droplet volume was 5μL and the GDL temperature was set to 60 °C.
evolution of the MPL and BL sides are largely due to the different rough- ness of the surfaces.
4. Conclusion
We confirmed that the combination of three independent experi- mental methods (weight loss measurement, contact angle measure- ment, thermography) allows the reliable characterization of the wetting behaviour of surfaces relevant in energy applications in a rapid, cost effective manner. We studied the wetting of a commercial carbon cloth type gas diffusion layer typically used in direct alcohol fuel cells. The GDL was wetted by aqueous alcohol mixtures and water, relevant for the anode and cathode side processes in a working fuel cell, respectively. Ethanol containing fuel offered better spreading characteristics than methanol, especially on the microporous surface of the anode side GDL. As for the cathode side, our measurements have verified the promising applicability of the Teflon-containing car- bon cloth as a GDL, particularly because of its hydrophobic behaviour and its ability to reject water from its pore structure. When studying water evaporation from the carbon cloth, we found evidence that the first stage of the process occurs in constant contact angle mode, then a wetting mode transition takes place at approx. 0.65 relative evaporation time and then the evaporation proceeds in constant contact radius mode. Differences observed in the behaviour of the microporous and the backing layer of the carbon cloth could be traced back to surface roughness differences. Thesefindings mayfind application in the ratio- nal design of direct alcohol fuel cells and can promote good practices in the thorough characterization of GDL wetting by introducing weight loss and thermography-based evaporation profile analysis to the tool- box of surface wetting specialists.
CRediT authorship contribution statement
Krisztina Anita Nagy:Investigation, Formal analysis, Visualization, Conceptualization, Writing - original draft.Ildikó Y. Tóth:Conceptuali- zation, Writing - review & editing.GergőBallai:Investigation, Formal analysis.Ágnes Timea Varga: Investigation, Formal analysis.Imre Szenti:Investigation, Formal analysis, Visualization.Dániel Sebők:In- vestigation, Formal analysis, Visualization.Judit Kopniczky:Investiga- tion, Formal analysis, Visualization.Béla Hopp: Supervision.Ákos Kukovecz:Conceptualization, Funding acquisition, Writing - review &
editing, Supervision.
Declaration of competing interest
The authors declare that they have no known competingfinancial interests or personal relationships that could have appeared to influ- ence the work reported in this paper.
Acknowledgements
Financial support for purchasing the CT instrument was provided by the Hungarian National Research, Development and Innovation Office (Hungary) through project GINOP-2.3.3-15-2016-00010. Additional re- search support was provided by the GINOP-2.3.2-15-2016-00013 and the K126065 projects. D.S. and I.Y.T. acknowledge the support of the János Bolyai Research Scholarship of the Hungarian Academy of Sci- ences (Hungary). The Ministry of Human Capacities, Hungary grant 20391-3/2018/FEKUSTRAT is also acknowledged.
References
[1] IEA, World Energy Outlook 2014, International Energy Agency, 2014.
[2] R. Yadav, A. Subhash, N. Chemmenchery, B. Kandasubramanian, Graphene and graphene oxide for fuel cell technology, Ind. Eng. Chem. Res. 57 (29) (2018) 9333–9350.
[3] A. Kirubakaran, S. Jain, R.K. Nema, A review on fuel cell technologies and power elec- tronic interface, Renew. Sust. Energ. Rev. 13 (9) (2009) 2430–2440.
[4] C.K. Dyer, Fuel cells for portable applications, J. Power Sources 106 (1) (2002) 31–34.
[5] T.S. Zhao, R. Chen, W.W. Yang, C. Xu, Small direct methanol fuel cells with passive supply of reactants, J. Power Sources 191 (2) (2009) 185–202.
[6] S.K. Kamarudin, F. Achmad, W.R.W. Daud, Overview on the application of direct methanol fuel cell (DMFC) for portable electronic devices, Int. J. Hydrog. Energy 34 (16) (2009) 6902–6916.
[7] O.S. Popel, A.B. Tarasenko, S.P. Filippov, Fuel cell based power-generating in- stallations: state of the art and future prospects, Therm. Eng. 65 (12) (2018) 859–874.
[8] N.K. Shrivastava, S.B. Thombre, R.B. Chadge, Liquid feed passive direct methanol fuel cell: challenges and recent advances, Ionics 22 (1) (2015) 1–23.
[9] W. Ying, J. Ke, W. Lee, T. Yang, C. Kim, Effects of cathode channel configurations on the performance of an air-breathing PEMFC, Int. J. Hydrog. Energy 30 (12) (2005) 1351–1361.
[10] S.U. Jeong, E.A. Cho, H.-J. Kim, T.-H. Lim, I.-H. Oh, S.H. Kim, Effects of cathode open area and relative humidity on the performance of air-breathing polymer electrolyte membrane fuel cells, J. Power Sources 158 (1) (2006) 348–353.
[11] J. Li, D. Ye, X. Zhu, Q. Liao, Y. Ding, X. Tian, Effect of wettability of anode microporous layer on performance and operation duration of passive air-breathing direct meth- anol fuel cells, J. Appl. Electrochem. 39 (10) (2009) 1771–1778.
[12] Y.S. Li, T.S. Zhao, J.B. Xu, S.Y. Shen, W.W. Yang, Effect of cathode micro-porous layer on performance of anion-exchange membrane direct ethanol fuel cells, J. Power Sources 196 (4) (2011) 1802–1807.
[13] M.A. Abdelkareem, A. Allagui, E.T. Sayed, M. El Haj Assad, Z. Said, K. Elsaid, Compar- ative analysis of liquid versus vapor-feed passive direct methanol fuel cells, Renew.
Energy 131 (2019) 563–584.
[14] C. Xu, A. Faghri, X. Li, T. Ward, Methanol and water crossover in a passive liquid-feed direct methanol fuel cell, Int. J. Hydrog. Energy 35 (4) (2010) 1769–1777.
[15] V.B. Oliveira, J.P. Pereira, A.M.F.R. Pinto, Effect of anode diffusion layer (GDL) on the performance of a passive direct methanol fuel cell (DMFC), Int. J. Hydrog. Energy 41 (42) (2016) 19455–19462.
[16]J. Han, H. Liu, Real time measurements of methanol crossover in a DMFC, J. Power Sources 164 (1) (2007) 166–173.
[17] M.Z.F. Kamarudin, S.K. Kamarudin, M.S. Masdar, W.R.W. Daud, Review: direct etha- nol fuel cells, Int. J. Hydrog. Energy 38 (22) (2013) 9438–9453.
[18] M.W. Ellis, M.R.V. Spakovsky, D.J. Nelson, Fuel cell systems: efficient,flexible energy conversion for the 21st century, Proc. IEEE 89 (12) (2001) 1808–1818.
[19]N. Sammes, Fuel Cell Technology: Reaching Towards Commercialization, Springer Science & Business Media, 2006.
[20] R. Omrani, B. Shabani, Review of gas diffusion layer for proton exchange membrane- based technologies with a focus on unitised regenerative fuel cells, Int. J. Hydrog. En- ergy 44 (7) (2019) 3834–3860.
[21] B.A. Braz, V.B. Oliveira, A.M.F.R. Pinto, Experimental studies of the effect of cathode diffusion layer properties on a passive direct methanol fuel cell power output, Int.
J. Hydrog. Energy 44 (35) (2019) 19334–19343.
[22]A. Arvay, E. Yli-Rantala, C.H. Liu, X.H. Peng, P. Koski, L. Cindrella, P. Kauranen, P.M.
Wilde, A.M. Kannan, Characterization techniques for gas diffusion layers for proton exchange membrane fuel cells–a review, J. Power Sources 213 (2012) 317–337.
[23] J.Z. Fishman, H. Leung, A. Bazylak, Droplet pinning by PEM fuel cell GDL surfaces, Int.
J. Hydrog. Energy 35 (17) (2010) 9144–9150.
[24] M.F. Mathias, J. Roth, J. Fleming, W. Lehnert, Diffusion media materials and charac- terisation, Handbook of Fuel Cells, 2010.
[25] P. Antonacci, S. Chevalier, J. Lee, N. Ge, J. Hinebaugh, R. Yip, Y. Tabuchi, T. Kotaka, A.
Bazylak, Balancing mass transport resistance and membrane resistance when tailor- ing microporous layer thickness for polymer electrolyte membrane fuel cells oper- ating at high current densities, Electrochim. Acta 188 (2016) 888–897.
[26]Z. Qi, A. Kaufman, Improvement of water management by a microporous sublayer for PEM fuel cells, J. Power Sources 109 (1) (2002) 38–46.
[27]L.R. Jordan, A.K. Shukla, T. Behrsing, N.R. Avery, B.C. Muddle, M. Forsyth, Diffusion layer parameters influencing optimal fuel cell performance, J. Power Sources 86 (1) (2000) 250–254.
[28] G.-G. Park, Y.-J. Sohn, T.-H. Yang, Y.-G. Yoon, W.-Y. Lee, C.-S. Kim, Effect of PTFE con- tents in the gas diffusion media on the performance of PEMFC, J. Power Sources 131 (1–2) (2004) 182–187.
[29]M. Möst, M. Rzepka, U. Stimming, Analysis of the diffusive mass transport in the anode side porous backing layer of a direct methanol fuel cell, J. Power Sources 191 (2) (2009) 456–464.
[30] J.T. Gostick, M.A. Ioannidis, M.W. Fowler, M.D. Pritzker, Wettability and capillary be- havior offibrous gas diffusion media for polymer electrolyte membrane fuel cells, J.
Power Sources 194 (1) (2009) 433–444.
[31] M. Han, J.H. Xu, S.H. Chan, S.P. Jiang, Characterization of gas diffusion layers for PEMFC, Electrochim. Acta 53 (16) (2008) 5361–5367.
[32] R. Flückiger, S.A. Freunberger, D. Kramer, A. Wokaun, G.G. Scherer, F.N. Büchi, Aniso- tropic, effective diffusivity of porous gas diffusion layer materials for PEFC, Electrochim. Acta 54 (2) (2008) 551–559.
[33] R.R. Rashapov, J. Unno, J.T. Gostick, Characterization of PEMFC gas diffusion layer po- rosity, J. Electrochem. Soc. 162 (6) (2015) F603–F612.
[34] I.V. Zenyuk, D.Y. Parkinson, L.G. Connolly, A.Z. Weber, Gas-diffusion-layer structural properties under compression via X-ray tomography, J. Power Sources 328 (2016) 364–376.
[35] Z. Fishman, J. Hinebaugh, A. Bazylak, Microscale tomography investigations of het- erogeneous porosity distributions of PEMFC GDLs, J. Electrochem. Soc. 157 (11) (2010) B1643.
[36] J. Farmer, B. Duong, S. Seraphin, S. Shimpalee, M.J. Martínez-Rodríguez, J.W. Van Zee, Assessing porosity of proton exchange membrane fuel cell gas diffusion layers by scanning electron microscope image analysis, J. Power Sources 197 (2012) 1–11.
[37] U. Pasaogullari, C.-Y. Wang, Two-phase transport and the role of micro-porous layer in polymer electrolyte fuel cells, Electrochim. Acta 49 (25) (2004) 4359–4369.
[38] J. Lee, R. Yip, P. Antonacci, N. Ge, T. Kotaka, Y. Tabuchi, A. Bazylak, Synchrotron inves- tigation of microporous layer thickness on liquid water distribution in a PEM fuel cell, J. Electrochem. Soc. 162 (7) (2015) F669–F676.
[39]S. Chevalier, J. Lee, N. Ge, R. Yip, P. Antonacci, Y. Tabuchi, T. Kotaka, A. Bazylak, In operando measurements of liquid water saturation distributions and effective diffu- sivities of polymer electrolyte membrane fuel cell gas diffusion layers, Electrochim.
Acta 210 (2016) 792–803.
[40] A.D. Shum, D.Y. Parkinson, X. Xiao, A.Z. Weber, O.S. Burheim, I.V. Zenyuk, Investigat- ing phase-change-inducedflow in gas diffusion layers in fuel cells with X-ray com- puted tomography, Electrochim. Acta 256 (2017) 279–290.
[41]S.M. Mahnama, M. Khayat, Three dimensional investigation of the effect of MPL characteristics on water saturation in PEM fuel cells, Journal of Renewable and Sus- tainable Energy 9 (1) (2017), 014301.
[42] G. McHale, S.M. Rowan, M.I. Newton, M.K. Banerjee, Evaporation and the wetting of a low-energy solid surface, J. Phys. Chem. B 102 (11) (1998) 1964–1967.
[43] E. Gauthier, T. Hellstern, I.G. Kevrekidis, J. Benziger, Drop detachment and motion on fuel cell electrode materials, ACS Appl. Mater. Interfaces 4 (2) (2012) 761–771.
[44]P. Hao, C. Lv, F. He, Evaporating behaviors of water droplet on superhydrophobic surface, Science China Physics, Mechanics and Astronomy 55 (12) (2012) 2463–2468.
[45]E.S. Bogya, B. Szilágyi, Á. Kukovecz, Surface pinning explains the low heat transfer coefficient between water and a carbon nanotubefilm, Carbon 100 (2016) 27–35.
[46] B. Zhang, L. Lu, K.S. Teh, H. Wang, Z. Wan, Y. Tang, An IR thermal imaging method to investigate spreading process of ethanol solution droplets on carbonfiber mats, Ap- plied Physics A 122 (12) (2016).
[47]O.A. Obeisun, D.P. Finegan, E. Engebretsen, J.B. Robinson, O.O. Taiwo, G. Hinds, P.R.
Shearing, D.J.L. Brett, Ex-situ characterisation of water droplet dynamics on the sur- face of a fuel cell gas diffusion layer through wettability analysis and thermal char- acterisation, Int. J. Hydrog. Energy 42 (7) (2017) 4404–4414.
[48] K.S. Birdi, D.T. Vu, Wettability and the evaporation rates offluids from solid surfaces, J. Adhes. Sci. Technol. 7 (6) (1993) 485–493.
[49] C. Xu, T.S. Zhao, Y.L. He, Effect of cathode gas diffusion layer on water transport and cell performance in direct methanol fuel cells, J. Power Sources 171 (2) (2007) 268–274.
[50] J. Yu, M.N. Islam, T. Matsuura, M. Tamano, Y. Hayashi, M. Hori, Improving the perfor- mance of a PEMFC with Ketjenblack EC-600JD carbon black as the material of the microporous layer, Electrochem. Solid-State Lett. 8 (6) (2005) A320.
[51] N. Otsu, A threshold selection method from gray-level histograms, IEEE Transactions on Systems, Man, and Cybernetics 9 (1) (1979) 62–66.
[52] H.-K. Lee, J.-H. Park, D.-Y. Kim, T.-H. Lee, A study on the characteristics of the diffu- sion layer thickness and porosity of the PEMFC, J. Power Sources 131 (1–2) (2004) 200–206.
[53] C. Xu, T.S. Zhao, Q. Ye, Effect of anode backing layer on the cell performance of a di- rect methanol fuel cell, Electrochim. Acta 51 (25) (2006) 5524–5531.
[54]K. Sefiane, S. David, M.E.R. Shanahan, Wetting and evaporation of binary mixture drops, J. Phys. Chem. B 112 (36) (2008) 11317–11323.
[55] K. Sefiane, L. Tadrist, M. Douglas, Experimental study of evaporating water–ethanol mixture sessile drop: influence of concentration, Int. J. Heat Mass Transf. 46 (23) (2003) 4527–4534.
[56] A.B.D. Cassie, S. Baxter, Wettability of porous surfaces, Trans. Faraday Soc. 40 (0) (1944) 546–551.
[57] R.N. Wenzel, Resistance of solid surfaces to wetting by water, Industrial & Engineer- ing Chemistry 28 (8) (1936) 988–994.
[58]H. Mahyari, H.H. Afrouzi, M. Shams, Three dimensional transient multiphaseflow simulation in a dead end anode polymer electrolyte fuel cell, J. Mol. Liq. 225 (2017) 391–405.
[59] T. Sasabe, P. Deevanhxay, S. Tsushima, S. Hirai, Investigation on the effect of micro- structure of proton exchange membrane fuel cell porous layers on liquid water be- havior by soft X-ray radiography, J. Power Sources 196 (20) (2011) 8197–8206.
[60] Y. Wang, C.-Y. Wang, K.S. Chen, Elucidating differences between carbon paper and carbon cloth in polymer electrolyte fuel cells, Electrochim. Acta 52 (12) (2007) 3965–3975.
[61] R.G. Picknett, R. Bexon, The evaporation of sessile or pendant drops in still air, J. Col- loid Interface Sci. 61 (2) (1977) 336–350.
[62] S.A. Kulinich, M. Farzaneh, Effect of contact angle hysteresis on water droplet evap- oration from super-hydrophobic surfaces, Appl. Surf. Sci. 255 (7) (2009) 4056–4060.
[63] C.-K. Chiang, Y.-W. Lu, Evaporation phase change processes of water/methanol mix- tures on superhydrophobic nanostructured surfaces, J. Micromech. Microeng. 21 (7) (2011), 075003.
[64] S.Y. Misyura, P.A. Strizhak, R.S. Volkov, V.S. Morozov, The influence of the wall microtexture on functional properties and heat transfer, J. Mol. Liq. 294 (2019), 111670.