PAPER • OPEN ACCESS
Investigation of convective heat transfer enhancement for nanofluid flow over flat plate
To cite this article: M M Klazly and G Bognár 2020 J. Phys.: Conf. Ser. 1564 012007
View the article online for updates and enhancements.
Content from this work may be used under the terms of theCreative Commons Attribution 3.0 licence. Any further distribution
Investigation of convective heat transfer enhancement for nanofluid flow over flat plate
M M Klazly1 and G Bognár1
1 University of Miskolc, Department of Machine and Product Design, 3515, Miskolc- Egyetemváros, Hungary
E-mail: v.bognar.gabriella@uni-miskolc.hu
Abstract. In this paper, the laminar flow over flat plate of three different nanofluids is investigated. The fluid is considered as water with three different kind of solid particles Al2O3, TiO2, and Fe3O4 of different volume fractions (1, 2, 3, and 4%). The values of viscosity, heat capacity, density, and thermal conductivity depending on volume fraction for the three nanofluids are evaluated. Numerical simulation has been conducted for analysis the impact of the nanoparticles on the heat transfer properties, on the temperature and velocity profiles, on the wall shear stress and on the skin friction coefficient. The results show that as the value of volume fraction increases the values of the wall shear stress, skin friction, and heat transfer increase, but the velocity decreases. A comparison between the three nanofluids presents the difference in the thermal enhancement, velocity profiles, and thermal boundary layer. With the volume fraction for all three nanofluids polynomial connections has been obtained to describe for the relation of the wall shear stress, skin friction coefficient and average heat transfer coefficient.
1. Introduction:
The traditional fluids (e.g., water, ethylene, oil etc) have limited heat transfer capabilities due to the poor thermal properties such as the thermal conductivity, which led researchers to try to overcome this barrier by improving the thermal conductivity of this fluids to have more efficient systems. The list of the industrial applications, where better generation of heat transfer fluids could be utilized, is endless for example hot rolling, drying of paper, biomedicine, food processing, nuclear reactors etc. Generally, the thermal conductivity of metal particles is higher than that of the base fluid. Therefore, many techniques have been implemented to enhance thermal performance of the traditional fluids. One of the early methods is via suspension of nanoparticles in base fluid. Adding particles of various materials that have higher thermal conductivity than the base fluid can enhance the thermal properties [1], [2]. This method was introduced by Cho [3] he coined the term nanofluid. Nanofluids have a bigger effective thermal conductivity due to the extremely large surface area of nanoparticles and led them to be potential candidate considering in the heat transfer media. This the thermal performance enhancement method has attracted considerable attention in wide range of industrial applications and academic field.
The analysation of the thermal physical properties of nanofluids includes several parameters for instance: volume fraction, base fluid (water, oil ….), nanoparticles size and shape, and particles migration patterns, all these parameters play vital roles on the final nanofluid performance. The influence of the nanoparticles’ types on heat transfer has been studied by many researchers. Anuar studied the effect of Al2O3,Cu, and TiO2 particles in the classical Blasius problem [4]. The volume fraction has been one of the weightiest parameters in nanofluid. Lee showed that the thermal conductivity has been increased linearly with the increase of volume fraction [5]. Khanafer developed a 2D model to study the heat transfer performance of nanofluids inside an enclosure [6]. In [7] Congedo investigated the natural convection flow for Al2O3-water nanofluid. The solution of the nanofluid problems has been investigated by different methods. In the literature, authors have used single phase
approach in various geometries such as flat plate, wedge, square channel, circular tube and flow over cylinder[2], [8], [9], [10]. These studies highlight the enhancement of the heat transfer in the presence of nanoparticles in the base fluid. In the present study we numerically investigate the characteristics of the thermal and hydraulic flow of nanofluid passed over flat plate for three types of nanoparticles and volume fractions (0.01,0.02,0.03,0.04 vol %). CFD simulations are performed, the variation of the velocity and temperature is presented. The skin friction coefficient and the local Nusselt number in the nanofluids are calculated in comparison of the impact of the nanoparticles and particle concentrations.
2. Mathematical Model
Figure 1. The flow configuration
Consider the nanofluid flow in two-dimension above a steady plate. The sheet is maintained at a constant temperature Tw = 400 K (see Figure 1). In our CFD simulation, single phase approach is employed for modelling the thermal properties of nanofluid. The flow is laminar and steady-state.
Considering a Cartesian coordinate system (x, y) for two-dimensional flow of a nanofluid over flat plate, where x is the coordinate measured along the plate and y is normal to it. The fluid flows on the top surface with constant velocity = 0.01 m/s and the temperature outside the thermal boundary layer is ! = 300 K.
2.1. Governing equations
The basic equations that describe the mass, momentum and energy in the fluid flow can be written in vectoral form as:
· conservation of mass:
∇. # = 0, (1)
· conservation of momentum:
(#. ∇)# = − %
&'*∇+ +2'*
&'*∇3# (2)
· conservation of energy:
(#. ∇)! = 4∇3!, (3) where the following notations are used:
V: the velocity vector,
!: the temperature of the nanofluid, + : the pressure of the nanofluid,
5: the dynamic viscosity of the nanofluid, 6: the density of the nanofluid,
4: thermal diffusivity of the nanofluid.
2.2. Physical properties of the nanofluid
Here we the physical properties of the nanofluid are given with the dimensionless nanoparticle concentration Ø as follows:
a) Viscosity
Here, 5 is the viscosity, 57 is the viscosity of the base fluid (water), and 8 denotes nanoparticle volume fraction as Brinkman [12], [13]:
5 = 29
(%;<)>.? . (4) b) Density and heat capacity
The effective density of the nanofluid is given by [14],
, T@A
Tw, Uw
6 = (1 − 8)67+ 86B, (5) where 67 and 6B denote the density base fluid, and nanoparticles, respectively, and the heat capacity of the nanofluid CB is assumed as below [15], [14]:
CB =<(&DE)EF(%;<)(&DE)9
&'* . (6) c) Thermal conductivity
In our calculations, G denotes the thermal conductivity of nanofluid, G7 the thermal conductivity of base fluid, GB the thermal conductivity of the particles given as follows [16]:
G= G7HEF3H9;3<(H9;HE)
HEF3H9F<(H9;HE). (7)
3. The effect of the nanoparticles on the fluid properties
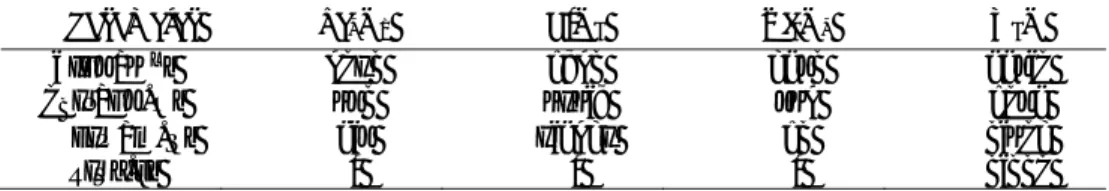
The effect of adding different nanoparticles on the physical properties are studied by calculating the numerical values of the physical parameters for Al2O3, TiO2, and Fe3O4. Moreover, we analyse the effect of the volume fraction from 1 to 4 % on the thermo-physical properties of the base fluid for all three nanofluids. Table 1 shows the thermo-physical properties for water, Al2O3, Fe3O4, and TiO2
particles [18].
Table 1. The thermo-physical properties of water, Al2O3, TiO2, and Fe3O4 particles
The effect of volume fraction on density for Al2O3, TiO2,and Fe3O4 water nanofluids is depicted in Figure 2. When volume fraction increases, density of all three types of nanofluids increases and the increase is more for Fe3O4-water nanofluid than the TiO2-water, and Al2O3-water nanofluids. The lowest nanofluid density was noted in Al2O3-water due to the low density of the alumina particles comparing to the other additives.
Figure 2. The effect of nanoparticles on the density
The result of increasing the quantity of nanoparticles in base fluid on the thermal capacity on the base of equation (6) is plotted in Figure 3. It shows a decrease in the thermal capacity with increasing the value of 8. The comparison between the three nanofluid mixtures showed that the fluid with the
950 1000 1050 1100 1150 1200
0 0,005 0,01 0,015 0,02 0,025 0,03 0,035 0,04
6[kg/m3]
Al2O3 8 TiO2 Fe3O4
Parameter Fe3O4 TiO2 Al2O3 H2O
6[GJ/KL] 5180 4250 3970 997.1
CB[N/GJ. O] 670 686.2 765 4179
k[w/m. K] 9.7 8.9538 40 0.613
μ[Pa. s] - - - 0.001
highest thermal capacity is Al2O3 with base water. That variation of the thermal capacity is influenced by the value of the density and the thermal capacity of the nanoparticles.
Figure 3. The effect of nanoparticles on the thermal capacity
Figure 4 shows the impact of increasing 8 on the viscosity of the nanofluid. Applying the viscosity equation (4) (Brinkman formula), it can be seen that the viscosity is only influenced by parameter 8, and not sensitive to the type of nanoparticles. The three nanoparticles show the same effect on the viscosity, which is increasing when the concentration has increased. The influence of increasing the concentration of nanoparticles on the thermal conductivity of the nanofluid are plotted in Figure 5. The thermal conductivity (7) increases with increasing the value of 8. Al2O3-water nanofluid has the highest thermal conductivity followed by Fe3O4, and TiO2 respectively. Figure 6 presents the effect of 8 on (6CB). It is noted that the highest values are obtained for Fe3O4.
Figure 4. The effect of nanoparticles on the viscosity
Figure 5. The effect of nanoparticles on the thermal conductivity
0,00098 0,001 0,00102 0,00104 0,00106 0,00108 0,0011 0,00112
0 0,005 0,01 0,015 0,02 0,025 0,03 0,035 0,04
5[Pa.s]
8 3400
3600 3800 4000 4200 4400
0 0,005 0,01 0,015 0,02 0,025 0,03 0,035 0,04
Cp
8
Al2O3 TiO2 Fe3O4
0,6 0,62 0,64 0,66 0,68 0,7
0 0,005 0,01 0,015 0,02 0,025 0,03 0,035 0,04
k[w/m.k]
8
Al2O3 TiO2 Fe3O4
8
Figure 6. The effect of nanoparticles on (6CB)
4. CFD procedure 4.1. Numerical procedure
The fluid flows above a flat plate with constant velocity 0.01 m/s at temperature 300 K, the horizontal plate is stationary with no slip condition and with fluid temperature 400 K. The equations (1)-(3) of continuity, momentum, and energy are discretized and solved using ANSYS 18. For the computational domain and mesh, the computational domain geometry was generated using Design Modeler and grid are generated using ANSYS Fluent mesh. The pre-processing module for the Fluent software is as in [19]. The CFD domain consists of inlet and outlet, which have been divided by the number of division type with 100 divisions, the behaviour is set to hard with bias factor 40 to increase the number of subdomains near to the plate and to increase the preciseness near the wall. The sides AD and BC are symmetry and wall, respectively. Both are divided using the same method with 200 divisions. The mesh generation sensitivity has been considered in the Grid independency part. The boundary conditions have been setup as shown in Table 2. Laminar model is used with pressure-velocity coupling. The relaxation factor is 1 for density; body force and energy, the thermophysical properties of nanofluids including;
density, thermal conductivity, viscosity, and thermal capacity are calculated using single phase approach as it is extensively used in the literature [9], [20], [21]. This approach assumes that the mixture is homogenous, and the presence of the nanoparticles is present by modifying the physical properties of the mixture fluid. The following assumptions are applied: there is no difference between the velocity of the fluid and particles, and both of them in thermal equilibrium [8]. These assumptions have been applied in calculating the effect of adding nanoparticles to the water in the CFD simulation.
Table 2. The boundary conditions
4.2. Grid independency
The grid independence test is made to ensure the obtained solution is mesh independent because the accuracy of the finite volume methods is directly related to the quality of the discretization used.
Therefore, a comprehensive mesh sensitivity study has been done to minimize the numerical influences introduced by the size of the meshes. The simulations are first performed for the different meshes with various number of cells (see Table 3) in process called mesh refinement where the mesh has been improved in each mesh refinement process. The analysis of the mesh sensitivity has been done for five meshes and the test has compared the average Nusselt number on the plate for each mesh and the results are presented in Table 3. It can be seen that the Nusselt number for the mesh 4 with 20.000 cells found to be satisfactory to ensure the accuracy of the solution as well as the independency of the grid.
AB Velocity inlet
BC wall
CD outlet
AD symmetry
4110000 4120000 4130000 4140000 4150000 4160000 4170000
0 0,005 0,01 0,015 0,02 0,025 0,03 0,035 0,04
Al2O3 TiO2 Fe3O4
Table 3. The grid independency examination
5. Comparison of the analytical results with CFD results
The comparison of the CFD solution and analytical solution is used for validation, which distilled pure water as working fluid. To validate the accuracy and reliability of the present CFD simulation, the calculated results are compared with analytical solution [23], for local Nusselt number along the plate, skin friction, and average heat transfer coefficient. The comparison of the local skin friction coefficient between the analytical and CFD simulation is presented in Figure 7. The CFD result showed a good agreement with the analytical solution with difference 2.426% for the skin friction coefficient. The comparison of the average heat transfer given in Table 4 shows a maximum 0.838% difference between the two solutions. The comparison of the local Nusselt number are plotted in Figure 8 with maximal difference 7.5 %.
Figure 7. Skin friction comparison (water)
Table 4. Average heat transfer coefficient comparison (water)
Method CFD Analytical Difference %
ℎV 76.42085 77.0670 0.838
Figure 8. The local Nusselt numbers’ comparison for water
0 10 20 30 40 50 60 70 80 90 100
0,1 0,2 0,3 0,4 0,5 0,6 0,7 0,8 0,9 1
WXY
x[m]
CFD analytical
Mesh Number of cells Average Nusselt number
Average heat transfer coefficient
1 7000 121.162 74.2728
2 9600 123.036 75.4210
3 14400 124.041 76.0376
4 20000 124.662 76.4165
5 26400 124.580 76.3678
0 0,005 0,01 0,015 0,02 0,025
0,1 0,2 0,3 0,4 0,5 0,6 0,7 0,8 0,9 1
Cf
x[m]
CFD Analytical
6. Results
6.1. The effect of nanoparticles on the wall shear stress (Al2O3-water)
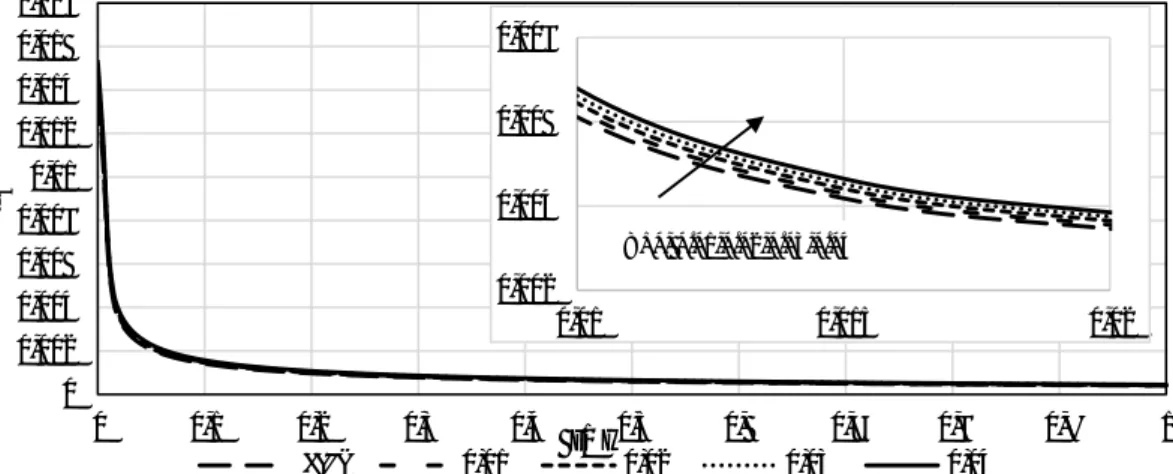
Figure 9 is plotted for exhibiting the variation of the wall shear stress with the volume fraction for Al2O3-water nanofluid. As can be observed that the value of the wall shear stress has increased as the value of the nanoparticle’s concentration increased.
Figure 9. The effect of Al2O3 nanoparticles on the wall shear stress
Figure 10. The wall shear stress vs volume fraction at x=0
Figure 10 shows a polynomial increase in the wall shear stress for the three nanoparticles. This increase in the wall shear stress can be predicted using the correlations for each nanoparticle as in Table 5 for volume fractions ranging from 0 to 4 %. The highest increase in wall shear stress is observed for Fe3O4-water nanofluid, while the increase was slightly higher for TiO2 than for Al2O3. The effect of the value 8 showed the same effect on the skin friction coefficient, and the effect is presented in Fig. 11.
The increasing tendency of the skin friction coefficient can be predicted due to the correlations in Table 6 for the nanofluids.
Table 5. The description of the wall shear stress with 8 (R²=1)
Nanofluid Wall shear stress
Al2O3-water Zw = 0.0431 8 2+0.0367 8 + 0.01378 Fe3O4-water Zw = 0.0420 8 2+ 0.0423 8 + 0.01378 TiO2-water Zw= 0.0511 8 2+ 0.03765 8 + 0.01378 0
0,002 0,004 0,006 0,008 0,01 0,012 0,014 0,016 0,018
0 0,1 0,2 0,3 0,4 0,5 0,6 0,7 0,8 0,9 1
Zw
x[m]
Water 0.01 0.02 0.03 0.04
0,0135 0,014 0,0145 0,015 0,0155 0,016
0 0,005 0,01 0,015 0,02 0,025 0,03 0,035 0,04
Zw
8
Al2O3 Fe3O2 TiO2
0,002 0,004 0,006 0,008
0,01 0,015 0,02
8=0, 0.01,0.02,0.03,0.04
Figure 11. The effect of 8 on the skin friction coefficient
Table 6. The connection of the skin friction coefficient with 8 (R²=1)
Nanofluid Skin friction coefficient
Fe3O4-water Cf = 0.6836 8 2 + 0.6908 8 + 0.225 TiO2-water Cf = 0.830 8 2 + 0.6150 8 + 0.225 Al2O3-water Cf = 0.7114 8 2 + 0.5984 8 + 0.225 6.2. The effect of the volume concentration on the velocity profile (Al2O3-water)
Figure 12 presents the effect of the volume fraction on the velocity profile for Al2O3-water nanofluid at different values of 8. It can be seen that the velocity increase and boundary layer thickness decrease with the increase of the volume fraction.
The comparison of the velocity profiles for the three different nanofluids with max.4 % volume fraction are plotted in the Figure 13. It can be noted that Fe3O4 has the thinnest boundary layer, and the boundary layer of the Al2O3 is the thickest among the nanofluids, while for the TiO2 it was slightly thinner than the boundary layer of Al2O3. The decrease in velocity can be referred to the density of the nanoparticles, since the viscosity is influenced only by the value of 8, and not by the type of the nanoparticles.
0,22 0,225 0,23 0,235 0,24 0,245 0,25 0,255 0,26
0 0,005 0,01 0,015 0,02 0,025 0,03 0,035 0,04
Cf
8
Fe3O4 TiO2 Al2O3
0 0,002 0,004 0,006 0,008 0,01 0,012
0
0 0,05 0,1 0,15 0,2 0,25 0,3 0,35 0,4 0,45 0,5
0 0 0
Velocity [m/s]
Y[m]
water 0.01 0.02 0.03 0.04
0,008 0,00805 0,0081 0,00815 0,0082
0,022 0,0222 0,0224 0,0226 0,0228 0,023
8 =0, 0.01,0.02,0.03,0.04
Figure 12. The effect of nanoparticles on the velocity profiles (Al2O3- water case)
Figure 13. The velocity profile for different nanofluids for 8 =0.04
6.3. The effect of nanoparticles on the temperature distribution
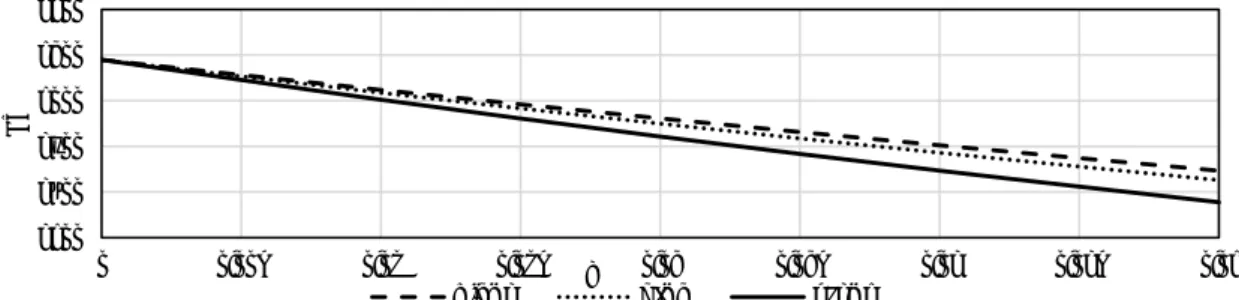
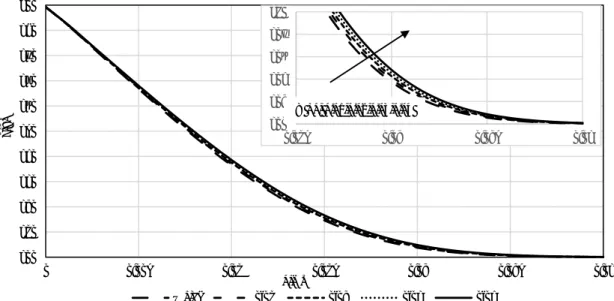
Figure 14 presents the effect of nanoparticle volume fraction on the temperature profile for Al2O3-water.
It can be concluded that the increase in volume fraction is to increase the temperature. The thermal boundary layer increases as the volume fraction increases due to higher resistance between the fluid and the wall and higher thermal conductivity of the mixture. Comparison of the temperature profiles for the three nanofluids at 8 =0.04 shows that Al2O3-waterhas the thickest thermal boundary layer followed by TiO2-water and Fe3O4-water, respectively. The result of comparing the thermal boundary layers for the three mixtures is presented in Figure 15.
Figure 14. The temperature profiles for different value of 8, (Al2O3 -water)
0 0,002 0,004 0,006 0,008 0,01 0,012
0 0,05 0,1 0,15 0,2 0,25 0,3 0,35 0,4 0,45 0,5
Velocity[m/s]
Y[m]
Fe3O4 TiO2 Al2O3
300 310 320 330 340 350 360 370 380 390 400
0 0,005 0,01 0,015 0,02 0,025 0,03
T[K]
Y[m]
Water 0.01 0.02 0.03 0.04
0,001 0,00105 0,0011 0,00115 0,0012
0,0024 0,0025 0,0026 0,0027 0,0028 0,0029 0,003
300 302 304 306 308 310
0,015 0,02 0,025 0,03
8 =0, 0.01,0.02,0.03,0.04
Figure 15. Comparison of the temperature for water based nanofluids with different nanoparticles (8
=0.04)
6.4. The effect of nanoparticles on the average heat transfer coefficient
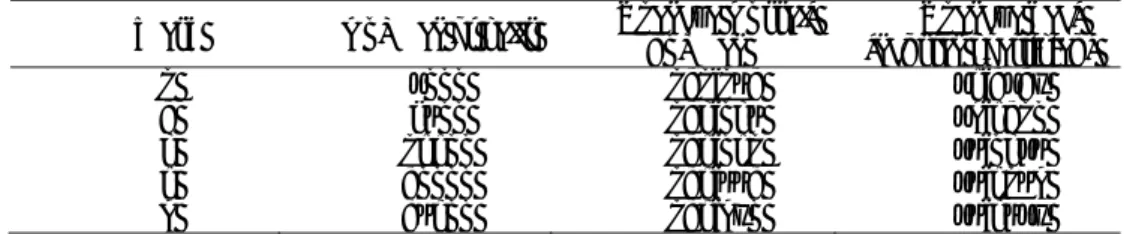
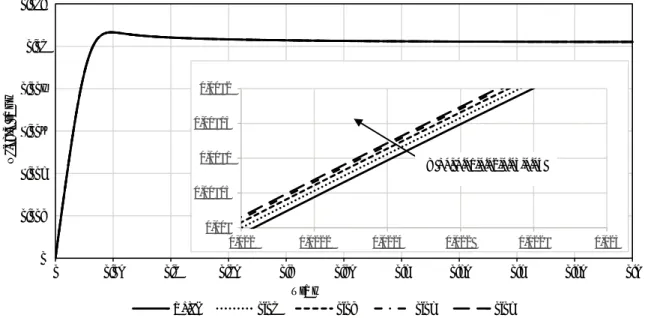
Figure 16 illustrates the impact of adding nanoparticles on the average heat transfer of the mixture. It can be observed that the value of volume fraction has influenced the heat transfer rate positively, the value of the heat transfer coefficient increased with increasing the value of the volume fraction. A comparison among Al2O3, Fe3O4, and TiO2 with different concentrations is presented in Table 7. Each nanoparticle has enhanced the heat transfer, while the higher enhancement is obtained for the Al2O3.
Table 7. The average heat transfer coefficient for different particles and different volume fraction
Table 8. Average heat transfer coefficient (R²=1)
300 310 320 330 340 350 360 370 380 390 400
0 0,005 0,01 0,015 0,02 0,025 0,03
T[k]
Al2O3Y[m] TiO2 Fe3O4
8 Al2O3-water Fe3O4-water TiO2-water
0 76.42085 76.42085 76.42085
0.01 77.85308 77.81988 77.66741
0.02 79.29031 79.20593 78.91704
0.03 80.73311 80.58955 80.15044
0.04 82.17327 81.96828 81.39145
Nanofluid Average heat transfer coefficient Al2O3-water ℎV= 15.307 8 2 + 143.24 8 + 76.42 Fe3O4-water ℎV = -30.736 8 2 + 139.87 8 + 76.42 TiO2-water ℎV = -19.521 8 2 + 125.02 8 + 76.42
Figure 16. The effect of adding nanoparticles on the average heat transfer coefficient
300 302 304 306 308 310
0,017 0,022 0,027
76 78 80 82 84
0 0,005 0,01 0,015 0,02 0,025 0,03 0,035 0,04
ℎ̅[w/m.k]
8
Al2O3 Fe3O4 TiO2
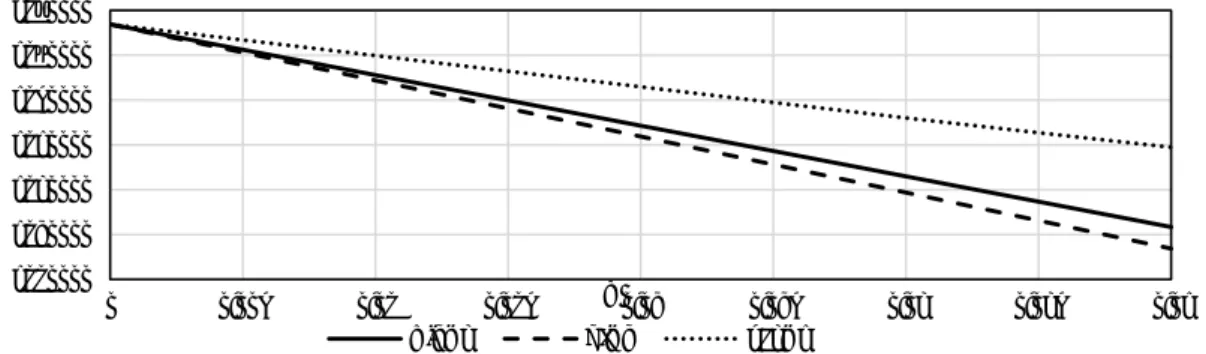
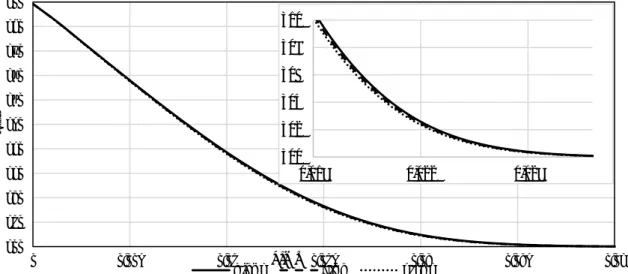
A polynomial best fit curve has been founded (see Table 8). The increase in the thermal conductivity has played an important role in the enhancement of the heat transfer between the working fluid, and the heated surface. The average heat transfer along the plate is presented in Figure 17. For Al2O3-water nanofluid with 8 =0.04. The result shows that additional loading of nanoparticles enhances the heat transfer. The comparison of different nanofluids is plotted in Figure 18.
Figure 17. The average heat transfer along the plate (Al2O3-water case)
Figure 18. Comparison of average heat transfer along the plate for water based nanofluids with different nanoparticles (8 =0.04)
7. Conclusion
In this paper, the laminar flow above a steady flat surface for three different types of nanoparticles has been investigated. Water was the base fluid. The problem is modelled and solved using CFD method.
The following main results are founded:
· The velocity of the Fe3O4-containing nanofluid for each 8 is greater than that of the other oxide- containing nanofluid. The increase of volume fraction causes an increase in velocity and decrease in the boundary layer thickness.
0 200 400 600 800 1000 1200 1400
0 0,1 0,2 0,3 0,4 0,5 0,6 0,7 0,8 0,9 1
ℎ[w/m.k]
x[m]
Water 0.01 0.02 0.03 0.04
0 200 400 600 800 1000 1200 1400 1600
0 0,1 0,2 0,3 0,4 0,5 0,6 0,7 0,8 0,9 1
ℎ[w/m.k]
Al2O3 x[m] Fe3O4 TiO2
1000 1050 1100 1150 1200
0 0,002 0,004 0,006 0,008 0,01
0 200 400 600 800 1000 1200 1400 1600
0 0,002 0,004 0,006 0,008 0,01
8=0, 0.01,0.02,0.03,0.04
· Temperature of Al2O3- water is higher in the boundary layer than for TiO2 or Fe3O4. Increasing the volume fraction shows an increase in the temperature profile, and the thermal boundary layer thickness increased as the volume fraction 8 is increased.
· The wall shear stress and skin friction coefficient increase with increasing 8. A polynomial connection can be given to predict the increase of these properties for all three nanofluids in volume concentration range 0 to 4 %.
· The type of the nanoparticle is a key factor for the heat transfer enhancement. Each nanoparticle shows different impact on the heat transfer enhancement, the average heat transfer coefficient is higher for Al2O3, then for Fe3O4, or TiO2. This growth property was characterized by giving polynomial relations.
Acknowledgment:
The described study was carried out as part of the EFOP-3.6.1-16-2016-00011 Younger and Renewing University – Innovative Knowledge City – institutional development of the University of Miskolc aiming at intelligent specialisation project implemented in the framework of the Széchenyi 2020 program. The realization of this project is supported by the European Union, co-financed by the European Social Fund. The second author was supported by project no. 129257 implemented with the support provided from the National Research, Development and Innovation Fund of Hungary, financed under the K_18 funding scheme.
References
[1] Hussein A M Bakar R A Kadirgama K and Sharma K V 2013 IJAME 7 850 [2] Devi S P A and Andrews J 2011 Int. J. of Appl. Math and Mech 7 52 [3] Choi S U S and Eastman J A 1995 ASME 38 31
[4] Anuar N S and Bachok N 2016 EIJST 5 65
[5] Lee S Choi S U S Li U and Eastman J A 1999 ASME 121 280
[6] Khanafer K Vafai K and Lightstone M 2003 Int. J. Heat Mass Transf. 46 3639
[7] Congedo P M Collura S and Congedo P M 2008 Proc.Int.Conf. ASME 156289 (Florida USA) p1.
[8] Bianco V Nardini S and Manca O 2011 Nanoscale Res. Lett. 6 252
[9] Yacob N A Ishak A Pop I and Vajravelu K 2011 Nanoscale Res. Lett. 6 314 [10] Bianco V Chiacchio F Manca O and Nardini S 2009 Appl. Therm. Eng.29 3632 [11] Arifin N M Nazar R and Pop I 2013 J. Appl. Math. 2013 8
[12] Mahbubul I M Saidur R and Amalina M A 2012 Int. J. Heat Mass Transf. 55 874 [13] Abu-Nada E 2008 Int. J. Heat Fluid Flow 29 242
[14] Khanafer K and Vafai K 2011 Int. J. Heat Mass Transf. 54 4410 [15] Xuan Yand Li Q 2000 Int. J. Heat Fluid Flow 21 58
[16] Kakaç S and Pramuanjaroenkij A 2009 Int. J. Heat Mass Transf. 52 3187 [17] Aziz A 2009 Commun Nonlinear Sci. Numer. Simul. 14 1064
[18] Oztop H F and Abu-Nada E 2008 Int. J. Heat Fluid Flow 29 1326 [19] Inc ANSYS 2013, ANSYS Fluent release 15 User’s Guide 15317 724
[20] Bianco V Chiacchio F Manca Oand Nardini S 2009 Appl. Therm. Eng. 29 3632 [21] Ishak A 2010 Appl. Math. Comput. 217, 837
[22] Ahmad S Rohni A M and Pop I 2011 Acta Mech. 204 195 [23] Blasius H 1908 Z. Math. Phys. 56 1