Abstract—Computation fluid dynamics (CFD) modelling of laminar heat transfer behaviour of three types of nanofluids over flat plate are studied. In the modelling the two dimensional under laminar model is used. The base fluid is pure water and the volume fraction of nanoparticles in the base fluid is 0, 1, 2, 3, and 4%. The applied Reynolds number range considered is 997.1 ≤ Re ≤ 9971. For modelling of the physical properties of the nanofluid, single phase approach is used. The effect of the volume fraction and the type of nanoparticles on the physical properties has been evaluated and presented. Then, the analysis the flow behaviour of these three nanofluids is conducted by presenting the effect of increasing the nanoparticles concentration on the velocity profile, wall shear stress, skin friction coefficient, and average heat transfer coefficient. The results show that the type of nanoparticles is an important parameter for the heat transfer enhancement as each type has shown dissimilar behaviour in this study. Moreover, a polynomial correlation has been obtained to present the relation of the wall shear stress, skin friction coefficient and average heat transfer coefficient as a function of the volume fraction for the three nanofluids.
Keywords— CFD, heat transfer enhancement, laminar flow nanofluid, and single phase.
I. INTRODUCTION
HE traditional fluids (e.g., water, ethylene, oil etc) have limited heat transfer capabilities due to the poor thermal properties such as the thermal conductivity, which led researchers to try to overcome this barrier by improving the thermal conductivity of this fluids to have more efficient systems. The list of the industrial applications, where better generation of heat transfer fluids could be utilized, is endless for example hot rolling, drying of paper, biomedicine, food processing, nuclear reactors etc. Generally, the thermal conductivity of metal particles is higher than that of the base fluid. Therefore, many techniques have been implemented to enhance thermal performance of the traditional fluids.
One of the early methods is via suspension of nanoparticles in base fluid. Adding particles of various materials that have higher thermal conductivity than the base fluid can enhance the thermal properties [1], [2]. This method was introduced by Cho [3] he coined the term nanofluid. Nanofluids have a bigger effective thermal conductivity due to the extremely large
F. M. Klazly. He is now with the Institute of Machine and Product Design, University of Miskolc, 3515, Miskolc-Egyetemváros, Hungary (e-mail:
machhkme@uni-miskolc.hu).
S. G. Bognár. She is now with the Institute of Machine and Product Design, University of Miskolc, 3515, Miskolc-Egyetemváros, Hungary (e-mail:
v.bognar.gabriella@uni-miskolc.hu).
surface area of nanoparticles and led them to be potential candidate considering in the heat transfer media. This the thermal performance enhancement method has attracted considerable attention in wide range of industrial applications and academic field. The analysation of the thermal physical properties of nanofluids includes several parameters for instance: volume fraction, base fluid (water, oil, …), nanoparticles size and shape, and particles migration patterns, all these parameters play vital roles in the final nanofluid performance. The influence of the nanoparticles’ types on heat transfer has been studied by many researchers. Anuar studied the effect of Al2O3, Cu, and TiO2 particles for the classical Blasius problem [4]. The volume fraction has been one of the affecting parameters in nanofluids. Lee showed that the thermal conductivity has been increased linearly with the increase of volume fraction [5]. Khanafer developed a 2D model to study the heat transfer performance of nanofluids inside an enclosure [6]. In [7], Congedo investigated the natural convection flow for Al2O3-water nanofluid. The determination of the solution to the nanofluid problems has been performed by different methods. In the literature, authors have used single phase approach in various geometries such as flat plate, wedge, square channel, circular tube and flow over cylinder [8-15]. These studies highlight the enhancement of the heat transfer in the presence of nanoparticles in the base fluid.
After an intensive investigation made in the literature, no simulation results on the fundamental flow characteristics have been found concerning the flow of nanofluid flow over flat plate for Al2O3, TiO2 and Fe3O4, which is the goal of this work.
In the present study we numerically investigate the characteristics of the thermal and hydrodynamic flow of nanofluid passed over flat plate for three types of nanoparticles (Al2O3, TiO2 and Fe3O4) and volume fractions (0.01, 0.02, 0.03, 0.04 vol %). CFD simulations are performed, the variation of the velocity and temperature is presented. The skin friction coefficient, wall shear stress, and the heat transfer coefficient in the nanofluids are calculated in comparison of the impact of the nanoparticles and particle concentrations.
CFD Study for the Flow Behaviour of Nanofluid Flow over Flat Plate
M. M. Klazly, and G. Bognár
T
II. MATHEMATICAL MODEL
A. Model Description
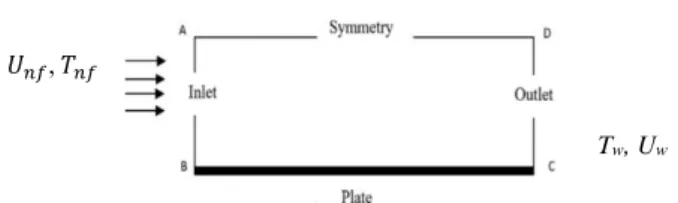
Consider the nanofluid flow in two-dimension above a steady plate. The sheet is maintained at a constant temperature Tw = 400 K (see Figure 1). In our CFD simulation, single phase approach is employed for modelling the thermal properties of nanofluid. The flow is laminar and steady-state. Considering a Cartesian coordinate system (x,y) for two-dimensional flow of a nanofluid over flat plate, where x is the coordinate measured along the plate and y is normal to it. The fluid flows on the top surface with constant velocity 0.01 m/s and the temperature outside the thermal boundary layer is = 300 K.
B. Governing equations
The basic equations that describe the mass, momentum and energy in the fluid flow can be written in vectoral form as:
conservation of mass:
. 0, (1)
conservation of momentum:
. (2)
conservation of energy:
. , (3) where the following notations are used:
V: the velocity vector,
: the temperature of the nanofluid, : the pressure of the nanofluid,
: the dynamic viscosity of the nanofluid, : the density of the nanofluid,
: thermal diffusivity of the nanofluid.
C. Physical Properties of the Nanofluid
Here the physical properties of the nanofluid are given with the dimensionless nanoparticle concentration as follows:
a) Viscosity
Here, is the viscosity, is the viscosity of the base fluid (water), and denotes nanoparticle volume fraction as Brinkman [16], [17]:
.. (4) b) Density and heat capacity
The effective density of the nanofluid is given by [18]:
1 , (5)
where and denote the density base fluid, and nanoparticles, respectively, and the heat capacity of the nanofluid is assumed as below[19]:
. (6) c) Thermal conductivity
In our calculations, denotes the thermal conductivity of nanofluid, the thermal conductivity of base fluid, the thermal conductivity of the particles given as follows [20], [21]:
. (7)
III. THE EFFECT OF THE NANOPARTICLES ON THE FLUID PROPERTIES
The effect of adding different nanoparticles on the physical properties are studied by calculating the numerical values of the physical parameters for Al2O3, TiO2, and Fe3O4. Moreover, we analyse the effect of the volume fraction from 1 to 4 % on the thermo-physical properties of the base fluid for all three nanofluids. Table 1 shows the thermo-physical properties for water, Al2O3, Fe3O4, and TiO2 particles [22], [26]. The three types of nanoparticles have different density, viscosity, thermal capacity and thermal conductivity (see Table 1). The highest density is for Fe3O4. The highest thermal capacity and thermal conductivity are Al2O3. The thermal conductivity and thermal capacity are almost the same for Fe3O4, and TiO2.
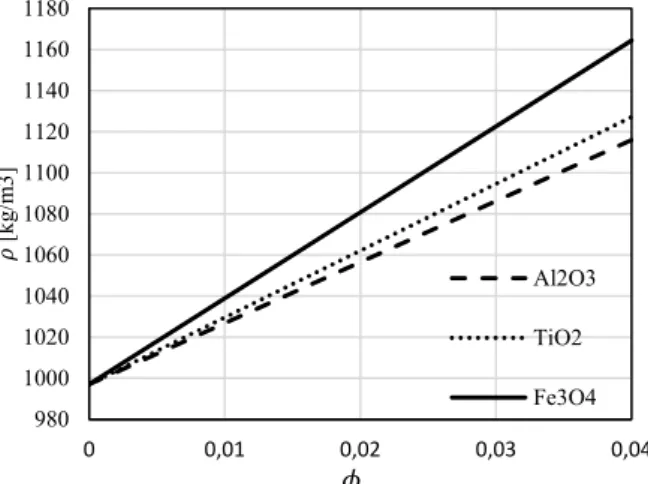
The effect of volume fraction on density for Al2O3, TiO2,and Fe3O4 water nanofluids is depicted in Figure 2. When volume fraction increases, density of all three types of nanofluids increases and the increase is more for Fe3O4-water nanofluid than the TiO2-water, and Al2O3-water nanofluids. The lowest nanofluid density was noted in Al2O3-water due to the low density of the alumina particles comparing to the other additives.
The result of increasing the quantity of nanoparticles in base fluid on the thermal capacity on the base of equation (6) is plotted in Figure 3. It shows a decrease in the thermal capacity with increasing the value of . The comparison between the three nanofluid mixtures showed that the fluid with the highest thermal capacity is Al2O3 with base water. That variation of the thermal capacity is influenced by the value of the density and the thermal capacity of the nanoparticles.
Figure 4 shows the impact of increasing on the viscosity of the nanofluid. Applying the viscosity equation (4) (Brinkman formula), it can be seen that the viscosity is only influenced by parameter , and not sensitive to the type of nanoparticles. The three nanoparticles show the same effect on the viscosity, which is increasing when the concentration has increased. The influence of increasing the concentration of nanoparticles on the thermal conductivity of the nanofluid are plotted in Figure 5. The thermal conductivity (7) increases with increasing the value of . Al2O3-water nanofluid has the highest thermal conductivity followed by Fe3O4, and TiO2 respectively. Figure 6 presents the effect of on ). It is noted that the highest values are obtained for Fe3O4.
Figure 1. The flow configuration
Tw, Uw
,
Table 1. The thermo-physical properties of water, Al2O3, TiO2, and Fe3O4 particles
Parameter Fe3O4 TiO2 Al2O3 H2O
/ 5180 4250 3970 997.1
/ . 670 686.2 765 4179
kw/m. K 9.7 8.9538 40 0.613
μ Pa. s - - - 0.001
IV. CFD PROCEDURE
In this section we introduce how the CFD simulations has been performed for the nanofluid flow (see Fig. 1).
A. Numerical Procedure
The fluid flows above a flat plate with constant velocity 0.01
980 1000 1020 1040 1060 1080 1100 1120 1140 1160 1180
0 0,01 0,02 0,03 0,04
[kg/m3]
Al2O3 TiO2
Fe3O4 0,6
0,61 0,62 0,63 0,64 0,65 0,66 0,67 0,68 0,69
0 0,02 0,04
k[w/m.K]
Al2O3 TiO2 Fe3O4
Figure 6. The effect of nanoparticles on the thermal conductivity
0,00098 0,001 0,00102 0,00104 0,00106 0,00108 0,0011 0,00112
0 0,01 0,02 0,03 0,04
[Pa.s]
Figure 4. The effect of nanoparticles on the viscosity 3500
3600 3700 3800 3900 4000 4100 4200 4300
0 0,01 0,02 0,03 0,04
Cp
Al2O3 TiO2 Fe3O4
Figure 2. The effect of nanoparticles on the thermal capacity Figure 2. The effect of nanoparticles on the density
4110000 4120000 4130000 4140000 4150000 4160000 4170000
0 0,02 0,04
Al2O3 TiO2 Fe3O4
Figure 5. The effect of nanoparticles on
m/s at temperature 300 K, the horizontal plate is stationary with no slip condition and with fluid temperature 400 K. The equations (1)-(3) of continuity, momentum, and energy are discretized and solved using ANSYS 18. For the computational domain and mesh, the computational domain geometry was generated using Design Modeler and grid are generated using ANSYS Fluent mesh. The pre-processing module for the Fluent software is given in [23]. The CFD domain consists of inlet and outlet, which have been divided by the number of division type with 100 divisions, the behaviour is set to hard with bias factor 40 to increase the number of subdomains near to the plate and to increase the preciseness near the wall [28], [29]. The sides AD and BC are symmetry and wall, respectively. Both are divided using the same method with 200 divisions. The mesh generation sensitivity has been considered in part 4.2. The boundary conditions have been set up as shown in Table 2.
Laminar model is used with pressure-velocity coupling. The relaxation factor is 1 for density, body force and energy, the thermophysical properties of nanofluids including: density, thermal conductivity, viscosity, and thermal capacity are calculated using single phase approach as it is extensively used in the literature [9], [24], [25]. This approach assumes that the mixture is homogenous, and the presence of the nanoparticles is present by modifying the physical properties of the mixture fluid. The following assumptions are applied: there is no difference between the velocity of the fluid and particles, and both of them in thermal equilibrium [8]. These assumptions have been applied in calculating the effect of adding nanoparticles to the water in the CFD simulation.
Table 2. The boundary conditions
AB Velocity inlet
BC Wall
CD Outlet
AD Symmetry
B. Grid Independency
The grid independence test is made to ensure the obtained solution is mesh independent because the accuracy of the finite volume methods is directly related to the quality of the discretization used. Therefore, a comprehensive mesh sensitivity study has been done to minimize the numerical influences introduced by the size of the meshes. The simulations are first performed for the different meshes with various number of cells (see Table 3) in process called mesh refinement, where the mesh has been improved in each mesh refinement process. The analysis of the mesh sensitivity has been done for five meshes and we compared the average Nusselt number on the plate for each mesh. The results are presented in Table 3. It can be seen that the Nusselt number for the mesh 4 with 20.000 cells found to be satisfactory to ensure the accuracy of the solution as well as the independency of the grid.
Table 3. The grid independency examination
Mesh Number of cells Average Nusselt number
Average heat transfer coefficient
1 7000 121.162 74.2728
2 9600 123.036 75.4210
3 14400 124.041 76.0376
4 20000 124.662 76.4165
5 26400 124.580 76.3678
V. COMPARISON OF THE ANALYTICAL RESULTS WITH CFD
RESULTS
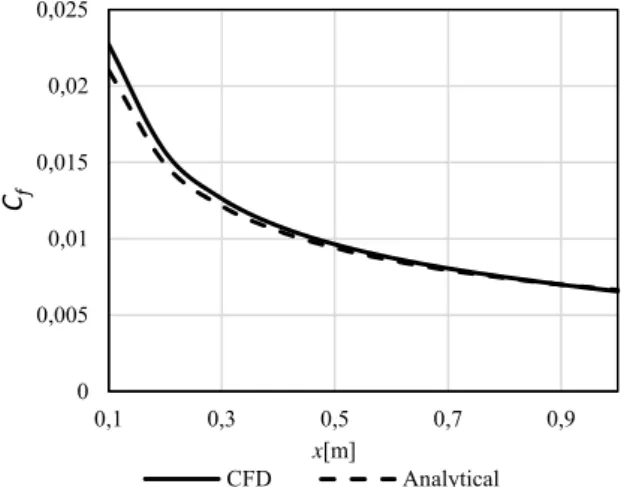
The comparison of the CFD solution and analytical solution is used for validation, which distilled pure water as working fluid. To validate the accuracy and reliability of the present CFD simulation, the calculated results are compared with analytical solution [27], for local Nusselt number along the plate, skin friction, and average heat transfer coefficient. The comparison of the local skin friction coefficient between the analytical and CFD simulation is presented in Figure 7. The CFD result showed a good agreement with the analytical solution with difference 2.426% for the skin friction coefficient in the range ∈ 0.1,1 . The comparison of the average heat transfer given in Table 4 shows a maximum 0.838% difference between the two solutions. The comparison of the local Nusselt number are plotted in Figure 8 with maximal difference 7.5 %.
Table 4. Average heat transfer coefficient comparison (water)
Method CFD Analytical Difference %
76.42085 77.0670 0.838
0 0,005 0,01 0,015 0,02 0,025
0,1 0,3 0,5 0,7 0,9
Cf
x[m]
CFD Analytical
Figure 3. Comparison of skin frictions (water)
VI. RESULTS
A. The effect of nanoparticle’s concentration on the wall shear stress (Al2O3-water)
Figure 9 is plotted for exhibiting the variation of the wall shear stress with the volume fraction for Al2O3-water nanofluid. It can be observed that the value of the wall shear stress has increased as the value of the nanoparticle’s concentration increased.
Figure 10 shows a polynomial increase in the wall shear stress for the three nanoparticles. This increase in the wall shear stress can be predicted using the correlations for each type of nanoparticles with volume fractions ranging from 0 to 4 % (see
Table 5). The highest increase in wall shear stress is observed for Fe3O4-water nanofluid, while the increase was slightly higher for TiO2 than for Al2O3. The effect of the value showed the same effect on the skin friction coefficient, and the effect is presented in Fig. 11. The increasing tendency of the skin friction coefficient can be predicted from correlations given in Table 6 for the nanofluids.
Table 5. The description of the wall shear stress with ϕ (R²=1)
Table 6.The connection of the skin friction coefficient with (R²=1) Nanofluid Skin friction coefficient
Fe3O4-water = 0.6836 2 + 0.6908 + 0.225 TiO2-water = 0.8300 2 + 0.6150 + 0.225 Al2O3-water = 0.7114 2 + 0.5984 + 0.225
Nanofluid Wall shear stress
Al2O3-water w = 0.0431 2+0.0367 + 0.01378 Fe3O4-water w = 0.0420 2+ 0.0423 + 0.01378 TiO2-water w= 0.0511 2+ 0.03765 + 0.01378
0 10 20 30 40 50 60 70 80 90 100
0,1 0,3 0,5 0,7 0,9
x[m]
CFD analytical
Figure 4. Comparison of the local Nusselt number’s for water
0 0,002 0,004 0,006 0,008 0,01 0,012 0,014 0,016 0,018
0 0,2 0,4 0,6 0,8 1
w[Pa]
Water x[m]0.01 0.02
0.03 0.04
Figure 5. The effect of Al2O3 nanoparticles on the wall shear stress
0,002 0,003 0,004 0,005 0,006 0,007 0,008
0,01 0,015 0,02
=0, 0.01,0.02,0.03,0.04
0,0136 0,0138 0,014 0,0142 0,0144 0,0146 0,0148 0,015 0,0152 0,0154 0,0156 0,0158
0 0,01 0,02 0,03 0,04
w[Pa]
Al2O3 Fe3O2 TiO2
Figure 6. The wall shear stress vs volume fraction at x=0
Figure 7. The effect of on the skin friction coefficient 0,22
0,225 0,23 0,235 0,24 0,245 0,25 0,255 0,26
0 0,01 0,02 0,03 0,04
Cf
Fe3O4 TiO2 Al2O3
B. The effect of the volume concentration on the velocity profile (Al2O3-water)
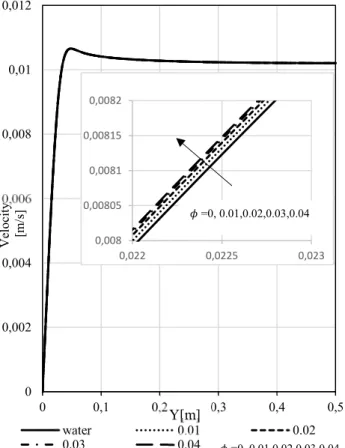
Figure 12 presents the effect of the volume fraction on the velocity profile for Al2O3-water nanofluid at different values of . It can be seen that the velocity increase and boundary layer thickness decrease with the increase of the volume fraction.
The comparison of the velocity profiles for the three different nanofluids with 4 % volume fraction are plotted in the Figure 13. It can be noted that Fe3O4 has the thinnest boundary layer, and the boundary layer of the Al2O3 is the thickest among the nanofluids, while for the TiO2 it was slightly thinner than the boundary layer of Al2O3. The decrease in velocity can be referred to the density of the nanoparticles, since the viscosity is influenced only by the value of , and not by the type of the nanoparticles.
Figure12. The velocity profile for different nanofluids for ϕ =0.04
C. The effect of nanoparticles on the temperature distribution Figure 14 presents the effect of nanoparticle’s volume fraction on the temperature profile for Al2O3-water. It can be concluded that the increase in volume fraction increases the temperature.
Figure 13. The effect of nanoparticles on the velocity profiles (Al2O3-
water case)
The thermal boundary layer increases as the volume fraction increases due to higher resistance between the fluid and the wall and higher thermal conductivity of the mixture. Comparison of the temperature profiles for the three nanofluids at =0.04 shows that Al2O3-waterhas the thickest thermal boundary layer followed by TiO2-water and Fe3O4-water, respectively. The result of comparing the thermal boundary layers for the three mixtures is presented in Figure 15.
D. The effect of nanoparticles on the average heat transfer coefficient
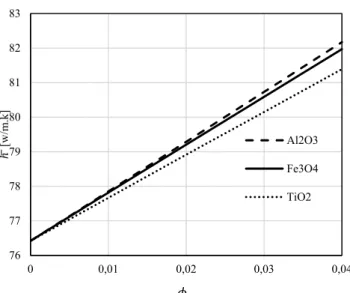
Figure 16 illustrates the impact of adding nanoparticles on the average heat transfer of the mixture. It can be observed that the value of volume fraction has influenced the heat transfer rate positively, the value of the heat transfer coefficient increased with increasing the value of the volume fraction.
0 0,002 0,004 0,006 0,008 0,01 0,012
0 0,1 0,2 0,3 0,4 0,5
Velocity [m/s]
Fe3O4 Y[m]TiO2 Al2O3
0 0,002 0,004 0,006 0,008 0,01 0,012
0 0,1 0,2 0,3 0,4 0,5
Velocity [m/s]
Y[m]
water 0.01 0.02
0.03 0.04 =0, 0.01,0.02,0.03,0.04
0,008 0,00805 0,0081 0,00815 0,0082
0,022 0,0225 0,023
=0, 0.01,0.02,0.03,0.04
Figure 8. The temperature profiles for different value of , (Al2O3 - water)
Figure 9. Comparison of the temperature for water based nanofluids with different nanoparticles ( =0.04)
A comparison among Al2O3, Fe3O4, and TiO2 with different concentrations is presented in Table 7. Each nanoparticle has enhanced the heat transfer, while the highest enhancement is obtained for the Al2O3.
Table 7. The average heat transfer coefficient for different particles and different volume fraction
Al2O3-water Fe3O4-water TiO2-water
0 76.42085 76.42085 76.42085
0.01 77.85308 77.81988 77.66741
0.02 79.29031 79.20593 78.91704
0.03 80.73311 80.58955 80.15044
0.04 82.17327 81.96828 81.39145
Table 8.Average heat transfer coefficient (R²=1) Nanofluid Average heat transfer coefficient Al2O3-water = 15.307 2 + 143.24 + 76.42 Fe3O4-water = -30.736 2 + 139.87 + 76.42 TiO2-water = -19.521 2 + 125.02 + 76.42
A polynomial best fit curve has been founded to provide the average heat transfer with (see Table 8). The increase in the thermal conductivity has played an important role in the enhancement of the heat transfer between the working fluid and the heated surface. The average heat transfer along the plate is presented in Figure 17 for Al2O3-water nanofluid with =0.04.
The result shows that additional loading of nanoparticles enhances the heat transfer. The comparison of different nanofluids is plotted in Figure 18.
The average heat transfer coefficient for different concentrations and Reynolds number is reported in Figure 19.
It is noted that an increase in the value of the volume fraction has useful contribution to the heat transfer. Our result shows the impact of adding nanoparticles in comparison to the case of the base fluid. The heat transfer increases with increasing volume concentration. The heat transfer rates are identified for each concentration at the different Reynolds numbers. The increase of the heat transfer is due to the improved thermophysical properties of the tested nanoparticles comparing the base fluid Accordingly, a nanofluid with higher thermal conductivity increases the heat transfer for all Reynolds numbers.
300 310 320 330 340 350 360 370 380 390 400
0 0,01 0,02 0,03
T[K]
Water Y[m]0.01 0.02
0.03 0.04
=0, 0.01,0.02,0.03,0.04
300 301 302 303 304 305 306 307 308 309 310
0,017 0,022 0,027
T[K]
Y[m]
Al2O3 TiO2 Fe3O4
76 77 78 79 80 81 82 83
0 0,01 0,02 0,03 0,04
̅[w/m.k]
Al2O3 Fe3O4 TiO2
Figure 10. The effect of adding nanoparticles on the average heat transfer coefficient
300 302 304 306 308 310
0,015 0,025
VII. CONCLUSION
In this paper, the laminar flow above a steady flat surface for three different types of nanoparticles has been investigated. The base fluid was water. The problem is modelled and solved using CFD method. The following main results are founded:
The velocity of the Fe3O4-water nanofluid for each is greater than that of the other oxide-containing nanofluid. The increase of volume fraction causes an increase in velocity and decrease in the boundary layer thickness.
Temperature of Al2O3- water is higher in the boundary layer than for TiO2 or Fe3O4. Increasing the volume fraction shows an increase in the temperature profile and the thermal boundary layer thickness increase as the volume fraction is increased.
The wall shear stress and skin friction coefficient increase with increasing . Polynomial connections are given to predict the increase of these properties for all three nanofluids in volume concentration range 0 to 4 %.
The type of the nanoparticle is a key factor for the heat transfer enhancement. Each nanoparticle shows different impact on the heat transfer enhancement, the average heat transfer coefficient is higher for Al2O3, than for Fe3O4, or TiO2. This growth property was characterized by giving polynomial relations.
ACKNOWLEDGMENT
This work was supported by Project No. 129257 implemented with the support provided from the National Research, Development and Innovation Fund of Hungary, financed under the K_18 funding scheme and GINOP-2.3.4-15-2016-00004 project, aimed to promote the cooperation between the higher education and the industry supported by the European Union and the Hungarian State, co-financed by the European Regional Development Fund.
0 200 400 600 800 1000 1200 1400
0 0,2 0,4 0,6 0,8 1
[w/m.K]
x[m]
Water 0.01 0.02
0.03 0.04
Figure 17. The average heat transfer along the plate (Al2O3- water case)
0 200 400 600 800 1000 1200 1400 1600
0 0,2 0,4 0,6 0,8 1
[w/m.K]
x[m]
Al2O3 Fe3O4 TiO2
Figure 18.Comparison of average heat transfer along the plate for water based nanofluids with different nanoparticles ( =0.04)
30 40 50 60 70 80 90 100 110 120 130
900 2900 4900 6900 8900
[w/m.K]
Re
Water 0.01 0.02 0.03 0.04
Figure 11. Average heat transfer coefficient vs Re
1000 1050 1100 1150 1200
0,001 0,002 0,003 0,004 0,005
=0, 0.01,0.02,0.03,0.04
REFERENCES
[1] Adnan M. Hussein, R.A. Bakar1, K. Kadirgama and K.V. Sharma,
“Experimental Measurements of Nanofluids Thermal Properties,”
IJAME, vol. 7, no., pp. 850–863, June. 2013.
[2] S. P. A. Devi and J. Andrews, “LAMINAR BOUNDARY LAYER FLOW OF NANOFLUID OVER A FLAT PLATE,” vol. 7, no. 6, 2011, pp. 52–71.
[3] S. U. S. Choi and J. A. Eastman, “ENHANCING THERMAL CONDUCTIVITY OF FLUIDS WITH NANOPARTICLES,” 1995.
[4] N. S. Anuar and N. Bachok, “Blasius and Sakiadis Problems in Nanofluids using Buongiorno Model and Thermophysical Properties of Nanoliquids,” vol. 5, no. 4, pp. 65–81, 2016.
[5] S. Lee, “Measuring Thermal Conductivity of Fluids Containing Oxide Nanoparticles,” vol. 121, no. May 1999, 2016.
[6] K. Khanafer, K. Vafai, and M. Lightstone, “Buoyancy-driven heat transfer enhancement in a two-dimensional enclosure utilizing nanofluids,” vol. 46, pp. 3639–3653, 2003.
[7] P. M. Congedo, S. Collura, and P. M. Congedo, “HT2008-56289 MODELING AND ANALYSIS OF NATURAL CONVECTION HEAT TRANSFER IN,” pp. 1–11, 2013.
[8] V. Bianco, S. Nardini, and O. Manca, “Enhancement of heat transfer and entropy generation analysis of nanofluids turbulent convection flow in square section tubes,” pp. 1–12, 2011.
[9] N. A. Yacob, A. Ishak, I. Pop, and K. Vajravelu, “Boundary layer flow past a stretching / shrinking surface beneath an external uniform shear flow with a convective surface boundary condition in a nanofluid,” pp. 1–
7, 2011.
[10] G. Bognár, “Analytic solutions to the boundary layer problem over a stretching wall,” Computers & Mathematics with Applications vol. 61, no.8, pp. 2256-2261, 2011.
[11] G. Bognár, “Magnetohydrodynamic flow of a power-law fluid over a stretching sheet with a power-law velocity,” International Conference on Differential & Difference Equations and Applications, Springer, Cham, pp. 131-139, 2015.
[12] G. Bognár, “On similarity solutions of MHD flow over a nonlinear stretching surface in non-Newtonian power-law fluid,” Electronic Journal of Qualitative Theory of Differential Equations, vol. 2016, no. 6, pp. 1- 12, 2016.
[13] V. Bianco, F. Chiacchio, O. Manca, and S. Nardini, “Numerical investigation of nanofluids forced convection in circular tubes,” Appl.
Therm. Eng., vol. 29, no. 17–18, pp. 3632–3642, 2009.
[14] N. M. Arifin, R. Nazar, and I. Pop, “Similarity solution of Marangoni convection boundary layer flow over a flat surface in a nanofluid,” J.
Appl. Math., vol. 2013, 2013.
[15] G. Bognár, K. Hriczó, “Series solutions for Marangoni convection on a vertical surface,” Mathematical Problems in Engineering, Vol. 2012, 2012, 314989.
[16] I. M. Mahbubul, R. Saidur, and M. A. Amalina, “Latest developments on the viscosity of nanofluids,” Int. J. Heat Mass Transf., vol. 55, no. 4, pp.
874–885, 2012.
[17] E. Abu-Nada, “Application of nanofluids for heat transfer enhancement of separated flows encountered in a backward facing step,” Int. J. Heat Fluid Flow, vol. 29, no. 1, pp. 242–249, 2008.
[18] K. Khanafer and K. Vafai, “International Journal of Heat and Mass Transfer A critical synthesis of thermophysical characteristics of nanofluids,” Int. J. Heat Mass Transf., vol. 54, no. 19–20, pp. 4410–4428, 2011.
[19] Y. Xuan and Q. Li, “Heat transfer enhancement of nanofluids,” Int. J. Heat Fluid Flow, vol. 21, no. 1, pp. 58–64, 2000.
[20] S. Kakaç and A. Pramuanjaroenkij, “Review of convective heat transfer enhancement with nanofluids,” Int. J. Heat Mass Transf., vol. 52, no. 13–
14, pp. 3187–3196, 2009.
[21] A. Aziz, “A similarity solution for laminar thermal boundary layer over a flat plate with a convective surface boundary condition,” Commun.
Nonlinear Sci. Numer. Simul., vol. 14, no. 4, pp. 1064–1068, 2009.
[22] H. F. Oztop and E. Abu-Nada, “Numerical study of natural convection in partially heated rectangular enclosures filled with nanofluids,” Int. J. Heat Fluid Flow, vol. 29, no. 5, pp. 1326–1336, 2008.
[23] Inc ANSYS, “ANSYS Fluent release 15 User’ s Guide,” vol. 15317, no.
November, pp. 724–746, 2013.
[24] V. Bianco et al., “Numerical investigation of nanofluids forced convection in circular tubes to cite this version: HAL Id: hal-00573480,”
2011.
[25] A. Ishak, “Similarity solutions for flow and heat transfer over a permeable surface with convective boundary condition,” Appl. Math.
Comput., vol. 217, no. 2, pp. 837–842, 2010.
[26] S. Ahmad, A. M. Rohni, and I. Pop, “Blasius and Sakiadis problems in nanofluids,” vol. 204, no. November 2010, pp. 195–204, 2011.
[27] Blasius, H.: Grenzschichten in Flüssigkeiten mit kleiner Reibung. Z.
Math. Phys., 56 (1908), pp. 1–37.
[28] F. Palleschi, B. Iele, M. Tamburrino. “Wave Fields and Nearshore Currents in the Coastal Region Opposite San,”. Mauro Cilento (Italy).
WSEAS Transactions on Fluid Mechanics, Vol.15, 2020, pp. 91-99.
[29] F. Gallerano, G. Cannata. “Noll’s Axioms and Formulation of the Closure Relations for the Subgrid Turbulent Tensor in Large Eddy Simulation,”
WSEAS Transactions on Fluid Mechanics, Vol. 15, 2020, pp. 85-90.
![Figure 18. Comparison of average heat transfer along the plate for water based nanofluids with different nanoparticles ( =0.04) 30405060708090100110120130 900 2900 4900 6900 8900[w/m.K]ReWater0.010.020.030.04](https://thumb-eu.123doks.com/thumbv2/9dokorg/796376.37679/8.892.79.398.159.516/figure-comparison-average-transfer-nanofluids-different-nanoparticles-rewater.webp)
