Nanoparticle enhanced LIBS spectroscopy of liquid samples by using modified surface-enhanced Raman scattering substrates
Dávid J. Palásti, Pawel Albrycht, Patrick Janovszky, Karolina Paszkowska, Zsolt Geretovszky, Gábor Galbács
PII: S0584-8547(19)30662-7
DOI:
https://doi.org/10.1016/j.sab.2020.105793Reference: SAB 105793
To appear in:
Spectrochimica Acta Part B: Atomic SpectroscopyReceived date: 18 December 2019
Revised date: 13 February 2020 Accepted date: 13 February 2020
Please cite this article as: D.J. Palásti, P. Albrycht, P. Janovszky, et al., Nanoparticle enhanced LIBS spectroscopy of liquid samples by using modified surface-enhanced Raman scattering substrates,
Spectrochimica Acta Part B: Atomic Spectroscopy(2020), https://doi.org/10.1016/j.sab.2020.105793This is a PDF file of an article that has undergone enhancements after acceptance, such as the addition of a cover page and metadata, and formatting for readability, but it is not yet the definitive version of record. This version will undergo additional copyediting, typesetting and review before it is published in its final form, but we are providing this version to give early visibility of the article. Please note that, during the production process, errors may be discovered which could affect the content, and all legal disclaimers that apply to the journal pertain.
© 2020 Published by Elsevier.
1
Nanoparticle enhanced LIBS spectroscopy of liquid samples by using modified surface-enhanced Raman scattering substrates
Dávid J. Palásti1,2,◊, Pawel Albrycht3,◊, Patrick Janovszky1,2, Karolina Paszkowska3, Zsolt Geretovszky2,4, Gábor Galbács1,2,*
1Department of Inorganic and Analytical Chemistry, University of Szeged, Dóm square 7, 6720 Szeged, Hungary
2Department of Materials Science, Interdisciplinary Excellence Centre, University of Szeged, Dugonics square 13, 6720 Szeged, Hungary
3Institute of Physical Chemistry, Polish Academy of Sciences, Kasprzaka 44/52, 01-224 Warsaw, Poland
4Department of Optics and Quantum Electronics, University of Szeged, Dóm square 9, 6720 Szeged, Hungary
Journal Pre-proof
2 Abstract: An assessment of the feasibility of using modified surface enhanced Raman scattering substrates (Ag nanoparticles on indium-tin-oxide glass) for quantitative nanoparticle-enhanced laser induced breakdown spectroscopy (NELIBS) was carried out. Substrates were prepared with different surface coverage from various nanoparticle sizes, and their laser ablation behaviour was tested in detail. It was found that use of those combinations are most beneficial in terms of the signal enhancement factor, which provide the shortest interparticle distances. With the application of 266 nm laser wavelength, long (ms-range) gate width, and optimized laser pulse energy, the best NELIBS signal enhancement was found to be about a factor of three. By using liquid sample deposition by spraying, which was found to provide an even distribution of liquid samples on the substrate surface, successful calibration for Mn, Zn and Cr was performed. The NELIBS signal repeatability from five repeated measurements was found to be comparable to that of LIBS (5-10%
RSD). These observations indicate that the NELIBS signal enhancement approach can be used in quantitative analytical applications for liquid samples, if i) the substrate fabrication procedure has good repeatability, ii) surface coverage and nanoparticle size is tightly controlled, iii) a homogenous liquid sample deposition is achieved.
Keywords: laser induced breakdown spectroscopy (LIBS), nanoparticle enhanced LIBS (NELIBS), silver nanoparticles, indium-tin-oxide (ITO) glass
◊These authors contributed equally to the present work.
*Corresponding author. E-mail: galbx@chem.u-szeged.hu
Journal Pre-proof
3 1. Introduction
Nanoparticle-enhanced laser induced breakdown spectroscopy (NELIBS), introduced by de Giacomo et al [1], is a novel, noteworthy analytical approach that promises significant, as large as 10-1000 times, signal enhancement in LIBS by employing the deposition of properly sized and distributed metallic nanoparticles (NPs) on the surface of a solid (preferentially electrically conducting) sample.
The signal enhancement achieved is mainly attributed to the locally enhanced electromagnetic field of the nanosecond laser pulse mediated by the presence of the very small radius of curvature of nanoparticles (laser-induced local plasmonic field), which results in the field emission of electrons, leading to the decrease of the laser induced breakdown threshold of the sample material. Another contributing effect to the signal enhancement is the change of the optical properties (e.g. light absorption) of the sample surface [2].
In later years, the NELIBS approach has been studied in detail by the inventors and other researchers (e.g. [3-11]). It was shown, that the metal the NPs are made of, the surface concentration, as well as the laser wavelength and irradiance all have a great impact on the signal enhancement achievable [3]. Apart from NPs, thin metallic gold films were also found to be useful for the enhancement of LIBS emission signals of solid samples [9, 10]. Plasma diagnostic studies on NELIB plasmas also revealed that the excitation temperature and the total number density of light emitting analyte species in the plasma are only larger than in LIB plasmas in the early stage of plasma development (e.g. with gating at 800 ns delay and sub-µs width). This led to the realization that in mainstream LIBS instruments working with significantly longer gate widths (e.g. ms), only smaller signal enhancement factors can be attained [3, 5] and that the enhancement also depends on the excitation potential of the electronic transition of the element studied [2-4]. It was also demonstrated that the NELIBS analysis of liquid samples is also possible, if they are dried onto substrates formerly prepared by NP deposition [4, 6, 7] or by NP embedding [11].
Journal Pre-proof
4 Plasmonic effects generated by nanoparticles are also utilized in other fields of analytical spectroscopy [12]. A prime example is surface-enhanced Raman scattering (SERS), where surface plasmon resonance (oscillation of free electrons of the NPs resonant with the EM field of the incoming laser radiation trapped at a NP metal/dielectric interface) is used to boost the EM field experienced by organic molecules adsorbed on the substrate. The result is a huge (a factor of up to 1010) enhancement of the Raman spectrum of organic molecules, which can be efficiently used for the detection of various chemical and biological analytes [13]. SERS substrates are nowadays commercially available and contain metal (e.g. Ag, Au, Cu) nanoparticles either immobilized on a dielectric carrier or the nanostructures are fabricated directly on the carrier (by nanolithography or template based synthesis) [14, 15]. The construction of SERS substrates is hence essentially similar to that of NELIBS substrates, although there also are different requirements set up by the two spectroscopies: e.g. SERS sensitivity dictates the use of a laser frequency resonant with the surface plasmon resonance frequency of the NPs and a low enough laser irradiance to avoid surface photochemical reactions, whereas the NELIBS effect is much less sensitive to the size of nanoparticles and requires much higher irradiances sufficient to break down the sample material. A common problem that stands in the widespread, routine quantitative analytical use of both SERS and NELIBS is that robust substrates having a very even and well controlled NP surface distribution, thereby generating a reproducible signal enhancement, and a long lifetime are needed, which are not easy to fabricate. Most applications therefore focus on “qualitative detection” or “sensing” of certain analytes, instead of quantitative analysis [15, 16].
In the present study, we explored the conditions under which commercial SERS substrates could be used for the practical NELIBS analysis of liquid samples. For our experiments, we chose a relatively common SERS substrate type, Ag NPs on glass, prepared by an electrochemical procedure, which exhibits a very good SERS signal enhancement and repeatability [17]. We fabricated such substrates with various NP sizes and surface coverage and investigated their NELIBS analytical performance.
Journal Pre-proof
5 2. Experimentals
2.1. Fabrication and characterization of substrates
The research was carried out on substrates provided by SERSitive Ltd. (Warsaw, Poland). The substrates were fabricated by a proprietary electrochemical method based on the electrodeposition of Ag NPs on glass that has a thin indium-tin-oxide coating to increase electrical conductivity [18].
This method is very reliable and reproducible. Briefly, 20 mm2 one-side surface ITO glass slices (CG- 41IN, Delta Technologies Inc., USA) are placed in a vessel with an aqueous electrolyte solution containing silver nitrate and sodium sulfite in adequate concentrations. After heating to 60oC, three electrodes are placed in the electrochemical vessel and a time-varying potential was applied to the ITO-glass working electrode (triangle wave, peak-to-peak amplitude of 0.6 V, DC component of -1 V, period of 10 s). The potentiostat used (VSP, Biologic, France) has silver wire reference and platinum mesh counter electrodes. The obtained substrates with electrodeposited silver nanoparticles are then washed with high purity distilled water and allowed to dry under a dust-free environment. For the purposes of this study, the standard fabrication procedure was modified to produce Ag NPs with different mean size as well as varying substrate surface coverage. Thus, NE-LIBS dedicated substrates were prepared by varying the silver nitrate concentration in a range of 0.004 to 0.8 mmol/L, and by varying deposition times ranging from 7 minutes 30 seconds to 3 minutes 45 seconds. The Ag/ITO glass substrates were fabricated in batches containing 4-5 pieces each and a unique sample identifier was assigned to each batch. Carrier ITO glass and final NE-LIBS substrates were subjected to scanning electron microscopy (FEI Nova NanoSEM, USA) in order to analyze the size distribution of Ag NPs on the surface. Particle data were obtained by using an image processing software (ImageJ) and counting several hundred particles on each sample. Particle statistics was based on the actual area (2D projection) of the particles in the SEM images. First, the software located the boundaries of all particles and then their individual areas were converted to diameter values of circl es with an area identical to that of the particles. Particle size distribution data were also calculated from these
Journal Pre-proof
6 diameter values. Data in Table 1. and scanning electron microscopy (SEM) images in Fig 1. illustrate the attributes of the prepared substrates. Additional optical microscopic characterization of the substrates were performed by using the built-in optical system of the LIBS instrument.
Table 1. Characteristic data of the Ag/ITO substrates prepared for the NE-LIBS experiments. Values in brackets are standard deviations calculated from data for individual substrates in each sample batch.
Sample ID Mean particle diameter, nm Surface coverage, % A
B C D E F
79.2 (6.7) 53.0 (2.4) 67.5 (0.71)
71.2 (5.4) 26.2 (1.06) 10.9 (0.071)
67.3 (1.7) 45.09 (3.6) 65.9 (0.047)
62.8 (0.67) 30.2 (1.5) 2.2 (0.42)
Journal Pre-proof
7 Figure 1. Illustrative SEM images and NP particle size histograms of the Ag/ITO glass substrates
fabricated for the NELIBS experiments. From top to bottom: substrate F, E, C and B.
2.2. Liquid sample preparation
Liquid sample deposition onto the Ag/ITO substrates was carried out by using a commercial spray gun (DU-30K) equipped with a 200 µm nozzle, by using 3 bar argon gas pressure for nebulization . Spraying was executed in five repetitions, each consisting of five seconds of spraying from a distance
Journal Pre-proof
8 of 25 cm and followed by one minute of drying under an IR lamp. For the sake of good coating repeatability, a mechanical arrangement was set up with the spray gun and substrate holder in fixed positions. Droplet deposition was carried out by using an adjustable, 1-10 µL volume digital pipette (Biohit Proline Plus, Germany) All manipulations of the substrates were carried out under a vertical flow laminar cabinet (Alpine K700, Poland) providing a HEPA-filtered, dust-free environment with an efficiency of min. 99.995% MPPS (Most Penetrating Particle Size).
2.3. LIBS experiments
LIBS experiments were performed on a J-200 Tandem LA/LIBS instrument (Applied Spectra, USA) equipped with a 266 nm, 6 ns Nd:YAG laser source and a six-channel CCD spectrometer with a resolution of 0.07 nm. For every laser shot, the full LIBS spectra over the wavelength range of 190 to 1040 nm were recorded in the Axiom data acquisition software, using a 1 µs gate delay and 1 ms gate width. During the experiments, a 150 µm laser spot size was maintained (which is the maximum spot size applicable in our instrument, but is also a realistic spot size for LIBS analysis) and the pulse energy was varied between 2 and 8 mJ, which corresponds to irradiances of 2.2 to 9·109 W·cm-2, a range similar to the one used by the de Giacomo group (1-10 GW·cm-2) [3,4]. Intensities of the following spectral lines were monitored: Si I 251.56 nm, Sn I 284.00 nm, Ag I 328.07 nm, In I 451.28 nm, Zn I 481.00 nm, Mn I 482.35 nm, Cr I 541.00 nm. Prior to LIBS experiments, all Ag/ITO substrates were affixed to microscope slides in order to facilitate their handling.
2.4. Materials and methods
Calibration standard solutions were prepared by using analytical purity sulfate salts of the measured elements (Zn, Mn and Cr) and ultra-pure trace quality labwater dispensed from an Elix 10/Synergy
Journal Pre-proof
9 water purification system (Merck/Millipore, USA). The solutions were stored in polypropylene containers (Gima, Italy) cleaned previously with trace analytical quality acids.
Data processing was carried out in Clarity 18.0 (Applied Spectra, USA), OriginPro 8.5 (OriginLab, USA). Substrate SEM images were processed in the ImageJ software, after converting them to the black and white color space. Particle boundaries were detected and the area of each particle (2D projection) was calculated by the software. Individual particle areas were then converted to diameter values assuming a spherical shape. Mean particle diameter data were then obtained as the modus of the particle size histograms. Surface coverage values were calculated by comparing the sum of area of all detected particles in each SEM image to the total area of the image. On each substrate, several SEM measurements (on various locations) and image evaluations were carried out, during which thousands of particles were counted in every image.
3. Results and discussion
3.1. Signal enhancement on Ag/ITO substrates
The signal enhancement provided by the presence of the Ag NPs was calculated by ratioing the net In I 451.28 nm emission signal of the ITO substrate to that from a pristine (free from Ag NPs) ITO glass sample used for substrate preparation. Prior to these experiments, the laser irradiance was optimized by monitoring the Si I 251.56 nm emission line from the glass carrier in order to ensure that only the ITO layer (150-200 nm thickness) is ablated. This optimization yielded a 2.2 · 109 W·cm-2 value.
Five repetitive measurements on different spots of the same substrate were carried out. By referencing the observed signal enhancement to the Ag NP diameter and the surface coverage, it was revealed that the increase of both variables has a positive effect on the signal (Fig 2.). At the top of the studied range, a modest, but well reproducible 3x signal enhancement (SE) could be realized.
Journal Pre-proof
10 Figure 2. Signal enhancement (calculated for the In I 451.28 nm emission line) as a function of Ag NP size and
surface coverage on the Ag/ITO substrates. Vertical error bars are standard deviations calculated from five repeated measurements. The trend line plotted only meant to aid the eye.
We would like to stress that the direct comparison of SE factors with lite rature data is not easy, because there is a great variation in the experimental conditions used in studies, also for variables that have a complex but significant effect according to the NELIBS literature. Among these experimental variables are the laser wavelength (SE changes in the UV < Vis < NIR order), the laser irradiance (SE follows a maximum curve), surface mass concentration of NPs (SE follows a maximum curve, the optimum also depends on NP size), interparticle distance (SE decreases monotonously with an increase of the interparticle distance), the chemical composition and shape of NPs (e.g. Au and Ag NPs with jagged edges give highest SE factors), the electrically conducting and insulating character of the substrate (conductive substrates. e.g. metals, tend to produce much higher SE), etc.
In addition to these, optical conditions also influence SE factors; the gate delay and width of data acquisition, as well as the excitation potential for the transition of the elements measured. These variables were concisely reviewed by de Giacomo et al. [2-4]. In view of the conditions used in our experiments (266 nm laser wavelength as opposed to a NIR one, a very thin semiconducting ITO layer as carrier material instead of a thick metallic material, ms-range gate width versus µs-range values, etc.), the achieved magnitude of signal enhancement is reasonable for a routine LIBS instrument, and is also similar to values reported in other NELIBS studies for Ag NPs (e.g. [ 2,7]). Please also note that
Journal Pre-proof
11 the signal enhancement, with respect to a pristine ITO glass sample, achieved here can be indeed directly attributed to the plasmonic effects induced by the presence of Ag NPs, as the ITO glass itself already has a strong absorption at the 266 nm laser wavelength used, so the NPs do not simply modify the optical characteristics of the solid. Further improvement in SE can probably be achieved, for a given NP diameter, if the laser wavelength is tuned to the plasmonic absorption peak of the Ag NPs.
One of the experimental conditions considered to be important in NELIBS is the interparticle distance of NPs. Here, it is also possible to obtain a coarse estimate for the interparticle distance of Ag NPs on our substrates by using simple geometric deliberations. Denoting the surface coverage with , the mean particle diameter by D, and the number of particles on a hypothetical unit surface area (1000 nm x 1000 nm) by N, we can write that
106∙ 𝜂 = 𝑁 ∙ (𝐷 2)2∙ 𝜋
as an approximation of the surface area that is covered by spherical NPs assumed to be distributed evenly in a rectangular pattern on the surface that fits just inside the hypothetical 1000 nm x 1000 nm area. We can express the number of rows (and columns) of NPs as the square root of N, which is n
𝑛 =2 ∙ 103 𝐷 ∙ √𝜂
𝜋
From this it follows that
1000 = 𝑛 ∙ 𝐷 + (𝑛 − 1) ∙ 𝑑
where d is the mean interparticle distance in nm units. This gives the formula
𝑑 =1000 − 𝑛 ∙ 𝐷
𝑛 − 1 = 1 − 2 ∙ √𝜂 𝜋 𝐷 ∙2 √𝜂𝜋 − 1
1000
Journal Pre-proof
12 Plotting d against and D produces curves (see Fig 3.) that show a monotonous decrease as a function of both variables. Considering that the electromagnetic field enhancement theory states that the enhancement monotonously increases with the decreasing interparticle distance (e.g. [ 19]), the trend depicted in Fig 3. is in good agreement with the theory (cfr. Fig. 2). For example, Fig 2.
shows that the increase of surface coverage increases the signal enhancement, whereas Fig 3.
illustrates that an increase of surface coverage decreases the interparticle distance. This further emphasizes the importance of d in NELIBS as well, in accordance with experimental observations (e.g. [4]).
Figure 3. Interparticle distance calculated as a function of the particle diameter and surface coverage calculated for the Ag/ITO substrates used in the present study. The trend line plotted only meant to aid the eye.
Finally, we would also like to point out to the small signal variation, only a few percents, observed (cf. Fig 2.). This is very important for quantitative analytical applications, where accuracy and precision are directly affected by signal repeatability. The good signal stability achieved here is due to an intended combination of two experimental conditions. One of these is the highly even and reproducible distribution of the Ag NPs on the surface of our substrates, the result of the application of a patented electrochemical synthesis procedure [18]. These features are very difficult to achieve by using simple substrate preparation approaches like the deposition and drying of a droplet of nanodispersion onto the subtrate, as promoted in several NELIBS studies (e.g. [2-4]). In our
Journal Pre-proof
13 experience, this simplified preparation approach often produces an uneven distribution and aggregation of NPs even in cases when stabilized commercial nanodispersions are employed. We believe that this obstacle is also one of the main reasons as to why many NELIBS studies give only a qualitative demonstration of the signal enhancement, but do not attempt a quantitative application or calibration. The other beneficial experimental condition is the use of a relatively large laser spot size (150 µm) that helps to cover more NPs, thereby averaging the enhancement effect in the interaction region, especially considering the hot spots existing in the interparticle gaps, that tend to produce multiple, nanometer sized ablation craters [20].
3.2. Characterization of the laser ablation behaviour of substrates
In view of later liquid sample analysis, the spectral background produced by the elemental composition of the top layer of the substrate was investigated. According to the expectations, peaks from Ag, In and Sn (plus Na) are observable in the background LIBS spectra (Fig 4.). The most dominant peaks are produced by silver; although single particles with a diameter of a couple of tens of nm are not directly detectable LIBS measurements, but the cumulative amount of material present in the thousands of NPs in the focal spot of the laser beam is more than adequate for detection. The substrate spectral background is therefore not completely still, but the situation is not worse than in any samples which have these three elements in their matrix (only ca. 2.5% of the spectrum is covered by background peaks). Analytical measurements can be planned for the open spectral windows, mainly in the following ranges: 190-230 nm, 340-375 nm, 385-405 nm, 415-450 nm, 470- 485 nm, 490-515 nm, 525-545 nm, 555-585 nm, 590-760 nm, 770-820 nm.
Journal Pre-proof
14 Figure 4. LIBS spectral background from the Ag/ITO SERS substrates,
at an irradiance of 2.2 · 109 W·cm-2.
It is well known that increasing the laser irradiance increases the ablated mass (at least up to a certain threshold and for ns laser pulses [21]) and therefore the LIBS analytical signal. As in an analytical NELIBS application for liquid samples the sample residues would be adsorbed on the surface of the substrate (Ag NPs), therefore a high enough irradiance needs to be used in order to ablate all Ag NPs and sample resideues and to produce the highest analytical signal for the sample.
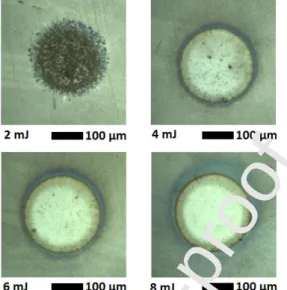
However, increasing the irradiance further would result in the ablation of the underlying glass carrier which would inadvantageously enhance the spectral background intensities from the ITO and glass layers. Because of these considerations, the ablation behaviour of the Ag/ITO substrates were studied for laser pulse energies in the 2 to 8 mJ range (2.2 to 9·109 W·cm-2 irradiances), which also within the typically used NELIBS irradience regime. As it can be seen in Fig 5., delivering a weak, 2 mJ laser pulse to the substrate produces little ablation, as there is no single ablation crater, the presence of Ag is made visible in the focal spot area. The blackening is probably due to the oxidation (and redistribution) of the Ag particles initiated by the laser plasma generated in air, with some contribution from the multi-spot, localized ablation due to plasmonic effects [20]. As the pulse energy is gradually increased, the ablation of the Ag NPs is becoming more and more extensive, and finally at 8 mJ it is completed (clear, single crater with practically no debris). Therefore it was decided that 8 mJ pulse energy is optimal for the analytical experiments.We would like to add that it seems to
Journal Pre-proof
15 be potentially feasible to use another carrier (other than ITO glass) that produces a less line -rich backround spectrum, and with such a carrier, the signal may be further increased with increasing the pulse energy (irradiance) above the value found optimal here.
Figure 5. Transmission optical microscopy images for the laser ablation of Ag/ITO substrates by using different pulse energies , but the same focal spot diameter.
3.3. Liquid sample preparation and analysis
Prior to analytical experiments with liquid samples, the liquid needs to be evenly distributed and dried onto the substrate. In a search for the suitable deposition method, we carried out tests using three different, but practical approaches: spraying, droplet placement and immersion. The panels of Fig 6. show the substrate surface after executing the deposition and drying of a 100 µg/mL multielement solution. As it can be seen, the most even distribution of residues were produced by the spraying procedure, which leaves fearly similarly sized microcrystals (10-30 µm) on the surface.
As opposed to this, the 1 µL droplet placement created a typical, ring-shaped deposit (with a mm- range diameter) on the wettable substrate surface, with only minimum deposited material in the center of the ring. The sample distribution achievable with the immersion method was also inhomogeneous, with crystalline deposits of various sizes appearing on the whole surface of the substrate.
Journal Pre-proof
16 Figure 6. Optical microscopy images of residues from liquid samples deposited and then
dried onto the substrate surface. Three deposition methods were tested: spraying (left panel), droplet placement (middle panel) and immersion (right panel).
As a test of analytical applicability of the Ag/ITO substrates, a LIBS calibration experiment was carried out. A series of standard solutions containing Zn, Mn and Cr at different concentration levels was sprayed onto specimens of substrate C (which was formerly found to produce the highest signal enhancement) and dried under an IR lamp. For comparison purproses, ITO glass substrates were also prepared with solutions the same way. LIBS measurements on these substrates were carried out in five repetitions, by delivering each 8 mJ laser pulse to different locations on the substrate at a ca.
1 mm distance (4-5 times larger than the crater diameter) from each other in order to avoid an overlap between the craters. The obtained spectra and calibration curves can be seen in Fig 7 and 8, respectively. The comparison of the two curves clearly indicate the presence of a modest, but consistent signal enhancement of a factor of 2.5-3. The repeatability of the NELIBS signals is somewhat poorer than in Fig 2., but it is still comparable to the repeatability of LIBS signals (5-10%
RSD), thus it allows analytical use. Please note that the same Ag/ITO substrates were used for the five repeated measurements in the present experiment, thus the possibility can not be excluded that some of the NPs were slightly re-arranged on the surface by the shockwaves generated by previous laser pulses, even though a safe distance was maintained between the ablation sites. This re- arrangement can influence signal repeatability, thus the use of larger surface area substrates may be useful. With the use of the Ag/ITO substrate, the detection limit also was improved by a factor comparable to the signal enhancement, giving rise to detection limits of 4.0, 2.7 and 6.6 µg/mL for
Journal Pre-proof
17 Mn, Zn and Cr, respectively (calculated according to the IUPAC three sigma methodology, using the initial sensitivity of the calibration curve), at their monitored spectral lines.
Figure 7. Comparative LIBS spectra obtained with and without the sample solution on Ag/ITO glass substrates.
Vertical scales are identical, only shifted for the sake of transparency.
Figure 8. NELIBS (on Ag/ITO substrates) and LIBS (on ITO substrates) c alibration curves for Cr, Zn and Mn elements. Error bars are standard deviations calculated from five repeated measurements.
Journal Pre-proof
18 The curvature of the calibration plots in Fig 8. is also clearly observable. In our opinion, this can be attributed to the effect of a decreasing signal enhancement with the increase of the total dissolved material content of the sample liquid. It is so because i n the liquid sample NELIBS arrangement, where the liquid sample is dried onto a solid NP-decorated substrate, the dissolved matter content of the liquid sample will form solid deposit patches on top of the NPs. The higher is the dissolved matter content the more Ag NPs will be covered by the deposits, thereby inhibiting their contribution to the signal enhancement. Thus, with the increase of the analyte concentration, the signal enhancement will become less and less effective, which produces a saturation-like, curved calibration plot. Assuming a homegenous distribution of sample deposits and Ag NPs, the curvature should be less pronounced in the low concentration range and also if the surface NP coverage is higher. It can also be expected that the deposit formation is a 2D-like process (the growth of the volume of deposits will take place primarily through a lateral expansion rather than an increase if height) due to that there are many seeds (Ag NPs) present that can induce crystallization.
Unfortunately, in a general analytical situation, when the analyte is only a trace fraction of the total dissolved matter in the solution sample, the „ballast” deposit formation will be overwhelming. This suggests that liquid NELIBS analysis should be attempted with sample solutions as dilute as it is allowed by the detection capabilities of the LIBS system.
4. Conclusions
An assessment of the feasibility of using modified Ag NPs on ITO glass type SERS substrates for nanoparticle enhanced LIBS spectroscopy was carried out. Substrates were prepared with different surface coverage from various nanoparticle sizes, and their laser ablation behaviour was tested in detail. It was found that use of those combinations are most beneficial in terms of the signal enhancement factor, which provide the shortest interparticle distances. With the application of 266 nm laser wavelength, and optimized laser pulse energy, the best NELIBS signal enhancement
Journal Pre-proof
19 found was about a factor of three. It is expected that this signal enhancement can be further improved by tuning the plasmon resonance absorption of the NPs on the substrates closer to the laser wavelength (or vice versa). The background spectrum from the Ag/ITO substrates was found to be reasonably still (contained only the expected Ag, In and Sn peaks). By using liquid sample deposition by spraying, which was found to provide an even distribution of liquid samples on the substrate surface, the NELIBS calibration for Mn, Zn and Cr was successful, with limit of detection values in the 2-6 µg/mL range (a factor of ca. 3 improvement with respect to conventional LIBS on ITO glass substrates without Ag NPs). The NELIBS signal repeatability from five repeated measurements was found to be comparable to that of LIBS (5-10% RSD). These observations indicate that the NELIBS signal enhancement approach can be used in quantitative analytical applications for liquid samples, if i) the substrate fabrication procedure has good repeatability, ii) surface coverage and nanoparticle size is tightly controlled, iii) a homogenous liquid sample deposition is achieved. It has to be added though that the experiments also shed light on some inherent practical limitations of this approach; namely that non-linear (saturation-like) calibration curves can only be obtained and that acidified sample solutions may also dissolve the silver nanoparticles responsible for the signal enhancement.
Acknowledgements
The authors are grateful for the help of Judit Kopniczky (University of Szeged, Department of Optics and Quantum Electronics) in taking additional electron microscopy images of the substrates. The financial support received from various sources including the Ministry of Innovation and Technology (through project No. TUDFO/47138-1/2019-ITM FIKP) and the National Research, Development and Innovation Office (through projects No. K_129063, EFOP-3.6.2-16-2017-00005 and GINOP-2.3.3-15- 2016-00040) of Hungary is also kindly acknowledged.
Journal Pre-proof
20 References
[1] A. De Giacomo, R. Gaudiuso, C. Koral, M. Dell’Aglio, O. De Pascale, Nanoparticles enhanced laser induced breakdown spectroscopy on metallic samples, Anal. Chem. 85 (2013) 10180-10187.
[2] A. De Giacomo, R. Gaudiuso, C. Koral, M. Dell’Aglio, O. De Pascale , Nanoparticle enhanced laser induced breakdown spectroscopy: effect of nanoparticles deposited on sample surface on laser ablation and plasma emission, Spectrochim. Acta Part B 98 (2014) 19-27.
[3] A. De Giacomo, M. Dell’Aglio, R. Gaudiuso, C. Koral, G. Valenza, Perspective on the use of nanoparticles to improve LIBS analytical performance: nanoparticle enhanced laser induced breakdown spectroscopy (NELIBS), J. Anal. At. Spectrom. 31 (2016) 1566-1573.
[4] M. Dell'Aglio, R. Alrifai, A. De Giacomo, Nanoparticle enhanced laser induced breakdown spectroscopy (NELIBS), a first review, Spectrochim. Acta Part B 148 (2018) 105-112.
[5] C. Koral, A. De Giacomo, X. Mao, V. Zorba, R.E. Russo, Nanoparticle enhanced laser induced breakdown spectroscopy for improving the detection of molecular bands, Spectrochimica Acta Part B 125 (2016) 11-17.
[6] A. De Giacomo, C. Koral, G. Valenza, R. Gaudiuso, M. Dell'Aglio, Nanoparticle enhanced laser induced breakdown spectroscopy for microdrop analysis at sub-ppm level, Anal. Chem. 88 (2016) 5251-5257.
[7] D. A. Rusac, T. P. Anthony, Z. T. Bell, A novel technique for analysis of aqueous solutions by laser- induced breakdown spectroscopy, Rev. Sci. Instrum. 86 (2015) 116106.
[8] F. Yang, L. Jiang, S. Wang, Z. Cao, L. Liu, M. Wang, Y. Lu, Emission enhancement of femtosecond laser-induced breakdown spectroscopy by combining nanoparticle and dual -pulse on crystal SiO2, Opt. Laser Technol. 93 (2017) 194-200.
Journal Pre-proof
21 [9] C. Sánchez-Aké, T. García-Fernández, J.L. Benítez, M.B. de la Mora, M. Villagrán-Muniz, Intensity enhancement of LIBS of glass by using Au thin films and nanoparticles, Spectrochim. Acta Part B 146 (2018) 77-83.
[10] J. Shen, K. Wu, D. Cao, J. Wang, B. Hu, Effect of Ag nanoclusters deposited with magnetron sputtering on laser-induced breakdown spectroscopy enhancement, Spectrochim. Acta Part B 156 (2019) 59-65.
[11] M. Dell'Aglio, Z. Salajková, A. Mallardi, R. Mezzenga, L. van't Hag, N. Cioffi, G. Palazzo, A. De Giacomo, Application of gold nanoparticles embedded in the amyloids fibrils as enhancers in the laser induced breakdown spectroscopy for the metal quantification in microdroplets, Spectrochim.
Acta Part B 155 (2019) 115-122.
[12] J. Boken, P. Khurana, S. Thatai, D. Kumar, S. Prasad, Plasmonic nanoparticles and their analytical applications: a review, Appl. Spectrosc. Rev. 52 (2017) 774-820.
[13] R. Pilot, R. Signorini, C. Durante, L. Orian, M. Bhamidipati, L. Fabris, A review on surface- enhanced Raman scattering, Biosensors 9 (2019) 57.
[14] P. Mosier-Boss, Review of SERS substrates for chemical sensing, Nanomaterials 7 (2017) 142.
[15] M.J. Banholzer, J.E. Millstone, L. Qin, C.A. Mirkin, Rationally designed nanostructures for surface- enhanced Raman spectroscopy, Chem. Soc. Rev. 37 (2008) 885–897.
[16] J. Cailletaud, C. De Bleye, E. Dumont, P.-Y. Sacré, L. Netchacovitch, Y. Gut, M. Boiret, Y.-M. Ginot, Ph. Hubert, E. Ziemons, Critical review of surface-enhanced Raman spectroscopy applications in the pharmaceutical field, J. Pharm. Biomed. Anal. 147 (2018) 458-472.
[17] https://www.sersitive.eu/
[18] Patent No. P.421072 (Poland) “Method for depositing metal nanoparticles on a surface in the electrochemical process, surface obtained by this method and its application”
Journal Pre-proof
22 [19] M.K. Kinnan, G. Chumanov, Plasmon coupling in two-dimensional arrays of silver nanoparticles, II. Effect of the particle size and interparticle distance, J. Phys. Chem. C 114 (2010) 7496-7501.
[20] F. Schertz, M. Schmelzeisen, M. Kreiter, H-J. Elmers, G. Schönhense, Field emission of electrons generated by the near field of strongly coupled plasmons, Phys. Rev. Lett. 108 (2012), 237602.
[21] X. Mao, R.E. Russo, Observation of plasma shielding by measuring transmitted and reflected laser pulse temporal profiles, Applied Physics A, 64 (1997) 1-6.
Journal Pre-proof
23 The corresponding author declares that the co-authors indicated on the manuscript have all contributed substantially to the work. All co-authors took part in the experimental planning, execution of experiments, data evaluation, preparation of tables and figure s, drafting, editing and finalization of the manuscript. In addition to these roles, the corresponding author was responsible for the coordination of the research and communications related to it.
Prof. Dr. Gábor Galbács corresponding author
Journal Pre-proof
24 Highlights:
Ag nanoparticles were deposited on ITO glass (modified SERS substrate) and tested for their potential in NELIBS analysis of liquid samples
the effect of surface coverage, nanoparticle diameter and interparticle distance on the the signal enhancement was assessed and it was found that it is mainly determined by the interparticle distance
a modest, but well repeatable 3x signal enhancement was observed
NELIBS signal repeatability was found to be good (similar to LIBS signal repeatability)
successful NELIBS calibration was performed for liquid samples deposited by spraying on the substrate