ORIGINAL RESEARCH
Monitoring Pneumatic Actuators’ Behavior Using Real‑World Data Set
Tibor Kovacs1 · Andrea Ko1
Received: 7 April 2020 / Accepted: 18 May 2020 / Published online: 11 June 2020
© The Author(s) 2020
Abstract
Developing a big data signal processing method is to monitor the behavior of a common component: a pneumatic actuator.
The method is aimed at supporting condition-based maintenance activities: monitoring signals over an extended period, and identifying, classifying different machine states that may indicate abnormal behavior. Furthermore, preparing a balanced data set for training supervised machine learning models that represent the component’s all identified conditions. Peak detection, garbage removal and down-sampling by interpolation were applied for signal preprocessing. Undersampling the over-represented signals, Ward’s hierarchical clustering with multivariate Euclidean distance calculation and Kohonen self- organizing map (KSOM) methods were used for identifying and grouping similar signal patterns. The study demonstrated that the behavior of equipment displaying complex signals could be monitored with the method described. Both hierarchi- cal clustering and KSOM are suitable methods for identifying and clustering signals of different machine states that may be overlooked if screened by humans. Using the proposed methods, signals could be screened thoroughly and over a long period of time that is critical when failures or abnormal behavior is rare. Visual display of the identified clusters over time could help analyzing the deterioration of machine conditions. The clustered signals could be used to create a balanced set of training data for developing supervised machine learning models to automatically identify previously recognized machine conditions that indicate abnormal behavior.
Keywords Machine learning · Big data processing · Clustering · Kohonen self-organizing map · Condition-based maintenance · Fault detection · Signal pattern identification
Introduction
Smart Manufacturing and Industry 4.0 provide new main- tenance solutions for factories to leverage the ample data produced by sensors and other sensing technologies. Internet of Things, cloud computing and big data analytics all sup- port discovering valuable information about the status of the equipment, its past, present and future conditions. Data coming from sensors, log files and various other sources are available in different forms. Signals from equipment have a key role in the identification of device’s health, how well
it functions and if its condition deviates from past states.
Because of the data volume, velocity, variety and veracity, humans are not able to analyze signal data using traditional manufacturing tools. There are more efficient techniques than inspecting data visually, especially when the patterns describing certain machine conditions are complex and rare.
Condition-based maintenance is a well-established tech- nique in manufacturing. Monitoring equipment parameters like the temperature and vibration of bearings, or the elec- tric current of motors are used by many maintenance opera- tions. When applying these techniques, normally a control limit is set for the monitored parameter, often established empirically, to alert the risk of failure when the parameter is outside the set limits. Preventing machine failure not only reduces the cost of maintenance by preventing consequen- tial damage that often follows breakdowns but could also eliminate making defective products with hidden faults that are difficult to detect [1, 2]. Using smart manufacturing broadens the application of condition-based maintenance, enabling to monitor those types of equipment, where a single
This article is part of the topical collection “Future Data and Security Engineering 2019” guest edited by Tran Khanh Dang.
* Tibor Kovacs
tibor.kovacs@uni-corvinus.hu Andrea Ko
andrea.ko@uni-corvinus.hu
1 Department of Information Systems, Corvinus University of Budapest, Fővám tér 13-15, Budapest 1093, Hungary
control limit is not adequate, that would require the identi- fication of a particular, complex signal pattern [3]. Screen- ing patterns are a well-known method in machine learning (ML), and it is used, e.g., in monitoring network activities to identify intrusions.
The aim of this work is (1) to present an approach to iden- tify and classify different machine states, including the ones that may indicate abnormal behavior by analyzing signal patterns of pneumatic actuators using machine learning tech- niques, (2) to investigate the challenges of processing signals from real-world data and (3) to create a balanced training data set from the classified signal patterns for developing a predictive analytics application that helps identifying those machine states that exhibit equipment malfunctions. Being able to raise early warnings for equipment failure would help improving overall manufacturing performance by improving product quality, boosting efficiency, reducing scrap rates and maintenance costs.
Related Works
Data produced by the modern manufacturing industry show explosive growth reaching more than 1000 EB annually [4].
Manufacturers started to recognize the strategic importance of data; it became a key enabler for manufacturing com- petitiveness [3]. Smart manufacturing aims to exploit the data collected via manufacturing intelligence throughout the product lifecycle in order to make a positive impact on all aspects of manufacturing [5]. Compared with traditional manufacturing, smart manufacturing has an extreme focus on real-time data collection and conversion through physical and computational processes. Data describing the manufac- turing process could usually be obtained from: (a) manu- facturing information systems (e.g., ERP, CRM or SCM), (b) industrial IoT technologies (e.g., operating conditions measured by sensors of a production equipment, (c) smart products and product-service systems by IoT technologies (e.g., product performance in the context of usage condi- tions), (d) social networking and e-commerce platforms (e.g., user data, users profiles and preferences), (e) open databases provided by governments (e.g., civic infrastruc- ture) [3]. Types of manufacturing data can be structured (e.g., databases), semi-structured (e.g., XML documents) or unstructured (e.g., equipment and error logs) [6]. Emerg- ing technologies, like artificial intelligence (AI), the Internet of Things (IoT), cloud computing, mobile Internet, play a strategic role in supporting data-driven manufacturing. Tao et al. [3] proposed the following steps of translating data to useful information, referring to them as “manufacturing data life cycle (MDLF)”: collection, transmission, storage, processing, visualization and application.
Data in a manufacturing environment are collected from numerous sources in a variety of ways. Equipment and prod- uct data are usually collected through smart sensors, RFID tags or other sensing devices aiming to monitor equipment and product behavior in real time. The vast amount of data collected from manufacturing processes must be transmitted and integrated efficiently and stored securely. Traditionally, manufacturing companies stored mainly structured data;
however, recently unstructured data (especially log files) became also valuable sources of information. Data storage in the cloud could be a cost-effective and flexible option; how- ever, because of security restrictions it may not be feasible for many companies. Data processing deals with discover- ing knowledge from large volumes of manufacturing data.
It starts with preprocessing steps of data cleaning and data reduction. Data preprocessing has a crucial impact on the results; it is usually a complex, non-trivial operation. Data cleaning typically includes removing redundant, mislead- ing, duplicated, inconsistent information. In manufacturing practice, missing values are common, and they pose a chal- lenge to the application of machine learning algorithms [7].
There are various approaches for replacing missing values;
however, they influence the original data set. This is a com- mon problem and widely discussed from theoretical and practical aspects in the literature [8, 9]. The following step of data processing is data reduction, which transforms the massive volume of data into ordered, meaningful and simpli- fied forms. Data analysis is the next data processing phase, covering a wide variety of techniques, including machine learning, data mining, time series analysis, large-scale com- puting and the use of forecasting models. Clustering, classi- fication, prediction and deviation analysis from data mining methods are used extensively in this field. Visual analytics and visualization support the communication with end users, and it helps having clear, user-friendly view of the data and understanding the data processing results more easily. Tao et al. [3] recognized three phases of data applications. The first phase (design) helps in demand analysis, smart design and market forecasting through better understanding of cus- tomers, competitors and markets. The second phase (manu- facturing) supports decision making, product quality control and equipment supervision. The third phase (MRO—main- tenance, repair and operations) enriches monitoring opera- tions, fault predictions and smart maintenance.
Compared with the traditional methods, intelligent fault diagnosis is able to rapidly and efficiently process mas- sive amounts of signals, and it could provide accurate fault diagnostic results [10]. Fassois and Sakellariou [11] gave an overview of the principles and techniques of time series methods for fault detection, identification and estimation in vibrating structures. They presented two case studies about (1) fault detection in an aircraft-stiffened panel and (2) fault detection and estimation in an aircraft skeleton structure.
Helwig et al. [1] and Sharma et al. [2] discussed sensor fault detection, while Munirathinam et al. [12] and Al Tobi et al.
[13] dealt with fault prediction. Al Tobi et al. [13] aimed at the automatic fault diagnosis of centrifugal pumps based on artificial intelligence methods. Their data collection was performed in an experimental setup environment, and their suggested data analysis framework included the combination of wavelet transformation, feature extraction and classifi- cation with multilayer perceptron artificial neural network (MLP-ANN) and support vector machine (SVM).
Intelligent fault diagnosis includes the following main steps: signal acquisition, feature extraction and selection, and fault classification [14, 15]. The feature extraction phase aims to extract representative features from the collected sig- nals based on signal processing techniques, like time-domain statistical analysis, Fourier spectral analysis and wavelet transformation [16]. These features may contain useless or insensitive information, k-nearest neighbor (kNN) which could negatively affect the diagnosis results. Feature selec- tion is applied to select sensitive features through dimen- sion reduction strategies, like principal component analysis (PCA), or distance evaluation technique [17]. In the fault classification step, because of the unlabeled data, unsuper- vised learning techniques like clustering and support vector machine (SVM) [18] are used.
Machine learning became popular in manufacturing over the past 20 years. It got the first significant attention in the 1980s, but because of the immature technology and the diffi- culties of implementation at the time, adaption was not high [19]. Currently with increased spreading of the Industrial Internet of Things (IoT), Industry 4.0 and smart manufac- turing more data are being generated than before and ML has new opportunities in manufacturing. Machine learning is a subset of artificial intelligence covering diverse areas.
ML has several definitions, and one widely used is the fol- lowing: ML allows computers to solve problems without being specifically programmed to do so [20]. ML techniques can be structured in various ways. Supervised, unsupervised and reinforcement learning are widely used categories [21], but other taxonomies are available as well. Some research- ers divide ML to active and passive learning, where “active learning is generally used to refer to a learning problem or system where the learner has some role in determining on what data it will be trained” [22] and passive learning describes a situation where the learner has no control over the training set.
ML techniques can be classified according to their role in manufacturing too. Schwabacher and Goebel [23] provided a taxonomy of the Integrated Systems Health Management (ISHM) system. They distinguished model-based and data- driven ISHM algorithms, where in model-based category they had two classes, physics-based (systems of differential equations) and classical AI categories (e.g., expert systems
and qualitative reasoning). Data-driven category includes conventional numerical methods, like linear regression and machine learning. They mapped ISHM problems (fault detection, diagnostics and prognostics) for algorithm types (physics-based, classical AI, conventional numerical meth- ods and machine learning). According to this matrix, cluster- ing as a machine learning method is common in fault detec- tion, underpinning our case. Supervised learning method fits well for challenges and problems faced in manufactur- ing applications as manufacturing data are often labeled and expert feedback is available. Unsupervised learning methods are becoming increasingly important, providing an enor- mous field for research. The typical goal in unsupervised learning is to discover unknown classes of items by cluster- ing, which is a relevant approach in fault detection [24].
Imbalanced class distribution problem is one of the key challenges in machine learning from the beginning [25]. It is a situation where are significantly more instances from one class relative to other classes. In such cases, the classifier can easily misclassify the instances of the less represented classes. The imbalance issue is common in many real-world applications, such as fault identification [26], network intru- sion detection [27], sentiment analysis [28] and fraud detec- tion [29]. There are three common approaches for manag- ing the class imbalance problem [30]: algorithm adaptation, cost-sensitive learning and data resampling. The first two solutions depend on the classifiers; they involve algorithmic adaptation. The third method is about balancing the origi- nal data set, using either undersampling or oversampling approaches, or the combinations—variations of them.
Common examples of unsupervised learning are cluster- ing, association rules and self-organizing maps [31]. Unsu- pervised learning is useful in manufacturing applications for outliers’ identification in manufacturing data [32] or when no expert feedback is available. Due to the fast increase of unlabeled data in manufacturing, hybrid methods that com- bine the machine learning approaches with one or more other approaches are becoming more common [23]. An example for these hybrid methods could be the application of unsupervised learning as data preprocessing for super- vised learning [33]. The class distribution imbalance of a training data set for supervised machine learning poses a performance problem that could be mitigated by balanc- ing the training data set undersampling the majority class.
Lin et al. [33] used undersampling combined with k-nearest neighbor (kNN) clustering to create a balanced training set for training a classifier. In their solution, the majority class data set is divided into a number of bags, and random under- sampling is performed over each bag. Each reduced bag is then combined with the minority class data set to train each of the bagging-based classifiers. Yen and Lee [34] suggested a cluster-based undersampling approach to solve the imbal- anced class distribution problem by using backpropagation
neural network. According to the experiments the SBC (undersampling based on clustering) method has better pre- diction accuracy and stability than other methods (Random selection and NearMiss-2). It has high classification accu- racy on predicting the minority class samples, and it has fast execution time. Their another approach sampling based on clustering with Most Distance (SBCMD) has better predic- tion accuracy and stability when the data sets contain more exceptional samples and disordered samples.
Ofek et al. [30] proposed a clustering-based undersam- pling method called Fast-CBUS that improves Yen and Lee’s method [34] with reduced computational cost. Instead of clustering the entire data set, their proposed method only clusters the minority class instances combined with the sam- ples of the majority class instances closer to the minority class clusters. Their clustering-based undersampling method could improve AUC results, compared with such a well- known method as SMOTE. Fast-CBUS method achieves an optimal trade-off between the computational costs and predictive performance, in terms of training time and AUC.
Having a time complexity similar to their method has less prediction performance, while more complex methods are significantly slower [30].
Case Study: The Proposed Method
This case study is using real-world data, and it is part of a smart manufacturing—predictive analytics R&D project of a Hungarian multinational manufacturer of electrical com- ponents. The company, a global leader in connectivity solu- tions, manufactures a vast range of industrial connectors, cables and electronics components such as sensors, relays and switches. Their products are used in a wide range of applications, including factory machinery, rail and transit vehicles, HVAC systems, medical instrumentation, as well as communication, computers and power supply compo- nents. The company places great importance on research and development; the aim of this work is to monitor the behavior of pneumatic actuators through signal processing, with the longer-term goal of developing condition-based maintenance tools. Data was collected in 2018–2019.
Condition monitoring of rotary machines like bearings is well established. Measuring the temperature or analyzing the vibration spectrum of the part could provide valuable infor- mation about its behavior. Monitoring reciprocating parts could be more difficult as the signals are non-stationary and Fourier spectrum calculations may introduce false alarms or missed detections [35]. Pattern recognition, a technique
Fig. 1 Signal of a sequence of 7 cycles from a pneumatic actuator
that is frequently used in big data applications, could be used in failure prediction more reliably than methods developed for rotary parts. This case study aims at analyzing signals from a common, inexpensive reciprocating part: a pneumatic actuator that is widely used in machines of mass manufactur- ing. The signal is related to the movement generated by the device; the shape of the signal is related to the wear and tear of its parts. The anticipated benefit from being able to pre- dict the failure of the component is not as much of reducing manufacturing or maintenance cost but rather preventing to produce defective products, ones that are difficult to detect.
A signal of 0–20 mV was collected at a frequency of 7.8 × 10⁻⁵ s from the actuator and recorded as .csv files.
This extreme high-frequency signal recording was found to be unnecessary during the data processing and was sub- sequently down-sampled to a frequency of 1.4 × 10⁻² s by interpolation. The down-sampled data still carried sufficient information for the calculations. As the signal recording was automatic, signals were collected for both operating and idling machine states, the latter to be removed. Under normal operating conditions, the actuator runs in a sequence of 6–8 cycles followed by a set waiting time. External condi- tions: mainly compressed air pressure, may affect the cycle
time and the signal amplitude. The cycle time was set to 1.56 s; however, it was not stable, and it could vary as much as 1%. Disturbances like jamming could also influence the cycle time or could even cause the sequence of cycles pre- maturely aborted. Figure 1 shows a sequence of 7 cycles, the fourth being different, indicating defective operation.
The data were processed following the steps that Tao et al. [3] suggested as the “manufacturing data life cycle”:
collection, transmission, storage, processing, visualization and application. Data processing was carried out in R envi- ronment [36]. Approximately 20 GB of data was collected per month, recording more than 400,000 cycles of operation between May 2018 and February 2019. Unfortunately, there was a gap in the recording between July and October 2018 that could have provided compelling information about the performance of the equipment, as our results indicated. Tao et al. [3] point out that data must be preprocessed to remove redundant, misleading and inconsistent information. Data cleaning therefore should take care of missing values, for- mat conversions, duplicates and garbage cleaning. Our data preprocessing started with format conversion transforming the .csv data into xts time series objects [37], enabling to
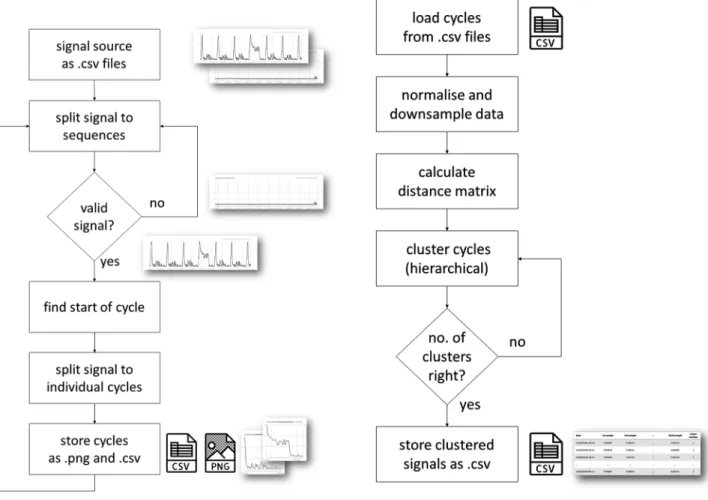
Fig. 2 Process flow of signal preprocessing Fig. 3 Process flow of clustering batches of signals
perform time series functions and transformations in the R environment. The format conversion step also involved removing redundant data from the files (summary statistics calculated and recorded at regular intervals that was part of the .csv files), assigning timestamps to each data points and splitting them to contiguous sequences. Duplicates removal was not necessary in our case; however, there were data of useless information: recordings of idle machine states, empty signals, noise or other erratic signals. Therefore, a garbage cleaning step was required to identify these irrel- evant sequences of empty or erratic signals. An indicator was calculated for each sequence to decide whether the data
should be further analyzed or be discarded. This indicator was defined as the average of the rolling standard deviation of values through a set window. If this indicator was greater than a predefined value, then sequence should have suffi- cient information and was processed further. Other meth- ods, like STL (seasonal time series decomposition utilizing local regression) [38], were also tested, but discarded due to increased computational intensity.
The next step of data preprocessing was splitting the sequences to individual signals of each reciprocating cycles.
The machine cycle starts with a peak, followed by a pat- tern of decreasing values approaching zero value at the
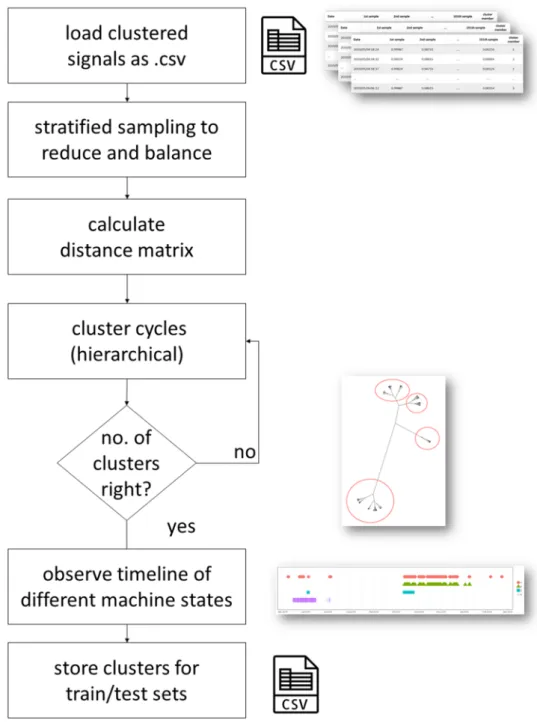
Fig. 4 Assembled clustering large sets of data over longer time period
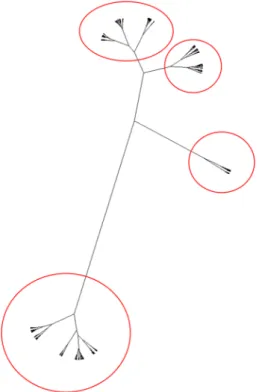
Fig. 5 Unrooted dendrogram of the final set of signals, suggesting the split into 4 clusters
end of the cycle, but not necessarily reaching it. Accord- ing to the technical experts, the shape of the signal carries information about the conditions of the pneumatic actuator.
The height of the initial peak varies, even for consecutive cycles of similar machine conditions, as a result of external factors like changes in air pressure or electric current of the plant. As the cycle time was somewhat instable and the sequences may be aborted due to jamming, and because the operation of the actuator was not encoded in the recorded signals, the start of each cycle had to be identified individu- ally. The start of the cycle was identified through a simple peak-detection method, finding the earliest local maximum above a threshold. This threshold was required as it could not be guaranteed that recordings started at the beginning of a cycle, and it could be started in the middle of a reciprocat- ing cycle. Peak detection was accomplished by a simple hill- climbing algorithm on the data that were processed through of a rolling average function as a noise filter. As the signal not necessarily reached zero value by the end of the cycle, the end was set as a cutoff point at a constant time that was somewhat less than the average cycle time. The shortened cutoff point helped with the instable cycle time issues and made further data processing easier having uniform length of signals. The signals then were split between these start and end times and stored as both .csv files for further processing and .png pictures for the quick observation of a cycle pattern (Fig. 2). The visualization of the cycle patterns, in line with
the MDLF model of Tao et al. [3], was found particularly useful, ensuring that the data preprocessing was executed accurately. It also helped at the next data processing step to identify and compare patterns belonging to different clusters and machine conditions.
Data preprocessing was followed by unsupervised learning of agglomerative hierarchical clustering to clas- sify and group the signals based on the similarity of pat- terns they display (Fig. 3). Euclidean distance was used to calculate the dissimilarity matrix as the input for the clustering. Approximately 20,000 signals were processed in a batch (except one batch that consisted only 5807 sig- nals, from the recordings of one particular time period), the maximum the computer was able to handle at a time, memory being the limiting resource. Setting the appropri- ate number of clusters was done as an iterative, manual process, using the dendrograms of clusters. Different num- bers of clusters were investigated, evaluated by experts.
The clustering was performed using the fastcluster [39] R package applying Ward’s method [40]. Due to the data vol- ume (the distance matrix comprised more than 100 million items for an average batch of signals), computations were accelerated by parallelizing processes and calculating the dissimilarity matrix in graphical processing unit (GPU), using the R packages of doParallel [41], foreach [42] for the parallel execution and the rpud [43] package for the dissimilarity matrix calculation. Data processing was com- pleted by creating a combined .csv file for all signals with cluster memberships marked for further use. Processing signals in separate batches is not only necessary due to the limitations of computing resources, but be also suitable as the behavior of the equipment may be monitored over an extended period. During this extended time, one might want to periodically inspect the condition of the equip- ment, performing the clustering on the signals (Fig. 4).
Once all 21 separate batches of signals were processed and clustered, the data were assembled to create an overall data set. As noted earlier, the maximum number of signals that the computer was capable to calculate distance matri- ces of dissimilarities was approximately 20,000. In order to reduce the size of the data set but still ensuring that all relevant signal clusters are represented in the reduced data set, majority clusters have been undersampled. This has been achieved by taking an equal sample of the small- est batch-cluster combination from each clusters of the 21 batches that were 125 samples. The random undersampling of majority classes was performed using the downSample function of the caret [44] R package. The total number of signals in the undersampled data set was 7250. The clustering process was performed similar to as described above, inspecting the dendrograms and evaluating differ- ent number of clusters. Four clusters were identified based on the dendrogram (Fig. 5), and those typical patterns are
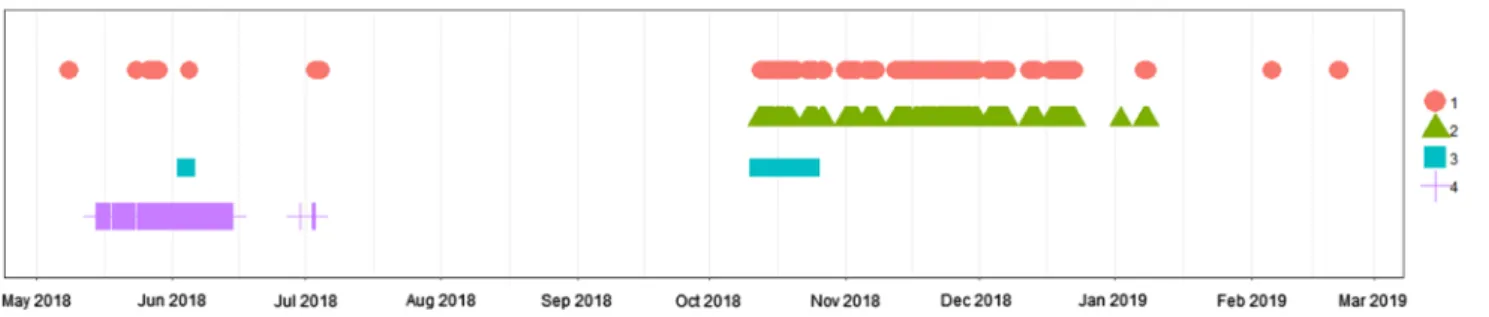
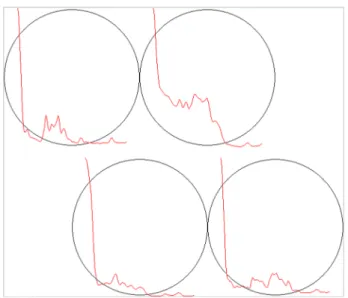
shown in Fig. 6. Cluster 3 displays a pattern that is visually very different from the others. It was recognized by tech- nical experts as defective behavior, and its disappearance after October 2018 is a result of maintenance activities.
As mentioned earlier, there were no data available prior to the appearance of this cluster, although it might have indicated the deterioration of the equipment. Interestingly, Cluster 4-type signals precede the defective behavior that may be an early indication of the deterioration of the
equipment. Showing the different clusters on a timeline (Fig. 7) could be particularly useful for the detection of change in machine status.
As a result of the process described above, it was pos- sible to identify and cluster those distinct signal patterns that may indicate a behavior that deviates from the normal.
Approximately 7% of the signals from the undersampled set fell into this category of abnormal behavior that is typical for many machine learning problems [45]. Patterns displaying
Fig. 6 Signal patterns of a reciprocating cycle indicating different behaviors
Fig. 7 Appearance in time of the different signal pattern clusters of a reciprocating cycle
abnormal behavior were further analyzed using equipment log files, trying to determine the possible reasons for the differences. The output of the data processing: signal pat- terns, is stored in a combined .csv file with their cluster
membership labeled. This data set will be used in the follow- ing phase of the research to build a sample data set (training and test) for building a predictive analytical model (Table 1).
As an alternative method for clustering the signals, Kohonen self-organizing maps (KSOM) were applied, using the “kohonen” R package [46]. KSOM developed by Teuvo Kohonen is one of the most well-known unsupervised learn- ing models [47]. It is a special type of neural network that can learn from complex, multi-dimensional data and can transform them into visually interpretable clusters. Using the analogy with the human sensory system in the brain, the main function of KSOM networks is to map the input data from an n-dimensional space to a lower-dimensional (usually one or two-dimensional) plot while maintaining the original topological relations. Its algorithm is capable of processing high-dimensional data because it is designed to group data into clusters that exhibit some similarities [48].
Each group with similar features belongs to the same node on the map. KSOM supports simultaneous visualization and observation of the clusters [49].
KSOM have been successfully applied as a classification method to various problem domains, including speech rec- ognition [50], image data compression [51], image or char- acter recognition [52], and medical diagnosis [53]. Ahmad
Table 1 Cluster membership of signals by batches
N.B. same cluster numbers may display different patterns in different batches
Batch #1 #2 #3 #4 #5 Total Number of
clusters in batch
Batch 1 5660 14,238 – – – 19,898 2
Batch 2 10,254 14,459 – – – 24,713 2
Batch 3 5436 9670 5983 – – 21,089 3
Batch 4 645 6559 5606 – – 12,810 3
Batch 5 11,735 6367 702 125 – 18,929 4
Batch 6 14,728 6023 – – – 20,751 2
Batch 7 380 2972 2455 – – 5807 3
Batch 8 10,563 5797 1661 – – 18,021 3
Batch 9 12,610 3778 201 – – 16,589 3
Batch 10 7531 8618 2838 – – 18,987 3
Batch 11 14,892 9291 – – – 24,183 2
Batch 12 962 2835 16,672 642 4266 25,377 5
Batch 13 15,788 5499 – – – 21,287 2
Batch 14 17,149 2392 9318 – – 28,859 3
Batch 15 15,141 5372 2289 – – 22,802 3
Batch 16 1599 553 – – – 2152 2
Batch 17 10,695 15,965 4581 – – 31,241 3
Batch 18 6726 1834 13,917 7560 – 30,037 4
Batch 19 18,637 6402 – – – 25,039 2
Batch 20 3310 12,669 6174 – – 22,153 3
Batch 21 15,482 5676 – – – 21,158 2
Total – – – – – 431,882
Fig. 8 Kohonen self-organizing map of the signals using 2 × 2 hex- agonal configuration
et al. [48] applied KSOM for clustering imbalanced data sets, and their results were promising.
In our research, KSOM resulted the same clusters as the hierarchical clustering (Fig. 8). Both methods share simi- larities in terms of both are unsupervised learning methods.
One drawback of KSOM is that prior to creating the map, the number of clusters (the dimension of the grid) must be defined, similarly to k-nearest neighbor (kNN) clustering.
This feature however helps testing different configurations.
There are however advantages of KSOM over hierarchical clustering: it was found to be faster and could handle larger data sets. In our case, it was able to process the entire data set of more than 400,000 signals, making the down-sam- pling unnecessary. An advantage of hierarchical clustering could be that the cluster structures can be visualized in a more expressive way in the R environment, as dendrograms.
Although KSOM can also depict the distances (e.g., using color depth of the Kohonen map), the hierarchical structure may be easier to understand.
Conclusion
Smart manufacturing pays a particular attention to real-time data collection and conversion through physical and compu- tational processes; data became a key enabler for support- ing manufacturing competitiveness, and it has a strategic importance. Data-driven applications could serve different purposes; among others, they could help monitoring opera- tions, predicting malfunctions or supporting smart mainte- nance. This paper presented an approach of monitoring the behavior of pneumatic actuators through signal processing using a real-world data set. This approach could be applied to monitoring other types of equipment, where the shape and the pattern of a signal collected from the equipment carry information about its status and conditions. Data were col- lected from a Hungarian multinational manufacturer of elec- trical components during 2018–2019. Signal preprocessing is not a trivial operation, as confirmed by our work too. The removal of redundant, erratic data and the conversion and its transformation to a format that suits further analysis has a crucial impact on the success of the project. The proposed process enabled scanning through large amount of data, over an extended period to identify, classify and group signals displaying different (normal or faulty) behavior of the equip- ment. The results of this process and its visualization on a timeline could be used to identify those time periods where the equipment behaved differently, and this difference could be analyzed comparing the different patterns of signals. The signal patterns were stored as labeled .csv files, to be used in the next phase of the research building a predictive ana- lytical model. In addition, equipment log files were used to determine the potential reasons of signal patterns deviating
from normal behavior. Our research used real-world data unlike the test bench environment for sensor fault detection in hydraulic systems of Helwig et al. [1] or the experimen- tal environment-based fault diagnosis approach of Al Tobi et al. [13].
The next phase of the research will focus on the prepara- tion of a predictive analytical model of equipment failure aiming at identifying the malfunctions of the pneumatic actuator in advance and developing an early warning sys- tem. Machine learning, artificial neural networks or deep learning methods are considered for developing this predic- tive analytical model, and all require sufficient amount of training and test data sets. One of the key challenges related to the predictive analytical model is the imbalance in the sample data set: significantly less faulty patterns are avail- able than good ones. The applied undersampling process enabled handling large amount of data that might not be done otherwise. This undersampling process may be fine- tuned in the future, considering other methods in the like SMOTE [54], or ADASYN [55].
Acknowledgements Open access funding provided by Corvinus Uni- versity of Budapest (BCE).
Funding Project No. NKFIH-869-10/2019 and its continuation in 2020 have been implemented with the support provided from the National Research, Development and Innovation Fund of Hungary, financed under the Tématerületi Kiválósági Program funding scheme.
Availability of Data and Material Sample set of data is available upon request.
Compliance with Ethical Standards
Conflict of interest Authors are not aware of any conflicts of interest.
Code Availability Available upon request.
Open Access This article is licensed under a Creative Commons Attri- bution 4.0 International License, which permits use, sharing, adapta- tion, distribution and reproduction in any medium or format, as long as you give appropriate credit to the original author(s) and the source, provide a link to the Creative Commons licence, and indicate if changes were made. The images or other third party material in this article are included in the article’s Creative Commons licence, unless indicated otherwise in a credit line to the material. If material is not included in the article’s Creative Commons licence and your intended use is not permitted by statutory regulation or exceeds the permitted use, you will need to obtain permission directly from the copyright holder. To view a copy of this licence, visit http://creat iveco mmons .org/licen ses/by/4.0/.
References
1. Helwig N, Pignanelli E, Schütze A. Detecting and compensating sensor faults in a hydraulic condition monitoring system. Proc Sens. 2015. https ://doi.org/10.5162/senso r2015 /D8.1.
2. Sharma AB, Golubchik L, Govindan R. Sensor faults: detection methods and prevalence in real-world datasets. ACM Trans Sens Netw. 2010;6:1–39. https ://doi.org/10.1145/17544 14.17544 19.
3. Tao F, Qi Q, Liu A, Kusiak A. Data-driven smart manufactur- ing. J Manuf Syst. 2018;48:157–69. https ://doi.org/10.1016/j.
jmsy.2018.01.006.
4. Yin S, Kaynak O. Big data for modern industry: challenges and trends. Proc IEEE. 2015;103:143–6. https ://doi.org/10.1109/
JPROC .2015.23889 58.
5. O’Donovan P, Leahy K, Bruton K, O’Sullivan DTJ. An indus- trial big data pipeline for data-driven analytics maintenance applications in large-scale smart manufacturing facilities. J Big Data. 2015;2:1–26. https ://doi.org/10.1186/s4053 7-015-0034-z.
6. Gandomi A, Haider M. Beyond the hype: big data concepts, methods, and analytics. Int J Inf Manag. 2015;35:137–44. https ://doi.org/10.1016/j.ijinf omgt.2014.10.007.
7. Pham DT, Afify AA. Machine-learning techniques and their applications in manufacturing. Proc Inst Mech Eng Part B J Eng Manuf. 2005;219:395–412. https ://doi.org/10.1243/09544 0505X 32274 .
8. Graham JW. Missing data. New York: Springer; 2012.
9. Kabacoff RI, editors. Advanced methods for missing data. In:
R in action data analysis and graphics with R. Shelter Island:
Manning Publications Co., 2011; p. 472.
10. Lei Y, Jia F, Lin J, et al. An intelligent fault diagnosis method using unsupervised feature learning towards mechanical big data. IEEE Trans Ind Electron. 2016;63:3137–47.
11. Fassois SD, Sakellariou JS. Time-series methods for fault detec- tion and identification in vibrating structures. Philos Trans R Soc A Math Phys Eng Sci. 2007;365:411–48. https ://doi.
org/10.1098/rsta.2006.1929.
12. Munirathinam S, Ramadoss B. Big data predictive analytics for proactive semiconductor equipment maintenance. IEEE Int Conf Big Data (Big Data). 2014;2014:893–902.
13. Al Tobi MAS, Bevan G, Ramachandran KP, et al. Experimental set-up for investigation of fault diagnosis of a centrifugal pump.
World Acad Sci Eng Technol Int J Mech Aerosp Ind Mechatron Manuf Eng. 2017;11:470–4.
14. Worden K, Staszewski WJ, Hensman JJ. Natural computing for mechanical systems research: a tutorial overview. Mech Syst Signal Process. 2011;25:4–111.
15. Shatnawi Y, Al-Khassaweneh M. Fault diagnosis in internal combustion engines using extension neural network. IEEE Trans Ind Electron. 2013;61:1434–43.
16. You D, Gao X, Katayama S. WPD-PCA-based laser welding process monitoring and defects diagnosis by using FNN and SVM. IEEE Trans Ind Electron. 2014;62:628–36.
17. Lei Y, He Z, Zi Y, Chen X. New clustering algorithm-based fault diagnosis using compensation distance evaluation tech- nique. Mech Syst Signal Process. 2008;22:419–35.
18. Yin S, Ding SX, Xie X, Luo H. A review on basic data-driven approaches for industrial process monitoring. IEEE Trans Ind Electron. 2014;61:6418–28.
19. Piddington C, Pegram M. An IMS test case—global manufactur- ing. In: Proceedings of the IFIP TC5/WG5.7 Fifth international conference on advances in production management systems.
North-Holland Publishing Co., Amsterdam, The Netherlands;
1993. p. 11–20.
20. Samuel AL. Some studies in machine learning using the game of checkers. II—Recent progress. IBM J Res Dev. 1967;11:601–
17. https ://doi.org/10.1147/rd.116.0601.
21. Wuest T, Weimer D, Irgens C, Thoben K-D. Machine learn- ing in manufacturing: advantages, challenges, and applications.
Prod Manuf Res. 2016;4:23–45. https ://doi.org/10.1080/21693 277.2016.11925 17.
22. Cohn D. In: Sammut C, Webb GI, editors. Encyclopedia of machine learning. Boston: Springer; 2011. p. 1058.
23. Schwabacher M, Goebel K. A survey of artificial intelligence for prognostics. In: AAAI fall symposium; 2007. p. 107–14.
24. Byington CS, Watson M, Edwards D, Dunkin B. In-line health monitoring system for hydraulic pumps and motors. In: 2003 IEEE aerospace conference proceedings (Cat. No. 03TH8652).
IEEE, p. 3279–87.
25. Kubat M, Matwin S et al. Addressing the curse of imbalanced training sets: one-sided selection. In: ICML; 1997. p. 179–186.
26. Santos P, Maudes J, Bustillo A. Identifying maximum imbal- ance in datasets for fault diagnosis of gearboxes. J Intell Manuf.
2018;29:333–51. https ://doi.org/10.1007/s1084 5-015-1110-0.
27. Tsai C-F, Hsu Y-F, Lin C-Y, Lin W-Y. Intrusion detection by machine learning: a review. Expert Syst Appl. 2009;36:11994–
2000. https ://doi.org/10.1016/j.eswa.2009.05.029.
28. Gopalakrishnan V, Ramaswamy C (2014) Sentiment Learning from Imbalanced Dataset: An Ensemble Based Method.
29. Wei W, Li J, Cao L, et al. Effective detection of sophisticated online banking fraud on extremely imbalanced data. World Wide Web. 2013;16:449–75. https ://doi.org/10.1007/s1128 0-012-0178-0.
30. Ofek N, Rokach L, Stern R, Shabtai A. Fast-CBUS: a fast cluster- ing-based undersampling method for addressing the class imbal- ance problem. Neurocomputing. 2017;243:88–102. https ://doi.
org/10.1016/j.neuco m.2017.03.011.
31. Sammut C, Webb GI. Encyclopedia of machine learning. Boston:
Springer; 2010.
32. Hansson K, Yella S, Dougherty M, Fleyeh H. Machine learn- ing algorithms in heavy process manufacturing. Am J Intell Syst.
2016;6:1–13. https ://doi.org/10.5923/j.ajis.20160 601.01.
33. Lin W-C, Tsai C-F, Hu Y-H, Jhang J-S. Clustering-based under- sampling in class-imbalanced data. Inf Sci. 2017;409–410:17–26.
https ://doi.org/10.1016/j.ins.2017.05.008.
34. Yen S-J, Lee Y-S. Cluster-based under-sampling approaches for imbalanced data distributions. Expert Syst Appl. 2009;36:5718–
27. https ://doi.org/10.1016/j.eswa.2008.06.108.
35. Bardou O, Sidahmed M. Early detection of leakages in the exhaust and discharge systems of reciprocating machines by vibration analysis. Mech Syst Signal Process. 1994;8:551–70. https ://doi.
org/10.1006/mssp.1994.1039.
36. R Core Team. R: a language and environment for statistical com- puting. R Foundation for Statistical Computing: Vienna, Austria;
2017. https ://www.R-proje ct.org/. Accessed 14 May 2020.
37. Ulrich JM, Ryan JA, Bennett R, Joy C. R package ‘xts’; eXtensi- ble time series; 2018. https ://CRAN.R-proje ct.org/packa ge=xts.
Accessed 14 May 2020.
38. Cleveland RB, Cleveland WS, McRae JE, Terpenning I. STL: a seasonal-trend decomposition procedure based on loess. J Off Stat.
1990;6:3–73.
39. Müllner D. Fastcluster: fast hierarchical, agglomerative clustering routines for R and Python. J Stat Softw. 2015;53:1–18. https ://doi.
org/10.18637 /jss.v053.i09.
40. Ward JHJ. Hierarchical grouping to optimize an objective function.
J Am Stat Assoc. 1963;58:236–44. https ://doi.org/10.1080/01621 459.1963.10500 845.
41. Calaway R, Microsoft, Weston S, Tenenbaum D. R package:
doParallel; 2018. https ://cran.r-proje ct.org/packa ge=doPar allel . Accessed 14 May 2020.
42. Calaway R, Microsoft, Weston S. R package: foreach; 2017. https ://cran.r-proje ct.org/packa ge=forea ch. Accessed 14 May 2020.
43. Yau C. R package ‘rpud’: R functions for computation on GPU;
2015. http://www.r-tutor .com/gpu-compu ting. Accessed 14 May 2020.
44. Kuhn M. Building predictive models in R using the caret package.
J Stat Softw. 2008;28:1–26. https ://doi.org/10.18637 /jss.v028.i05.
45. Weiss GM. Imbalanced learning: foundations, algorithms, and applications: foundations of imbalanced learning. Hoboken:
Wiley; 2012. p. 13–41.
46. Wehrens R, Buydens LMC. Self- and super-organizing maps in R: the Kohonen package. J Stat Softw. 2007;21:1–19. https ://doi.
org/10.18637 /jss.v021.i05.
47. Kohonen T. The self-organizing map. Proc IEEE. 1990;78:1464–
80. https ://doi.org/10.1109/5.58325 .
48. Ahmad A, Yusoff R, Ismail MN, Rosli NR. Clustering the imbal- anced datasets using modified Kohonen self-organizing map (KSOM). In: 2017 computing conference. IEEE. p. 751–5.
49. Kiang MY. Extending the Kohonen self-organizing map networks for clustering analysis. Comput Stat Data Anal. 2001;38:161–80.
https ://doi.org/10.1016/S0167 -9473(01)00040 -8.
50. Leinonen L, Mujunen R, Kangas J, Torkkola K. Acoustic pattern recognition of fricative-vowel coarticulation by the self-organiz- ing map. Folia Phoniatrica et Logopaedica. 1993;45:173–81. https ://doi.org/10.1159/00026 6245.
51. Manikopoulos CN. Finite state vector quantisation with neural network classification of states. IEE Proc F Radar Signal Process.
1993;140:153. https ://doi.org/10.1049/ip-f-2.1993.0022.
52. Del Bimbo A, Campanai M, Nesi P. A three-dimensional iconic environment for image database querying. IEEE Trans Softw Eng.
1993;19:997–1011. https ://doi.org/10.1109/32.24574 1.
53. Vercauteren L, Sieben G, Praet M, et al. The classification of brain tumours by a topological map. In: Proceedings of the international neural networks conference, Paris; 1990. p. 387–91.
54. Chawla NV, Bowyer KW, Hall LO, Kegelmeyer WP. SMOTE:
synthetic minority over-sampling technique Nitesh. J Artif Intell Res. 2002;16:321–57. https ://doi.org/10.1613/jair.953.
55. He H, Bai Y, Garcia EA, Li S. ADASYN: adaptive synthetic sam- pling approach for imbalanced learning. In: 2008 IEEE interna- tional joint conference on neural networks (IEEE world congress on computational intelligence); 2008. p. 1322–8.
Publisher’s Note Springer Nature remains neutral with regard to jurisdictional claims in published maps and institutional affiliations.